


Analyst expectations and management commentary are two important signals investors use to interpret a company's outlook. Before each earnings announcement, equity analysts publish forecasts for metrics such as earnings per share (EPS) and revenue, while company executives use earnings calls to describe business conditions, growth trends, and future priorities.
When Expectations and Management Narrative Diverge
In many cases, analyst expectations and management tone move in the same direction. Rising estimates are often accompanied by optimistic commentary, while declining expectations typically align with more cautious messaging. However, situations occasionally emerge where these signals diverge. Analysts may raise estimates while management commentary becomes cautious, or expectations may decline even as executives highlight strong momentum in the business.
These divergence scenarios are often more informative than aligned signals, as they may indicate gaps between market expectations and management's internal view of business conditions.
What We Will Build in This Article
In this article, we build a divergence detector that compares analyst estimate trends with the tone of management commentary in earnings call transcripts. Using Financial Modeling Prep APIs and Python, we retrieve analyst consensus estimates, analyze transcript tone, and construct a signal that highlights when analyst expectations and management narrative move in different directions.
This workflow provides a simple and reusable framework that analysts can apply to identify sentiment gaps between market expectations and executive communication. In practice, these divergence signals can highlight situations where consensus expectations begin to drift away from management's internal outlook, helping analysts detect emerging expectation risk before it becomes visible in forecast revisions or earnings outcomes.
Financial Modeling Prep APIs Used
To build the divergence detector, we combine two different types of datasets: analyst expectations and management commentary. Analyst estimate data allows us to measure how market expectations evolve over time, while earnings call transcripts provide the narrative tone used by company executives when discussing business performance.
Financial Modeling Prep provides APIs for both of these datasets. By combining them, we can compare how analyst expectations change relative to the tone of management commentary during earnings calls.
The following APIs are used throughout the workflow.
- Analyst Estimates API: This API provides consensus analyst estimates for metrics such as earnings per share and revenue. We use this data to evaluate how analyst expectations change over time and construct an estimate trend signal.
- Earnings Call Transcript API: This endpoint returns the full text of company earnings call transcripts. The transcripts include management commentary discussing financial performance, guidance, operational risks, and future outlook.
In this article, the transcript text will be processed to construct a tone indicator, enabling comparison between management narrative and analyst estimate revisions.
Together, these two datasets allow us to evaluate whether analyst expectations and management tone are aligned or diverging, forming the foundation of the analytical workflow developed in the following sections.
How to Get Your API Key
To access Financial Modeling Prep's APIs, you need a valid API key.
Create an account using the official registration page.
After registration, your API key will be available in your dashboard. Replace "YOUR_API_KEY" in the code examples below with your personal key to authenticate requests.
Framework Definition: Detecting Estimate-Tone Divergence
Analyst expectations and management communication represent two distinct perspectives on a company's outlook. Analyst estimates summarize the consensus view produced by financial models and research coverage. Earnings call transcripts, in contrast, capture management's own narrative about demand conditions, operational risks, and forward visibility.
The framework developed in this article compares these two perspectives. The objective is to identify situations where analyst expectations improve while management commentary becomes cautious, or where analyst expectations weaken despite confident management language. Such mismatches can reveal situations where market expectations and corporate communication are no longer aligned.
Core Logic of the Framework
The framework evaluates two independent signals that capture different perspectives on the company's outlook.
The first signal measures analyst estimate revisions. Analyst forecasts are frequently updated as new information becomes available. Tracking the direction of these revisions allows us to determine whether forward expectations are strengthening or deteriorating.
The second signal evaluates management tone extracted from earnings call transcripts. During earnings calls, executives discuss operating conditions, demand trends, cost pressures, and strategic priorities. The language used in these discussions can indicate confidence, caution, or uncertainty regarding the company's near-term outlook.
By comparing these two signals, the framework identifies whether expectations and management narrative move together or diverge.
Divergence Interpretation
The interaction between estimate revisions and management tone produces four analytical outcomes.
Aligned Optimism
When analyst estimates improve and management tone remains positive, both quantitative expectations and management commentary point in the same direction. This alignment suggests that consensus forecasts reflect the company's communicated outlook.
Aligned Caution
When analyst estimates decline and management tone becomes cautious, both signals indicate a weakening outlook. In these cases, analyst revisions appear consistent with the risks and uncertainties highlighted during the earnings call.
Optimistic Divergence
When analyst estimates continue to improve while management language becomes cautious, expectations and narrative diverge. Analysts may be incorporating optimistic assumptions while management communication reflects growing uncertainty around demand, margins, or operating conditions.
Reverse Divergence
When analyst estimates weaken but management tone remains confident, the divergence moves in the opposite direction. Analysts may be revising forecasts downward even though management commentary continues to emphasize operational strength or growth opportunities.
Detecting these divergence patterns provides an additional analytical layer beyond simple estimate tracking. By combining structured estimate data with narrative analysis from earnings transcripts, analysts can identify situations where consensus expectations and management communication begin to move out of alignment, potentially signaling emerging expectation risk.
Why Compare Analyst Estimates with Management Tone
Analyst estimates represent the market's quantitative expectations for a company's future performance. Changes in analyst forecasts are widely used in quantitative workflows to monitor shifts in market expectations, similar to how analysts track forecast-based momentum signals when evaluating estimate trends across reporting periods. These forecasts incorporate financial models, industry assumptions, and recent company disclosures. As analysts update their models, revisions in expected earnings or revenue provide a structured view of how consensus expectations evolve over time.
Management communication during earnings calls offers a different type of signal. Executives discuss operational trends, customer demand, supply constraints, margin pressures, and strategic priorities. While these discussions may not always provide explicit numerical guidance, the language and tone used by management often reveal their level of confidence in upcoming business conditions.
Analyzing only one of these perspectives can produce an incomplete picture. Analyst estimates capture the numerical expectations embedded in market models, but they do not always reflect subtle shifts in management commentary. Similarly, transcript analysis can highlight narrative changes but may lack the structured context provided by consensus forecasts.
Comparing these signals helps bridge this gap. When estimates and management tone move together, expectations and narrative appear aligned. When they diverge, it may indicate that market expectations and management communication are beginning to drift apart.
For example, analysts may continue raising earnings estimates following strong performance, while management begins emphasizing risks such as cost pressures or slowing demand. This divergence highlights a potential gap between consensus expectations and the company's internal outlook.
For this reason, the framework focuses on two signals: analyst estimate revisions and earnings call transcript tone. Together, they provide a structured way to evaluate whether market expectations remain consistent with management communication.
Defining the Two Signals
The divergence detector relies on two complementary signals: one capturing how market expectations evolve, and the other reflecting how management communicates the company's outlook.
Analyst Estimate Revision Signal
The first signal measures changes in analyst expectations over time. Analysts update their forecasts based on new information such as company guidance, macroeconomic trends, and industry developments.
Tracking these revisions helps determine whether expectations are strengthening or weakening.
Analysts often visualize these revisions using techniques such as analyst estimate and price target heatmaps, which highlight how sentiment evolves across different forecast periods.
In this framework, the estimate signal is constructed using Financial Modeling Prep's Analyst Estimates API by measuring changes in consensus earnings values over time.
Earnings Call Transcript Tone Signal
The second signal evaluates management tone using earnings call transcripts. During these calls, executives discuss performance, demand trends, and future outlook.
By analyzing the language used, we construct a tone indicator reflecting whether management communication appears confident or cautious. Positive language highlights growth and momentum, while cautious language emphasizes risks and uncertainty.
This framework retrieves transcript data from the Financial Modeling Prep Earnings Call Transcript API and processes the text to estimate management tone.
Together, these signals allow us to evaluate whether numerical expectations and management narrative are aligned or diverging.
Retrieving Analyst Estimate Data
The first step in the workflow is to retrieve analyst forecast data and organize it into a structured dataset. These forecasts represent the market's forward expectations for company performance. By observing how estimates evolve across reporting periods, we can construct a signal that reflects whether analysts are becoming more optimistic or more cautious.
Financial Modeling Prep provides analyst estimate data through the Analyst Estimates API. The endpoint returns analyst projections for several financial metrics, including earnings per share, revenue, operating income, and other forward-looking estimates.
In this section, we retrieve the dataset and convert it into a clean dataframe that can be used for revision analysis.
Python Implementation
The following example retrieves analyst estimates for NVIDIA and loads the response into a pandas dataframe.
|
import requests import pandas as pd API_KEY = "YOUR_API_KEY" symbol = "NVDA" url = f"https://financialmodelingprep.com/api/v3/analyst-estimates/{symbol}?apikey={API_KEY}" response = requests.get(url) data = response.json() df_estimates = pd.DataFrame(data) df_estimates.head() |
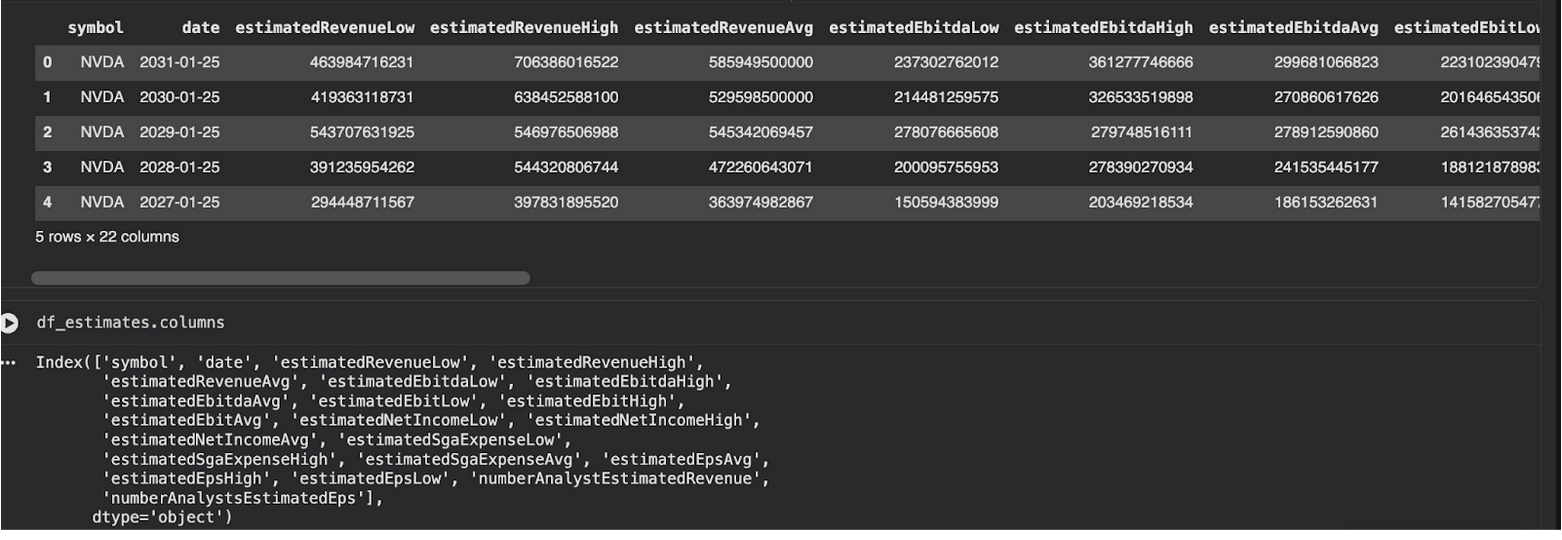
Interpretation
The dataset provides forward-looking analyst projections across multiple financial metrics. Each row represents a future reporting period, while columns contain consensus values such as low, high, and average estimates.
Key fields include estimatedRevenueAvg and estimatedEpsAvg, which capture average revenue and earnings expectations. These serve as primary inputs for measuring estimate trends.
The dataset also includes analyst coverage fields such as numberAnalystsEstimatedRevenue and numberAnalystsEstimatedEps, which indicate how broadly the estimates are supported.
Retrieving Earnings Call Transcript Data
The second input required for the divergence framework is the earnings call transcript. While analyst estimates capture structured numerical expectations, earnings call transcripts provide a narrative description of how management interprets current business conditions.
During earnings calls, executives discuss revenue drivers, demand trends, operating challenges, and future outlook. The language used in these discussions can often reveal subtle signals about management confidence, uncertainty, or caution. By retrieving the transcript text, we can later construct a tone indicator that reflects the overall narrative communicated by company leadership.
Financial Modeling Prep provides transcript data through the Earnings Call Transcript API, which returns the full text of a company's earnings call for a specific quarter and year. A detailed walkthrough of retrieving and processing earnings transcripts using this endpoint is available in the FMP guide on working with earnings call transcripts through the API.
Python Implementation
The following example retrieves the earnings call transcript for NVIDIA.
|
import requests import pandas as pd API_KEY = "YOUR_API_KEY" symbol = "NVDA" quarter = 4 year = 2023 url = f"https://financialmodelingprep.com/api/v3/earning_call_transcript/{symbol}?quarter={quarter}&year={year}&apikey={API_KEY}" response = requests.get(url) data = response.json() df_transcript = pd.DataFrame(data) df_transcript.head() |

Interpretation
The dataset contains the earnings call transcript for the selected period, along with metadata such as company symbol, quarter, year, and call date.
The most important field is content, which includes the full transcript covering management discussion and analyst Q&A.
This text serves as the input for tone analysis, allowing us to evaluate whether management communication appears confident, cautious, or neutral.
Measuring Management Tone from Earnings Transcripts
Once the transcript text is retrieved, the next step is to convert the narrative discussion into a measurable tone signal. Earnings call transcripts contain extensive commentary from management about demand trends, operating conditions, and future expectations. Although this information is expressed qualitatively, the language used during these discussions often reveals whether management communication appears confident or cautious.
To construct a simple tone indicator, we can evaluate the frequency of positive and caution-related keywords within the transcript. Positive language may emphasize growth, strong demand, momentum, or opportunities. More cautious language may highlight uncertainty, pressure, risk, or macroeconomic challenges.
This approach does not attempt to build a full sentiment model. Instead, it provides a simple and reproducible tone measure that allows us to compare management narrative with analyst estimate revisions. This approach prioritizes transparency and reproducibility, allowing analysts to easily adjust keyword definitions and replicate the tone signal without relying on external NLP libraries or pretrained sentiment models.
Python Implementation
The following code calculates a basic tone score by counting positive and caution-related keywords within the transcript text.
|
import re # Note: Earnings call transcripts include prepared remarks, analyst questions, # and management responses. This workflow analyzes the full transcript as a # single block of text. In more advanced workflows, analysts may isolate # management remarks or Q&A responses to focus more directly on management sentiment. # Extract transcript text transcript_text = df_transcript['content'][0].lower() # Define keyword groups positive_words = [ "strong", "growth", "record", "momentum", "opportunity", "expansion", "accelerate", "robust", "confidence", "improvement" ] cautious_words = [ "uncertain", "pressure", "risk", "slowdown", "challenge", "cautious", "volatility", "weakness", "constraint", "headwind" ] # Count occurrences positive_count = sum(len(re.findall(word, transcript_text)) for word in positive_words) cautious_count = sum(len(re.findall(word, transcript_text)) for word in cautious_words) tone_score = positive_count - cautious_count print("Positive keyword count:", positive_count) print("Cautious keyword count:", cautious_count) print("Tone score:", tone_score) |

Interpretation
The tone analysis shows a strong imbalance between positive and cautious language, with 76 positive keyword matches versus 5 caution-related terms, resulting in a tone score of 71.
This indicates that management communication emphasized growth, momentum, and favorable business conditions.
However, raw counts should be interpreted carefully, as longer transcripts may naturally contain more keyword occurrences. In advanced workflows, tone scores are often normalized by transcript length.
The tone score should be viewed as a directional indicator rather than a precise sentiment measure. A higher score reflects stronger positive emphasis, while a lower or negative score suggests increased focus on risks or uncertainty.
Constructing the Estimate-Tone Divergence Detector
With both inputs prepared, the final step is to combine the analyst estimate signal and the management tone signal into a single analytical indicator. The objective is to determine whether market expectations and management communication are aligned or diverging.
The estimate signal captures how forward expectations evolve through analyst forecast updates. The tone signal captures how management describes current business conditions and future outlook during the earnings call. When these two signals move in the same direction, expectations and narrative appear consistent. When they move in opposite directions, a divergence may exist.
To construct the divergence detector, we first evaluate the direction of analyst expectations using the consensus EPS estimate. Then we compare this direction with the transcript tone score calculated in the previous section.
Before implementing the classification logic, we define how the interaction between estimate direction and management tone maps to the four divergence states. When both signals move in the same direction, expectations and narrative are aligned. When they move in opposite directions, a divergence is identified.
Specifically:
- Improving estimates + positive management tone → Aligned Optimism
- Weakening estimates + cautious management tone → Aligned Caution
- Improving estimates + cautious management tone → Optimistic Divergence
- Weakening estimates + positive management tone → Reverse Divergence
Python Implementation
The following example derives a simple estimate direction signal and combines it with the transcript tone score.
|
# Sort estimates chronologically df_estimates_sorted = df_estimates.sort_values("date") # Use consensus EPS estimates eps_series = df_estimates_sorted["estimatedEpsAvg"] # Note: This calculation compares consensus EPS estimates across forecast horizons # (earliest vs latest available periods), rather than measuring true analyst revisions over time. # It provides a simple directional indicator of how forward expectations change across periods, # but does not capture revision momentum from successive estimate updates. estimate_trend = eps_series.iloc[-1] - eps_series.iloc[0] # Measure estimate trend estimate_trend = eps_series.iloc[-1] - eps_series.iloc[0] if estimate_trend > 0: estimate_signal = "Improving Estimates" else: estimate_signal = "Weakening Estimates" # Tone signal from previous section if tone_score > 0: tone_signal = "Positive Management Tone" else: tone_signal = "Cautious Management Tone" print("Estimate Signal:", estimate_signal) print("Tone Signal:", tone_signal) # Divergence classification if estimate_signal == "Improving Estimates" and tone_signal == "Positive Management Tone": divergence_state = "Aligned Optimism" elif estimate_signal == "Weakening Estimates" and tone_signal == "Cautious Management Tone": divergence_state = "Aligned Caution" elif estimate_signal == "Improving Estimates" and tone_signal == "Cautious Management Tone": divergence_state = "Optimistic Divergence" else: divergence_state = "Reverse Divergence" print("Divergence State:", divergence_state) |

Interpretation
The analysis shows that analyst expectations and management communication are aligned. The estimate signal indicates improving forward EPS expectations across forecast horizons, while the transcript tone reflects a positive management narrative.
This result is classified as Aligned Optimism, where both quantitative expectations and management commentary point in the same direction.
In such cases, consensus forecasts appear consistent with the company's communicated outlook, reducing the likelihood of near-term expectation mismatches.
Mini Case Study: NVIDIA Estimate-Tone Alignment
To illustrate how the divergence framework works in practice, we apply the workflow to NVIDIA using the analyst estimate data and earnings call transcript retrieved in the previous sections.
The estimate analysis shows that forward EPS expectations are improving. The consensus estimate for later reporting periods is higher than earlier projections, with the estimate trend calculated as a positive difference between the earliest and latest consensus EPS values. This indicates that analysts have gradually revised their expectations upward across forecast horizons. Such upward revisions typically occur when analysts incorporate stronger assumptions about revenue growth, margins, or demand trends into their models.
At the same time, the transcript tone analysis indicates that management communication during the earnings call was strongly positive. The transcript contained 76 occurrences of positive keywords compared with only 5 caution-related terms, resulting in a tone score of 71. This suggests that management discussion emphasized favorable business momentum, strong demand conditions, and growth opportunities.
When these two signals are combined, the framework classifies the result as Aligned Optimism. In this case, both quantitative expectations and management narrative point in the same direction. Analysts appear to be revising their forecasts upward while management commentary reinforces confidence in the company's operating environment.
Situations like this typically indicate that market expectations are broadly consistent with the company's communicated outlook. In contrast, if analyst estimates had continued improving while management language turned cautious, the framework would have flagged an optimistic divergence, signaling a potential mismatch between consensus expectations and management communication.
How Analysts Can Use the Divergence Signal
The estimate-tone divergence framework provides analysts with an additional layer of insight beyond traditional estimate tracking. By comparing numerical expectations with management communication, the signal helps identify whether consensus forecasts remain aligned with the company's narrative about business conditions.
One practical application is monitoring expectation risk ahead of earnings announcements. If analyst estimates continue to improve while management commentary becomes more cautious, the divergence may indicate that consensus forecasts are becoming overly optimistic. Such situations can increase the probability of estimate revisions or earnings surprises.
The framework can also help analysts prioritize companies for deeper review. Firms where expectations and management tone remain aligned typically require less immediate investigation. In contrast, divergence cases highlight situations where the market's quantitative expectations and management's qualitative outlook may be moving in different directions.
Finally, the signal can be incorporated into broader research workflows. Analysts can track divergence patterns across multiple companies or sectors to identify cases where market expectations and management communication begin to drift apart, potentially revealing emerging shifts in sentiment before they appear in formal guidance or forecast revisions.
Limitations of the Framework
The divergence detector is intentionally simple. It is designed to highlight situations where analyst expectations and management communication appear to move in different directions. While this simplicity makes the framework easy to implement and interpret, it also leaves room for more advanced extensions.
For example, analysts could expand this workflow by tracking estimate revisions across multiple update timestamps to measure true revision momentum, applying more advanced NLP-based sentiment scoring techniques to capture contextual meaning, comparing divergence signals across a broader universe of companies, or building ranking systems to identify the largest estimate-tone mismatches across sectors or time periods.
However, the tone analysis relies on a keyword-based approach, which cannot fully capture the context behind management statements. Earnings call transcripts also contain multiple voices. Prepared remarks, analyst questions, and management responses are all included in the same text. This mixture can influence the overall tone score, even though not all segments carry the same analytical weight.
Another limitation relates to analyst estimates themselves. Forecast revisions often occur gradually and may reflect new information released after the earnings call. Because of this timing difference, short-term divergence between estimates and management tone does not always indicate a meaningful shift in expectations.
For this reason, the divergence signal should be viewed primarily as a screening indicator. It highlights situations that may deserve deeper analysis rather than providing a standalone conclusion about a company's outlook.
Conclusion
This article introduced a practical framework for detecting divergence between analyst estimate revisions and management tone in earnings call transcripts.
Using Financial Modeling Prep's Analyst Estimates API, we first retrieved forward-looking analyst forecasts and evaluated how consensus expectations evolve over time. These estimate revisions provide a structured view of how analysts adjust their projections as new information enters the market.
We then used Financial Modeling Prep's Earnings Call Transcript API to access management commentary from the company's earnings call. By analyzing the language used during the discussion, we constructed a simple tone indicator reflecting whether management communication appears confident or cautious.
Combining these two datasets allows analysts to evaluate whether numerical expectations and management narrative remain aligned. When both signals move together, consensus expectations appear consistent with management's outlook. When they diverge, it may indicate that market expectations and management communication are beginning to tell different stories.
Financial Modeling Prep makes this type of analysis possible by providing both structured financial forecasts and full transcript data through accessible APIs. Developers and analysts can review available datasets and subscription tiers on the Financial Modeling Prep pricing page, which outlines access to analyst estimates, transcript data, and other financial APIs. By integrating these datasets into analytical workflows, investors and researchers can move beyond isolated signals and develop more comprehensive frameworks for interpreting earnings expectations.







