


Earnings data APIs provide access to three core components: earnings call transcripts, company-issued guidance, and actual reported financial results. Together, these form a single earnings event that must be aligned for accurate analysis.
Most workflows break because these components exist in separate systems. Transcripts are unstructured text, guidance is embedded in disclosures, and actual results are reported through standardized financial statements and filings. Each layer uses different formats, timing, and identifiers.
Institutional platforms address this by pre-aligning these datasets before users interact with them. APIs expose the same underlying data more flexibly, but the responsibility for aligning transcripts, guidance, and results still sits with the system design.
A scalable earnings workflow depends on connecting these three layers into a unified structure. The core challenge is not access, but alignment, linking the correct commentary, guidance, and reported results to the same company, reporting period, and disclosure timeline.
Where Can I Access Historical Guidance vs. Actual Results Comparisons?
Historical guidance versus actual results comparisons are available through platforms and APIs that track company-issued guidance alongside reported financial results. At a basic level, this is a comparison between what management expected and what the company ultimately reported.
In practice, this includes revenue guidance, EPS guidance, margin targets, segment-level expectations, and other forward-looking operating metrics. The usefulness of the comparison depends on whether the guidance was known before the reporting period ended or before results were released.
Timing is critical. Guidance issued during a prior earnings call, updated mid-quarter, or revised in a press release should not be treated as equivalent unless the system preserves when that information was available to the market.
Where the Data Comes From
The source data typically comes from earnings releases, investor relations pages, earnings call transcripts, and SEC filings. Form 8-K Item 2.02 is commonly used when a public company announces results of operations or financial condition, which makes it an important disclosure source for earnings-event pipelines.
Why Guidance Is Difficult to Standardize
The difficulty is that guidance is not standardized across companies. Some companies provide revenue ranges, some give EPS ranges, some guide only at the segment level, and others provide qualitative language without a clean numeric target.
Even when the metric is numeric, it may be range-based. A revenue outlook of “$4.2 billion to $4.4 billion” has to be converted into a midpoint, lower and upper bound, or probability distribution before it can be compared consistently across issuers.
Institutional platforms such as Bloomberg, FactSet, and Refinitiv typically handle more of this modeling and standardization inside the platform. FactSet, for example, provides event and transcript data through APIs, while Refinitiv offers earnings transcript and briefs coverage for large-scale company research workflows.
APIs provide more control and flexibility for building these workflows. They expose transcripts, press releases, filings, earnings calendars, and financial statements that can be combined into custom guidance-versus-actual systems. The normalization layer, including mapping guidance fields, aligning reporting periods, and connecting results, becomes part of the system design.
Financial Modeling Prep fits this second category. FMP provides access to earnings calendars, transcripts, press releases, income statements, and as-reported financial statements, which can support custom guidance-versus-actual workflows. It should be positioned as an API layer for building those workflows, not as a fully standardized institutional guidance database.
What's the Best Way to Pull Earnings Call Transcripts Programmatically?
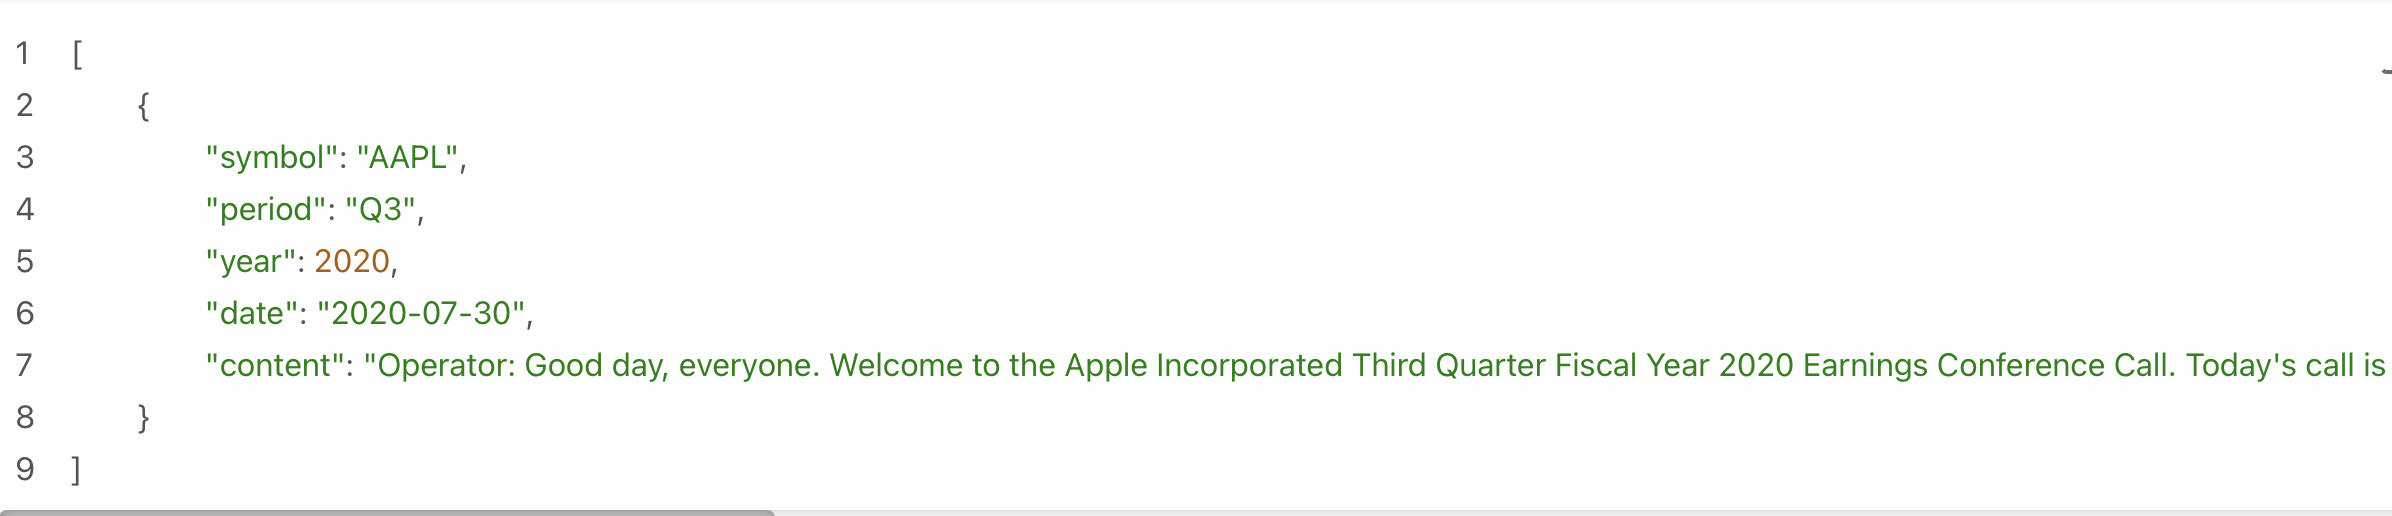
Earnings call transcripts can be pulled programmatically through APIs that return structured or semi-structured transcript text. The most useful transcript data includes speaker labels, prepared remarks, Q&A segmentation, and enough metadata to connect the call to a specific company and fiscal period.
FMP's Earnings call transcript example:
How Transcripts Are Structured
A production transcript record should distinguish management commentary from analyst questions. CEO and CFO remarks often contain strategic framing and forward-looking language, while analyst Q&A can reveal pressure points, clarifications, or changes in tone.
The structure matters because downstream systems rarely analyze transcripts as a single block of text. They extract topics, classify forward-looking statements, isolate guidance-related language, and compare management tone across quarters.
How Transcripts Are Used in Workflows
Common access methods include REST APIs for on-demand retrieval and bulk downloads for historical backfills. FactSet's Events and Transcripts API, for example, includes calendar event data, near real-time transcripts, and XML transcripts, while FMP provides developer-accessible earnings transcript endpoints and transcript date discovery.
The main use cases are not generic sentiment scoring. Analysts and data teams usually want to identify which topics changed, whether management narrowed or widened guidance language, how commentary differs from prior quarters, and whether narrative tone diverges from reported performance.
|
For example, a workflow might extract all CFO comments about gross margin, compare them to prior-quarter language, then link those comments to actual gross margin in the income statement. That requires transcript text, speaker segmentation, period alignment, and financial statement data in the same event model. |
Enterprise transcript workflows also depend on formatting consistency. If one company's transcript separates prepared remarks and Q&A cleanly while another blends them, the normalization layer has to resolve that before text analytics can scale.
Latency is another consideration. Near-real-time transcript access may matter for event-level workflows, while historical coverage depth matters more for backtesting and longitudinal analysis.
FMP's transcript data functions as the narrative layer within an earnings pipeline. It provides structured transcript access that can be integrated with guidance records, disclosure events, and actual reported outcomes as part of a unified event model.
How Do I Retrieve Revenue and EPS Guidance Ranges by Company?
Revenue and EPS guidance ranges are retrieved from company disclosures, not from a single universally standardized field. The source may be an earnings press release, investor relations page, 8-K exhibit, earnings call transcript, or a later guidance update.
Why Guidance Requires Normalization
Guidance can take several forms. Revenue and EPS ranges are the most common numeric targets, but companies may also guide to operating margin, gross margin, adjusted EBITDA, free cash flow, capital expenditure, tax rate, or segment-level growth.
The data is messy by design. Management teams disclose guidance differently depending on sector, reporting practice, investor expectations, and internal planning cycles.
|
One company may provide a full-year revenue range and quarterly EPS guidance. Another may provide only qualitative commentary such as “continued margin expansion” or “mid-single-digit growth.” |
Range-based guidance requires a normalization layer. A system may store the low end, high end, midpoint, source text, metric definition, period covered, and disclosure timestamp.
Metric definitions must also be standardized. Adjusted EPS, diluted EPS, GAAP EPS, non-GAAP EPS, consolidated revenue, organic revenue, and segment revenue should not be collapsed into one field.
The same applies to actual results. A guidance range for adjusted EPS should be compared with the corresponding adjusted EPS result, not automatically with GAAP diluted EPS from the income statement.
Institutional platforms often model this complexity into standardized guidance datasets. That gives users pre-aligned metrics, source tracking, historical comparisons, and tools for evaluating guidance accuracy.
APIs expose the underlying inputs. FMP's Press Releases and Search Press Releases APIs provide access to official company announcements, including earnings-related releases, while its transcript endpoints can surface management commentary where guidance language often appears.
Actual results can then be retrieved from financial statement APIs. FMP's Income Statement API provides standardized income statement data, while its As Reported Income Statements API retrieves income statements as reported by the company in official financial statements.
The critical step is not retrieval. It is converting raw disclosure language into normalized guidance records and aligning those records with the correct actual result.
Why Earnings Data Is Difficult to Standardize Across Companies
Earnings data is difficult to standardize because companies do not disclose forward-looking information in a uniform way. Guidance can be numeric, qualitative, partial, updated, withdrawn, or limited to specific operating segments.
Companies also express guidance differently. Some provide point estimates, while others give ranges, multi-year targets, or directional language that cannot be converted into a single value without assumptions.
Timing introduces another layer of complexity. Guidance may be issued with a prior-quarter earnings release, revised during an investor day, updated in a press release, or clarified during the Q&A portion of an earnings call. A reliable system must preserve what was known at each point in time. Without that, analysis can introduce lookahead bias by comparing actual results against guidance that was not available when expectations were originally formed.
Narrative and numeric data are also structurally separate. Transcripts contain management commentary and forward-looking language, while financial statements contain reported outcomes. These datasets are not inherently linked and are often indexed differently, such as by fiscal period, filing date, or transcript event.
Metric inconsistency creates additional friction. Adjusted metrics may exclude restructuring costs, stock-based compensation, acquisition effects, or other items that reported GAAP metrics include. Segment reporting adds further complexity, as companies may guide to specific business lines while reporting only consolidated financial results.
This is why earnings data standardization is fundamentally a data engineering problem. It requires entity resolution, event modeling, period alignment, metric mapping, source preservation, and auditability.
How Institutional Platforms vs APIs Handle Earnings Data
Institutional platforms and APIs solve different layers of the earnings data stack. The distinction is not that one is better. It is that they are optimized for different operating models.
Institutional platforms such as Bloomberg, FactSet, Refinitiv, and AlphaSense are designed to unify research workflows. They typically combine transcripts, filings, estimates, company financials, news, and research content in one environment.
That integration reduces the burden on the analyst. The platform handles much of the standardization, search, entity mapping, and cross-document navigation before the user begins analysis.
Key Differences Between Platforms and APIs
APIs are different. They provide flexible, developer-first access to data components that can be assembled into internal systems.
That flexibility is valuable for teams building proprietary models, research pipelines, dashboards, backtests, or internal earnings intelligence tools. It also means the team owns the normalization logic.
An API-based workflow has to define how guidance is extracted, how ranges are stored, how fiscal periods are mapped, how revised guidance is versioned, and how actual results are selected.
Financial Modeling Prep belongs in this API layer. It provides programmatic access to components such as earnings calendars, transcripts, press releases, income statements, and as-reported financials, which can be combined into custom earnings workflows.
|
APIs do not replace terminals. They enable scalable, programmable versions of earnings workflows that would otherwise remain manual, platform-bound, or difficult to customize. |
How to Build an Earnings Analysis Workflow Using APIs
Step 1: Retrieve Transcripts
A durable earnings workflow starts with transcripts. The system retrieves the earnings call transcript, separates prepared remarks from Q&A, and tags speakers such as the CEO, CFO, and covering analysts.
The transcript layer captures the narrative record. It is where management explains performance, frames expectations, and provides forward-looking commentary that may not appear cleanly in the financial statements.
Step 2: Extract Guidance
The next layer is guidance extraction. The system pulls guidance language from press releases, investor disclosures, 8-K exhibits, and transcript segments.
Each guidance item should retain its raw source text. Normalized fields can then be created for metric name, period covered, low value, high value, midpoint, unit, source type, and disclosure timestamp.
Step 3: Retrieve Actual Results
The third layer is actual results. Financial statement APIs provide reported revenue, EPS-related fields, margins, and other performance metrics that can be aligned to the same fiscal period.
FMP's Earnings Calendar API can support event-level timing with announcement dates, estimated EPS, and actual EPS where available. Its financial statement endpoints provide the structured results layer needed for period-level analysis.
Step 4: Normalize and Align Data
The fourth step is normalization and alignment. Guidance ranges are converted into comparable values, metric definitions are standardized, and each item is mapped to the correct reporting period.
This is where most workflow quality is determined. A full-year revenue guide should not be compared against a quarterly revenue result, and adjusted EPS guidance should not be compared against an unmatched GAAP EPS field.
Step 5: Analyze Outcomes
The final layer is analysis. Once transcripts, guidance, and actuals are aligned, the system can measure guidance accuracy, earnings surprises, revision patterns, and narrative-versus-performance divergence.
For example, a system can flag companies that repeatedly guide conservatively, companies whose tone weakens before results do, or companies whose segment commentary diverges from consolidated financial performance.
The output is not just a dashboard. It is a unified earnings event record that can support research, screening, backtesting, alerts, and internal models.
Turning Earnings Data Into a Unified Analytical System
Earnings data becomes more valuable when transcripts, guidance, and actual results are treated as one analytical system. The transcript explains the narrative, guidance defines the expectation, and actual results measure delivery.
Institutional platforms have historically dominated this workflow because they solve much of the alignment and standardization problem. They reduce manual work by connecting documents, estimates, transcripts, and reported financials inside one environment.
APIs make it possible to build programmable versions of those workflows. They give teams control over extraction logic, metric definitions, scoring models, and internal data architecture.
The advantage is customization. A team can decide how to normalize ranges, how to preserve source text, how to handle revised guidance, and how to compare management commentary against reported performance.
The constraint is responsibility. APIs provide the source layers, but the system still has to solve entity matching, event timing, period alignment, metric normalization, and auditability.
That is the real shift in earnings data infrastructure. The most scalable workflows do not treat transcripts, guidance, and results as separate pulls. They treat them as connected evidence inside a single earnings intelligence system.
FAQ
What is the minimum dataset needed for reliable earnings alignment?
At minimum: a company identity layer, an event date layer, a fiscal period layer, transcript access, and a structured results layer. In FMP terms, that usually means combining Company Profile Data, Earnings Transcript, Earnings Calendar, and financial statement endpoints.
Should actual results come from the earnings calendar or the financial statements?
Both serve different roles. The Earnings Calendar is useful as the event-level record for announcement timing and actual EPS when available. Financial statements are the structured period-level record for the company's reported operating results. They should be linked, not substituted for one another.
Why use both standardized and as-reported statements?
Because they answer different operational needs. Standardized statements are efficient for broad comparison and consistent modeling. As-reported statements preserve the original company-reported values for validation, auditability, and filing-level alignment.
How should transcript dates and reporting periods be stored in the same earnings record?
They should be stored as separate fields, not collapsed into one date. In FMP, transcript retrieval is tied to symbol, year, and quarter, while the Earnings Calendar is organized around the announcement event and the statement endpoints are organized around reported financial periods. Keeping those fields distinct makes it easier to align transcript text, disclosure timing, and reported results without creating ambiguous joins.
Can press releases replace transcript data in an earnings workflow?
No. They complement transcript data, but they do not replace it. Press Releases provide the official company-issued disclosure layer, while transcripts capture the full spoken management narrative from the call. For a unified earnings dataset, both are useful because they represent different parts of the same event record and often need to be linked back to the same company and reporting period.
What fields should exist in a canonical earnings event record?
At a minimum, the record should include an entity layer, an event layer, and attached payloads for transcript text, guidance source material, and actual reported results. In practice, that means storing company identifiers from Company Profile Data, transcript period references from the transcript endpoints, announcement timing from the Earnings Calendar, and structured outputs from standardized or as-reported financial statement endpoints. That structure turns multiple API responses into one durable earnings object for downstream analysis.







