


Many financial models treat macroeconomic variables as external context rather than core mathematical inputs. Analysts often build intricate cash flow projections while leaving the underlying economic environment as a static footnote.
Interest rates and inflation directly influence equity valuation through discount rates, terminal growth assumptions, and variable capital costs. A shift in these baseline metrics alters the fundamental pricing of every asset class.
Analysts routinely utilize static assumptions, such as a fixed historical discount rate, while actual macro conditions are constantly changing. This disconnect creates a silent margin of error that compounds over multi-year forecast periods.
Modern financial models treat macroeconomic data as continuously updating inputs rather than fixed assumptions embedded at the start of a model. This article explains how to retrieve macroeconomic data via FMP APIs and how to integrate it into financial models in a meaningful way.
Where Can I Retrieve Short-term Interest Rates and Inflation Prints via API?
Short-term interest rates and inflation data can be retrieved via APIs from macroeconomic data providers that aggregate government-reported indicators such as central bank rates, CPI, and other economic releases. These APIs deliver normalized, time-series data designed for direct integration into financial models and analytics pipelines. For example, Financial Modeling Prep serves as a structured API provider that delivers these economic datasets for automated ingestion. Integrating these structural endpoints ensures internal analytics platforms always reference the current economic reality.
What Interest Rate Data Includes
Central bank policy rates dictate the foundational cost of capital across the financial system. Treasury yields represent the return on government debt across various maturities, establishing the risk-free rate used in capital asset pricing models. These rates are typically retrieved via API endpoints that provide the full yield curve as a structured time series.
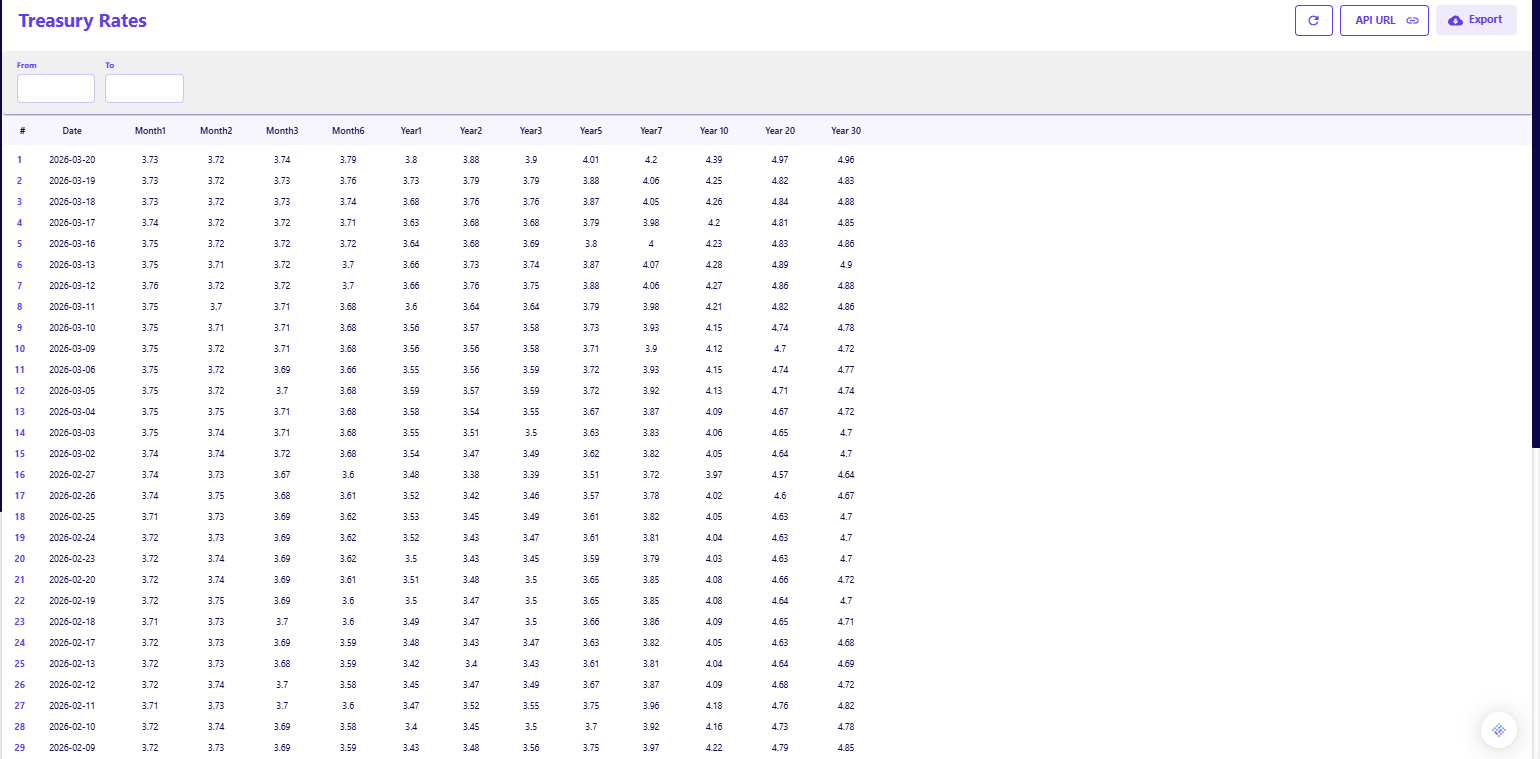
Financial pipelines capture these metrics to differentiate between short-term liquidity costs and long-term borrowing expectations. Extracting the term structure for March 20, 2026, using the Treasury Rates API shows a 1-month yield of 3.73 percent and a 10-year yield of 4.39 percent. Tracking the spread between these specific maturity dates provides an immediate read on institutional growth expectations.
Engineers must clarify the difference between nominal rates and real rates within their databases. Real rates adjust the nominal yield for inflation, providing the actual purchasing power return that drives institutional capital flows. Engineers implement this in their internal pipelines by programmatically linking structured inflation series directly to nominal yield data.
What Inflation Data Represents
Inflation metrics quantify the rate at which the general level of prices for goods and services is rising. The Consumer Price Index measures price changes from the perspective of the purchaser, while the Producer Price Index tracks changes from the perspective of the seller.
Retrieving this data systematically requires distinguishing between headline and core inflation figures. Core inflation strips out volatile food and energy components to reveal the underlying pricing trend embedded in the broader economy.
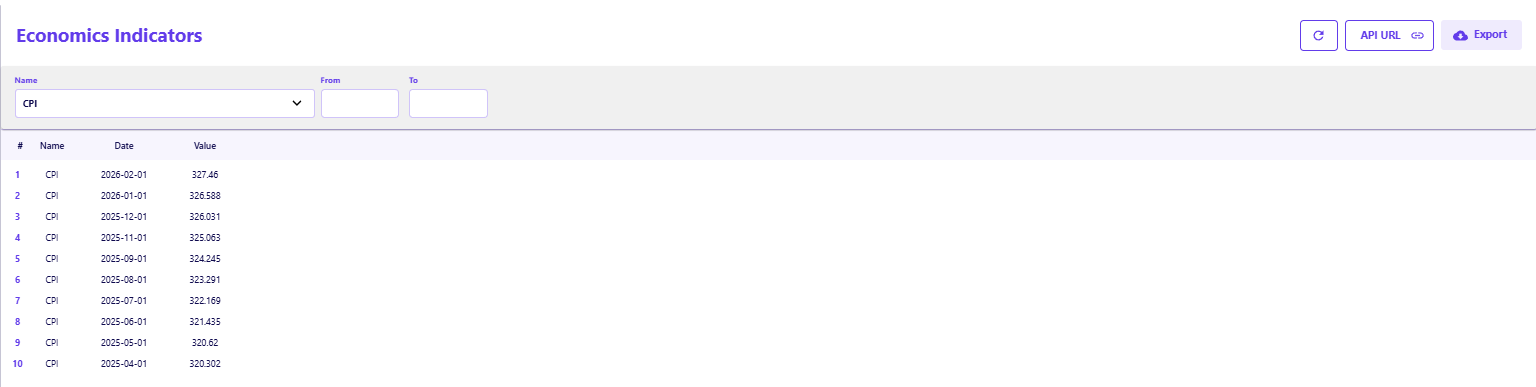
Tracking these metrics clarifies exactly how inflation reflects changes in purchasing power over time. Feeding this specific inflation curve into automated pipelines directly dictates model assumptions regarding future revenue growth and sustained margin pressure. Querying the Economics Indicators API reveals a CPI print of 327.46 for February 2026 and a corresponding inflation rate of 2.38 percent by late March. As this inflation compounds, the real value of future corporate cash flows deteriorates, requiring immediate adjustments to long-term valuation models.
As this inflation compounds, the real value of future corporate cash flows deteriorates, requiring immediate adjustments to long-term valuation models.
How Macro Data Is Structured in APIs
Macroeconomic data is delivered in a strict time series format mapping specific indicator values to historical calendar dates. Because government agencies release this data on varying schedules, release frequency ranges from weekly unemployment claims to monthly inflation prints.
Maintaining consistent time intervals is essential when joining these macro indicators with quarterly corporate earnings data. Misaligned timestamps will introduce look-ahead bias or lag into a backtested trading strategy.
A standard programmatic response organizes this data systematically using specific parameters:
- Specific indicator name or classification code
- Precise timestamp of the economic release
- The reported numerical value or percentage change
Why Interest Rates Are the Foundation of Valuation Models
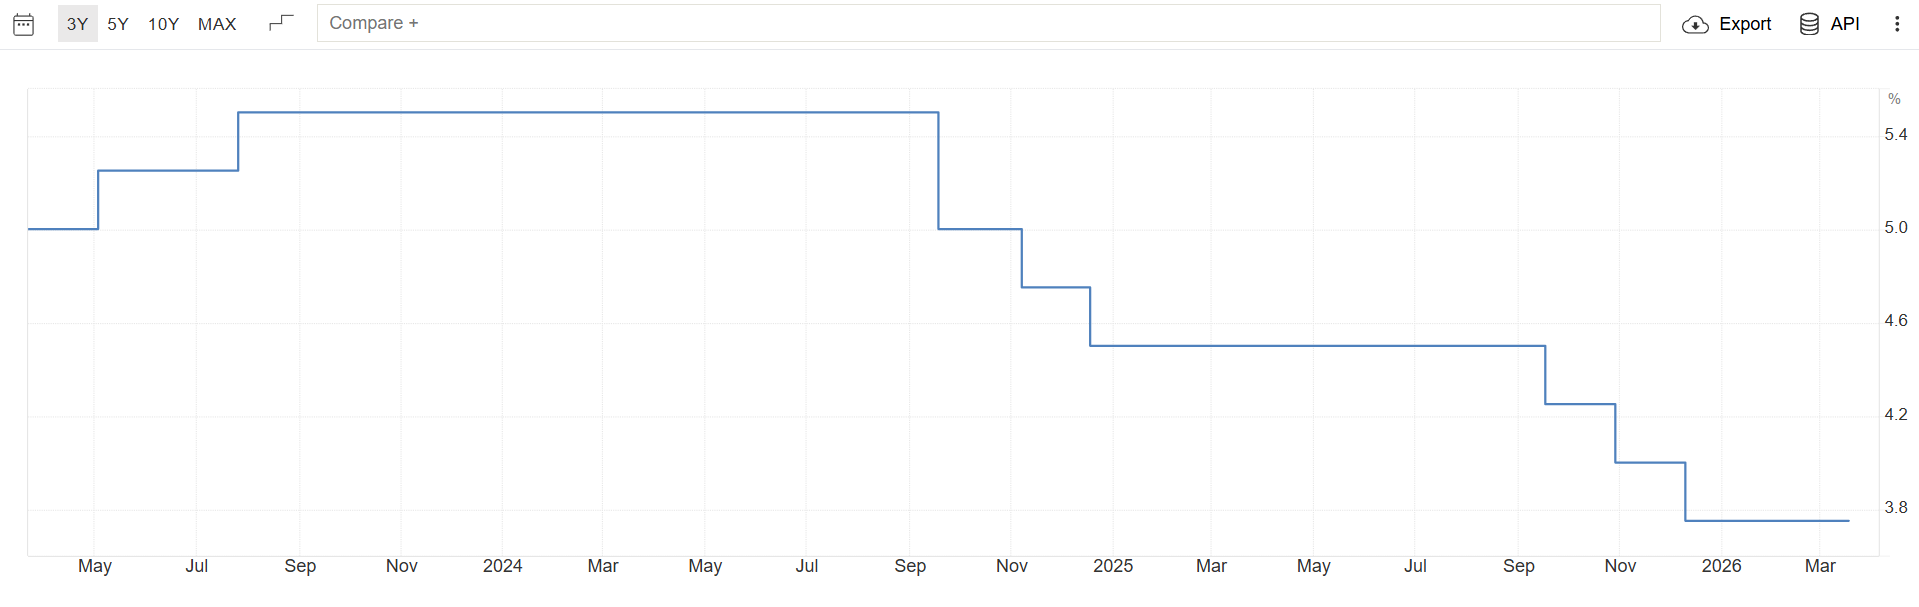
The mathematical discount rate depends heavily on prevailing interest rates. The risk-free rate serves as the anchor for the cost of capital, dictating the minimum return an investor requires before assuming equity risk.
When central banks adjust policy, the risk-free rate moves, immediately altering the weighted average cost of capital for every publicly traded company. Valuation is highly sensitive to these rate changes because they fundamentally alter the present value of future cash flows.
Consider a scenario where the risk-free rate pushes the total discount rate from eight percent to ten percent. If a company projects one hundred million in cash flow ten years out, that future value drops from forty-six million to thirty-eight million in present-day terms based entirely on the rate adjustment.
Understanding this mathematical relationship is critical for quantifying equity sensitivity during aggressive monetary tightening or easing cycles.
How Inflation Impacts Growth, Margins, and Forecast Assumptions
Inflation directly affects top-line revenue growth by forcing companies to push price increases through their customer base. A model projecting five percent revenue expansion is actually forecasting zero real growth if the underlying inflation rate also sits at five percent.
Rising prices simultaneously affect the corporate cost structure through higher raw material expenses and sustained wage pressure. Analysts must model how long a company can delay passing these costs onto consumers before gross margins begin to contract.
Not all companies react to inflation the same way within a financial model.
- Asset-heavy industrials often face immediate margin compression due to rising input costs.
- Software companies with high gross margins and subscription pricing generally exhibit far greater resilience.
Evaluating consumer sentiment endpoints, such as the tracked decline from 61.7 in July 2025 to 56.4 by January 2026, provides an early indicator of whether a specific customer base will tolerate continued price hikes.
Why Static Assumptions Break in Changing Macro Environments
Financial models often assume stable conditions, rolling a constant cost of capital forward across a five-year projection. This approach functions adequately during periods of macroeconomic calm but fails catastrophically during regime shifts. Models connected to live macroeconomic data automatically adjust these assumptions as new data is released.
Sudden rate shocks or rapid changes in inflation break those assumptions by altering the fundamental cost of doing business. A model projecting flat interest expense will severely overestimate net income if the company holds floating-rate debt during a tightening cycle.
Tracking these shifts across different regions is essential for spotting global opportunities when central bank policies diverge. A model built on static assumptions in a dynamic macro environment will produce misleading results.
How to Integrate Macro Data into a Financial Model
Integrating macro data requires building dynamic links between economic API endpoints and the core drivers of a spreadsheet or programmatic model. APIs act as the ingestion layer, continuously feeding updated macro inputs into the model. Analysts accomplish this by directly linking treasury yields to the discount rate calculation within their capital asset pricing framework.
Similarly, linking current inflation data to terminal growth assumptions ensures the model does not project perpetual growth rates that fall below the rate of currency debasement.
This architecture demands dynamic updating across all core components:
- Pull current 10-year treasury yields to calculate a real-time risk-free rate.
- Adjust revenue growth projections based on trailing inflation metrics.
- Recalculate interest expense based on the current term structure.
How to Align Macro Data with Company-Level Financial Data
Fusing macroeconomic indicators with corporate fundamentals requires matching time periods with extreme precision. Analysts must map a monthly CPI print to the specific fiscal quarter in which a company generated its revenue.
Aligning the frequency of these datasets is challenging because economic data often releases monthly, while corporate financials report quarterly. Engineers must also account for lag effects and revision timing, as initial economic prints are frequently adjusted in subsequent months. Data pipelines must use aggregation logic to average or snapshot the macro indicators to match the corporate reporting schedule.
Clarifying macro versus company reporting differences is crucial for accurate historical analysis.
- Macro data reflects calendar months regardless of corporate fiscal calendars.
- Many retailers operate on a fiscal year ending in January, requiring offset mapping to align with December inflation data.
How to Use Macro Data Without Overfitting Your Model
Integrating economic indicators should enhance a model without adding unnecessary statistical noise. Analysts must avoid overcomplicating their spreadsheets with dozens of minor economic variables that exhibit high collinearity.
Focus exclusively on the key drivers that tangibly impact the specific business model being evaluated. A consumer discretionary model needs inflation and sentiment data, while a regional bank model requires granular yield curve inputs.
Macroeconomic data is directional, not exact.
- Use it to stress test baseline assumptions.
- Establish wide guardrails for worst-case scenario modeling.
- Avoid trying to predict exact quarterly EPS based solely on a slight change in CPI.
- Overfitting macro inputs often creates the illusion of precision without improving predictive accuracy.
Structuring these inputs properly is the first step in integrating macro indicators into institutional research workflows.
Why Macro Awareness Improves Every Valuation Model
Incorporating structured economic data transforms a rigid valuation model into a dynamic pricing tool. Macro inputs shape valuation outcomes by defining the boundaries of capital costs and consumer purchasing power.
Better assumptions directly translate to better models and more resilient capital allocation decisions. Ignoring the economic environment does not remove macro risk from a portfolio; it simply leaves the portfolio manager blind to its effects.
Every valuation model already contains macro assumptions. The difference is whether they are explicit or hidden. The most effective models make those assumptions dynamic, transparent, and continuously updated through structured data pipelines.
Frequently Asked Questions
How do you calculate the real risk-free rate?
The real risk-free rate is calculated by subtracting the expected inflation rate from the nominal yield of a government treasury bond. This adjustment provides the actual purchasing power return an investor will receive over the life of the bond.
Why does inflation increase the discount rate?
Inflation erodes the future purchasing power of cash flows, prompting central banks to raise policy rates to cool the economy. As these baseline interest rates rise, investors demand a higher nominal return on equity investments, which mathematically pushes the discount rate higher.
Can I use the 10-year treasury yield for a 5-year DCF?
Using a 10-year treasury yield for a 5-year discounted cash flow model introduces a duration mismatch. It is standard practice to match the maturity of the risk-free rate proxy to the exact time horizon of the specific cash flows being evaluated.
How often should I update macroeconomic inputs in my model?
Macroeconomic inputs should be updated programmatically whenever new structural data is released, such as following a central bank rate decision or a monthly CPI print. Hardcoding these values requires manual intervention and guarantees the model will eventually drift from economic reality.
What is the difference between headline CPI and core CPI in modeling?
Headline CPI includes all items in the inflation basket, while core CPI excludes volatile food and energy prices. Analysts often utilize core CPI for long-term growth and expense modeling because it provides a more stable representation of underlying inflation trends.







