


Financial models need more than historical prices. To build a workflow that can support valuation, screening, research dashboards, or internal analytics, teams need market data, financial statements, ratios, estimates, events, and refresh-ready endpoints working together. This guide compares financial data APIs through that workflow lens, with a practical example of how raw API data becomes a model-ready dataset.
Key Takeaways
- End-to-end financial modeling workflows require more than market data. Prices provide market context, but models also need financial statements, ratios, estimates, events, and refresh-ready endpoints.
- The best financial data API depends on the workflow being built. Price-driven models, lightweight prototypes, broad financial apps, and full modeling systems each require different levels of data coverage and integration.
- A model-ready dataset combines multiple layers of financial data into one usable table. Market context, fundamentals, derived metrics, and event context become more useful when they can be pulled, merged, and refreshed consistently.
- API consistency matters as much as endpoint coverage. Stable schemas, repeatable data access, and fewer reconciliation steps help teams maintain models, dashboards, screeners, and internal analytics over time.
- FMP is strongest for teams building full modeling workflows that need prices, fundamentals, ratios, TTM metrics, estimates, calendars, and refreshable data in one API stack.
Why Financial Modeling Workflows Need More Than Market Data
Most financial data API comparisons start with market data, and for simple use cases, that is fine. If you are building a charting tool, a momentum model, or a volatility dashboard, historical prices and live quotes may be enough to get started.
But full financial modeling needs more than prices. A valuation model needs revenue, margins, cash flow, debt, share count, and valuation multiples. A fundamental screener needs statements, ratios, growth metrics, and sector context. A research dashboard needs all of that, plus earnings dates, estimates, and a way to refresh the data without breaking the pipeline.
That is where the API choice becomes more important. You are not just picking a source for prices. You are choosing the data layer under the full modeling process. If one provider only solves part of that workflow, the rest has to be stitched together from other APIs, spreadsheets, or manual cleanup.
So the better question is not which API has the most endpoints. It is: Which API can support the full path from raw data to model-ready output?
What An End-To-End Modeling Workflow Actually Requires
A useful modeling workflow usually starts with prices, but it cannot stay there for long. Prices tell you how the market has treated an asset. They do not tell you why the business looks stronger, weaker, cheaper, more expensive, or more risky than before.
That is why an end-to-end workflow needs several layers working together. A simple version looks like this:
Prices -> Statements -> Derived Metrics -> Forward Context -> Model-Ready Table -> Refresh Loop
Each layer adds something the previous one cannot provide. Prices give market context. Statements explain the business. Ratios and TTM metrics make the data easier to compare. Estimates and events help connect the model to what comes next. The final step is making sure the workflow can refresh without breaking every time new data comes in.
Different APIs may handle individual layers well, but the operational challenge is keeping those layers connected, consistent, and refreshable over time.
|
Workflow Stage |
Dataset Needed |
Why It Matters |
What Breaks If Missing |
|
Price Context |
Historical prices, quotes |
Returns, momentum, volatility, valuation context |
Models lose market context |
|
Fundamentals |
Income statement, balance sheet, cash flow |
Revenue, margins, debt, cash generation |
Valuation and screening become shallow |
|
Derived Metrics |
Ratios, TTM metrics, key metrics |
Faster feature creation and comparability |
Teams rebuild basic metrics manually |
|
Event Context |
Earnings calendar, dividends, splits |
Helps time updates and interpret model changes |
Refresh cycles drift from real events |
|
Forward Context |
Analyst estimates, guidance proxies |
Useful for forecast assumptions |
Models stay backward-looking |
|
Refresh Loop |
Stable endpoints and repeatable schemas |
Keeps models current |
Manual cleanup becomes part of the workflow |
This is the standard the rest of the article uses. A provider can be excellent for one layer and still be a weak fit for the full workflow. That is the real difference between a market data API and a financial data API that can support modeling end-to-end.
Building A Model-Ready Dataset With Financial APIs
To make the comparison useful, it helps to build the workflow once instead of only describing it. I'll use FMP as the implementation example here because the goal is to create a full modeling dataset, not just pull prices.
The workflow is simple:
Define a universe -> Pull prices -> Pull statements -> Pull ratios and TTM metrics -> Add event context -> Merge everything into one table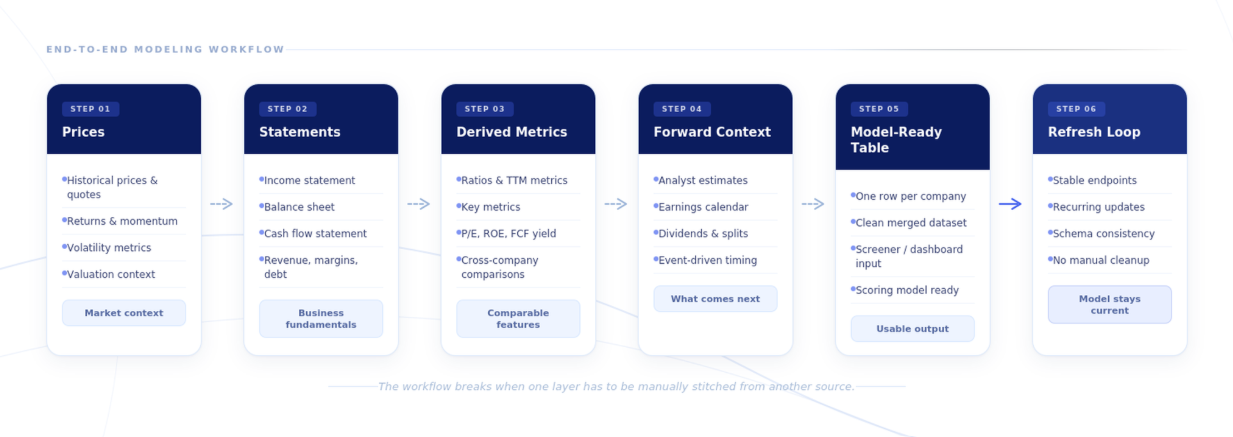
For this example, I'll use a small large-cap universe.
|
import requests import pandas as pd from datetime import date, timedelta api_key = "YOUR FMP API KEY" base_url = "https://financialmodelingprep.com/stable" tickers = ["AAPL", "MSFT", "NVDA", "AMZN", "META"] |
Define A Small Helper Function
The same pattern repeats across the workflow: call an endpoint, pass the symbol, and turn the JSON response into features.
|
def get_fmp_data(endpoint, params=None): params = params or {} params["apikey"] = api_key url = f"{base_url}/{endpoint}" response = requests.get(url, params=params, timeout=30) response.raise_for_status() data = response.json() return data def first_row(data): if isinstance(data, list) and len(data) > 0: return data[0] return {} def safe_value(row, keys): for key in keys: value = row.get(key) if value not in [None, ""]: return value return None |
This keeps the code readable because the rest of the workflow can focus on the data itself.
Pull Historical Prices
Prices are the market context layer. They help calculate returns, momentum, volatility, and current market behavior. But in a modeling workflow, this is only the first layer, not the complete data foundation.
FMP's historical price endpoint provides end-of-day stock price and volume data, including open, high, low, close, volume, price change, percentage change, and VWAP.
|
def get_price_features(symbol): end_date = date.today() start_date = end_date - timedelta(days=120) data = get_fmp_data( "historical-price-eod/full", { "symbol": symbol, "from": start_date.isoformat(), "to": end_date.isoformat() } ) prices = pd.DataFrame(data) if prices.empty: return { "symbol": symbol, "latest_close": None, "return_3m": None, "volatility_3m": None } prices["date"] = pd.to_datetime(prices["date"]) prices = prices.sort_values("date") latest_close = prices["close"].iloc[-1] first_close = prices["close"].iloc[0] prices["daily_return"] = prices["close"].pct_change() return { "symbol": symbol, "latest_close": latest_close, "return_3m": latest_close / first_close - 1, "volatility_3m": prices["daily_return"].std() * (252 ** 0.5) } |
This gives the model a basic market layer. A valuation model may not be driven by momentum, but it still needs current price, recent return, and volatility context.
Pull Financial Statements
The next layer is fundamentals. For a modeling workflow, the three core statements matter because they explain the business behind the price. FMP documents separate endpoints for the income statement, balance sheet, and cash flow statement, including the cash flow endpoint for operating cash flow and free cash flow analysis.
|
def get_statement_features(symbol): income = get_fmp_data( "income-statement", {"symbol": symbol, "period": "annual", "limit": 2} ) balance = get_fmp_data( "balance-sheet-statement", {"symbol": symbol, "period": "annual", "limit": 1} ) cash_flow = get_fmp_data( "cash-flow-statement", {"symbol": symbol, "period": "annual", "limit": 1} ) latest_income = first_row(income) previous_income = income[1] if isinstance(income, list) and len(income) > 1 else {} latest_balance = first_row(balance) latest_cash_flow = first_row(cash_flow) revenue = latest_income.get("revenue") previous_revenue = previous_income.get("revenue") operating_income = latest_income.get("operatingIncome") net_income = latest_income.get("netIncome") total_debt = latest_balance.get("totalDebt") equity = latest_balance.get("totalStockholdersEquity") free_cash_flow = latest_cash_flow.get("freeCashFlow") operating_cash_flow = latest_cash_flow.get("operatingCashFlow") revenue_growth = None if revenue and previous_revenue: revenue_growth = revenue / previous_revenue - 1 operating_margin = None if revenue and operating_income: operating_margin = operating_income / revenue fcf_margin = None if revenue and free_cash_flow: fcf_margin = free_cash_flow / revenue debt_to_equity = None if equity and total_debt: debt_to_equity = total_debt / equity cash_conversion = None if net_income and operating_cash_flow: cash_conversion = operating_cash_flow / net_income return { "symbol": symbol, "revenue_growth": revenue_growth, "operating_margin": operating_margin, "fcf_margin": fcf_margin, "debt_to_equity": debt_to_equity, "cash_conversion": cash_conversion } |
This is where the workflow starts moving beyond market data. The model now has revenue growth, margins, debt, free cash flow, and cash conversion in the same table as price behavior.
Pull Ratios And TTM Metrics
A lot of teams rebuild ratios manually from statements. That works, but it adds more transformation logic and more room for inconsistencies. For modeling workflows, TTM ratios and key metrics are useful because they make features easier to compare across companies.
|
def get_metric_features(symbol): ratios = first_row( get_fmp_data("ratios-ttm", {"symbol": symbol}) ) metrics = first_row( get_fmp_data("key-metrics-ttm", {"symbol": symbol}) ) pe_ratio = safe_value( ratios | metrics, ["priceEarningsRatioTTM", "peRatioTTM", "priceToEarningsRatioTTM"] ) roe = safe_value( ratios | metrics, ["returnOnEquityTTM", "roeTTM"] ) current_ratio = safe_value( ratios | metrics, ["currentRatioTTM"] ) fcf_yield = safe_value( ratios | metrics, ["freeCashFlowYieldTTM", "freeCashFlowYield"] ) return { "symbol": symbol, "pe_ratio_ttm": pe_ratio, "roe_ttm": roe, "current_ratio_ttm": current_ratio, "fcf_yield_ttm": fcf_yield } |
Add Event And Forward Context
A model also needs to know when the numbers may change. Earnings dates are useful because they tell the workflow when a company is about to report or has recently reported. FMP's Earnings Calendar API provides upcoming and past earnings announcements, including estimated and actual EPS where available. For forward-looking assumptions, analyst estimates can also be useful. FMP's analyst estimates dataset includes projected figures like revenue and EPS estimates.
|
def get_event_features(symbol): today = date.today() future = today + timedelta(days=90) calendar = get_fmp_data( "earnings-calendar", { "from": today.isoformat(), "to": future.isoformat() } ) earnings_rows = [ row for row in calendar if row.get("symbol") == symbol ] next_earnings = earnings_rows[0] if earnings_rows else {} estimates = first_row( get_fmp_data( "analyst-estimates", {"symbol": symbol, "period": "annual", "limit": 1} ) ) estimated_revenue = safe_value( estimates, ["estimatedRevenueAvg", "revenueAvg", "estimatedRevenue"] ) estimated_eps = safe_value( estimates, ["estimatedEpsAvg", "epsAvg", "estimatedEps"] ) return { "symbol": symbol, "next_earnings_date": next_earnings.get("date"), "estimated_revenue": estimated_revenue, "estimated_eps": estimated_eps } |
This step is easy to skip, but it matters in real workflows. Without event context, a model may refresh on a fixed schedule while missing the dates that actually change the assumptions.
Merge Everything Into One Model-Ready Table
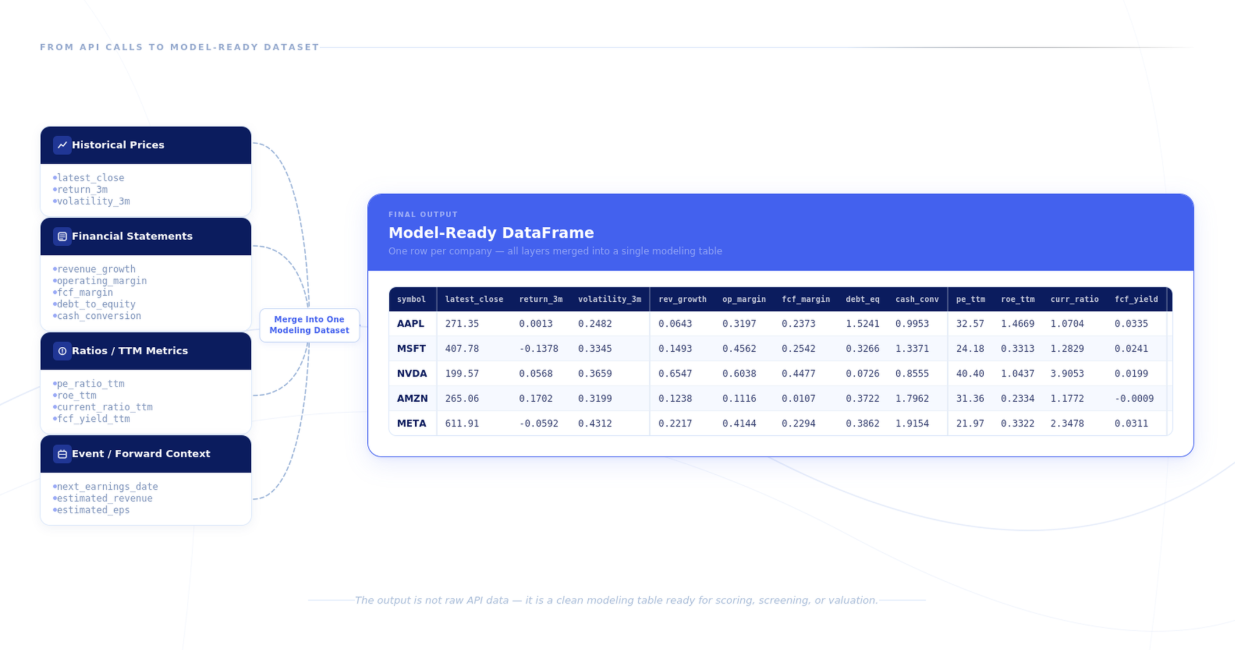
Now the separate layers can be merged into one table. This is the actual output a modeling workflow needs.
|
rows = [] for symbol in tickers: price_features = get_price_features(symbol) statement_features = get_statement_features(symbol) metric_features = get_metric_features(symbol) event_features = get_event_features(symbol) row = { **price_features, **statement_features, **metric_features, **event_features } rows.append(row) model_df = pd.DataFrame(rows) model_df |
At this point, the dataframe is no longer just a price table. It has market context, fundamentals, derived metrics, and event context in one place.
A final table might look like this:
|
symbol latest_close return_3m volatility_3m revenue_growth \ 0 AAPL 271.35 0.001255 0.248167 0.064255 1 MSFT 407.78 -0.137776 0.334539 0.149322 2 NVDA 199.57 0.056765 0.365885 0.654735 3 AMZN 265.06 0.170243 0.319873 0.123778 4 META 611.91 -0.059193 0.431246 0.221670 operating_margin fcf_margin debt_to_equity cash_conversion \ 0 0.319708 0.237329 1.524107 0.995286 1 0.456220 0.254188 0.326611 1.337124 2 0.603817 0.447703 0.072552 0.855506 3 0.111553 0.010733 0.372172 1.796241 4 0.414379 0.229437 0.386190 1.915379 pe_ratio_ttm roe_ttm current_ratio_ttm fcf_yield_ttm \ 0 32.565803 1.466892 1.070357 0.033516 1 24.183605 0.331304 1.282948 0.024080 2 40.397022 1.043689 3.905264 0.019931 3 31.361259 0.233356 1.177153 -0.000867 4 21.966934 0.332151 2.347764 0.031119 next_earnings_date estimated_revenue estimated_eps 0 2026-07-30 627849333333 13.07333 1 2026-07-29 646172500000 33.57000 2 None 584899000000 13.56000 3 2026-07-30 1252335075000 17.05857 4 2026-07-29 464064728571 57.88286 |
This is the point where the data becomes useful for actual modeling. You can feed this table into a scoring model, a valuation dashboard, a screener, or a research workflow. The important part is not the exact formula used after this. It is that the API layer has already done enough work to produce a clean, repeatable modeling dataset.
That is also why the provider choice matters. If prices, statements, ratios, estimates, and events all come from separate places, the hardest part of the workflow becomes reconciliation. If they can be pulled from one consistent API stack, the model is much easier to refresh and maintain.
Where Each Provider Fits In The Modeling Stack
Once the workflow is clear, the provider comparison becomes more useful. The question is not just who has market data. It is which provider can support the layers that sit around it: statements, ratios, estimates, calendars, and repeatable updates.
|
Provider |
Market Data |
Statements |
Ratios / TTM |
Estimates / Calendar |
Workflow Completeness |
Best Fit |
|
FMP |
Strong |
Strong |
Strong |
Strong |
High |
End-to-end modeling workflows that need prices, fundamentals, derived metrics, and event context in one stack |
|
Massive (formerly Polygon) |
Very strong |
Moderate |
Moderate |
Limited / Moderate |
Medium |
Market-data-heavy models built around prices, trades, quotes, and real-time feeds |
|
Alpha Vantage |
Good |
Good |
Limited / Moderate |
Limited |
Medium |
Lightweight research workflows, prototypes, and simpler models |
|
Finnhub |
Strong |
Good |
Good |
Strong |
High |
Broad financial apps that need market data, fundamentals, estimates, news, and company data |
The table shows why FMP fits the full modeling workflow first. It covers the main layers a model usually needs: market data, financial statements, ratios, TTM metrics, estimates, calendars, and repeatable API access. That makes it a strong fit when the goal is to build one model-ready dataset instead of stitching together separate sources for each layer.
Finnhub also has broad coverage and can support financial applications that need market data, fundamentals, estimates, news, and company data. The difference is positioning. FMP is stronger when the workflow is centered on financial modeling and model-ready datasets, while Finnhub fits well when the product needs broader financial app coverage around multiple data types.
Market-data-first providers sit in a different lane. Massive fits well when the model is mostly built around prices, returns, volatility, trades, quotes, or intraday movement. Alpha Vantage can work when the workflow is lighter and the goal is to test an idea quickly without building a large data pipeline.
Provider Breakdown Through A Workflow Lens
When The Model Needs The Full Stack: FMP
FMP is the strongest fit when the workflow needs to move from prices into fundamentals, ratios, estimates, and events without changing providers. That matters most for models that need to refresh regularly. Once a workflow depends on multiple data layers, the problem is not just access. It is keeping schemas consistent, reducing reconciliation work, and making sure the model can update without manual cleanup.
When The Model Is Mostly Price-Driven: Massive
Massive, makes more sense when the model is built around market data. If the workflow depends on historical prices, trades, quotes, aggregates, or real-time feeds, it can be a strong option. The tradeoff appears when the model needs a deeper fundamental layer. At that point, teams may need another provider for statements, ratios, or forward-looking context.
When The Goal Is A Lightweight Research Workflow: Alpha Vantage
Alpha Vantage works well when the project is smaller or earlier-stage. It is accessible, easy to start with, and useful for basic research or prototype models. That can be enough for testing an idea. But as the workflow becomes more complete, especially if it needs derived metrics, estimates, or repeatable refresh logic, more preprocessing is usually needed.
When The Product Needs Broad Financial Coverage: Finnhub
Finnhub fits well for broader financial applications that need more than prices but are not necessarily built around a full modeling stack. Its coverage across market data, fundamentals, estimates, news, and company data makes it useful for developer-facing products and research workflows. The main question is how much of the modeling layer the team wants already structured versus how much they are willing to assemble internally.
The practical takeaway is that the provider choice should follow the model. Price-driven models can prioritize market data depth. Research prototypes can optimize for accessibility. Full modeling workflows need a broader stack, and that is where FMP's advantage is clearest.
What To Check Before Choosing A Financial Data API For Modeling
Before choosing a provider, start with the model you are actually building. A simple price model does not need the same data stack as a valuation engine or an internal research dashboard.
Here are the checks that matter most:
- Does the API cover every dataset your model needs, or only the price layer?
- Can you get statements, ratios, TTM metrics, and market data from the same source?
- Are the endpoints stable enough for a recurring refresh job?
- Will you need estimates, calendars, or event data later?
- How much transformation logic will your team need to maintain?
- Can the same API support the final product, whether that is a screener, dashboard, model, or internal app?
The last question is usually the most important. A provider can work well for a prototype but become limiting once the workflow needs to refresh every week, serve multiple users, or support more datasets. The best API is not always the one with the most endpoints. It is the one that fits the model's full lifecycle with the least unnecessary maintenance.
Final Recommendation
There is no universal best financial data API for every modeling workflow. If the model is mostly price-driven, a market-data-first provider like Massive can make sense. If the goal is a simple research prototype, Alpha Vantage may be enough. If the product needs broad financial coverage across prices, fundamentals, estimates, news, and company data, Finnhub is also a strong option.
The decision changes when the workflow needs to move from raw inputs into a model-ready table that can refresh repeatedly. At that point, coverage alone is not enough. The API has to support the layers around the model: prices, statements, ratios, TTM metrics, event context, and stable endpoints.
That is where FMP fits best. It is strongest for teams that want to build an end-to-end modeling workflow without stitching together too many separate data sources. For valuation models, screeners, research dashboards, and internal financial tools, that full-stack setup matters more than any single endpoint.
FAQs
What Is The Best Financial Data API For Modeling Workflows?
The best financial data API depends on the model. Price-driven models can work well with market-data-first providers. Full modeling workflows need more than prices, including statements, ratios, estimates, calendars, and stable refresh logic. For that broader use case, FMP is one of the strongest options because it supports more of the modeling stack in one API.
Why Is Market Data Alone Not Enough For Financial Modeling?
Market data explains price behavior, returns, volatility, and momentum, but it does not explain the business behind the price. Most financial models also need revenue, margins, debt, free cash flow, valuation ratios, earnings dates, and forward-looking assumptions. Without those layers, the model stays shallow.
Which Financial Data API Is Best For Building A Stock Screener?
For a fundamental stock screener, look for an API that provides financial statements, ratios, TTM metrics, sector data, and historical prices. FMP and Finnhub are strong fits for broader screeners. Alpha Vantage can work for simpler versions, while Massive is better suited to screeners focused mainly on price and market data.
What Datasets Are Needed For An End-To-End Financial Modeling Workflow?
A full modeling workflow usually needs historical prices, quotes, income statements, balance sheets, cash flow statements, ratios, TTM metrics, earnings calendars, analyst estimates, and stable endpoints for refreshes. The exact mix depends on whether the model is used for valuation, screening, portfolio analysis, or internal research.
How Do You Choose Between FMP, Massive, Alpha Vantage, And Finnhub?
Choose based on the workflow. Massive fits market-data-heavy models. Alpha Vantage fits lightweight research and prototypes. Finnhub fits broader financial applications. FMP fits best when the workflow needs market data, fundamentals, ratios, TTM metrics, estimates, and event context in one stack.






