


ETF diversification can look stronger on paper than it feels in a real portfolio.
A fund may hold hundreds of securities, but a small group of companies can still drive most of its movement. Another ETF may appear balanced across names, yet lean heavily on one sector, one market-cap group, or one investment theme. This is where concentration risk becomes harder to spot. It does not always show up in the fund title or the number of holdings.
For portfolio teams, this creates a practical review problem. They need to know whether an ETF truly spreads exposure or simply packages the same dependency in a broader-looking structure. A broad-market ETF may depend heavily on mega-cap technology. A thematic ETF may spread holdings across several industries while still relying on the same demand cycle. A sector ETF may look diversified across companies but remain exposed to one earnings driver.
This type of analysis needs clean and connected data. Holdings, weights, sector allocations, market capitalization, and constituent performance need to align before Claude can interpret concentration correctly. Financial Modeling Prep provides structured ETF and market datasets that can support holdings, sector, market-cap, and constituent-level analysis from one data layer.
This article shows how to use FMP data through Claude MCP to create an ETF concentration review. The review examines top holding dependency, sector imbalance, mega-cap exposure, thematic concentration, and diversification deterioration. The goal is not to rank ETFs or recommend funds. It is to help analysts see when an ETF's visible diversification does not match its effective diversification.
Why ETF Diversification Can Be Misleading
ETF diversification often gets judged by the number of holdings. That can be a weak shortcut. A fund with 200 holdings may still move mostly because of five or ten companies. If those companies share the same sector, market-cap profile, or growth theme, the ETF can carry more concentration risk than the headline structure suggests.
Market-cap weighting can make this problem bigger over time. When a few large companies outperform the rest of the portfolio, their weights naturally increase. The ETF may still hold the same basket, but its risk profile changes. What looked like broad exposure can slowly become a bet on a smaller group of dominant names.
Sector allocation adds another layer. A fund may not have one extremely large holding, but it may lean heavily toward technology, financials, energy, or consumer discretionary. That imbalance can affect how the ETF behaves during rate changes, commodity shocks, earnings pressure, or risk-off markets.
Thematic concentration can be even harder to see. An ETF may hold companies from different sectors, but many of them may depend on the same underlying driver. For example, an AI-focused fund may include semiconductors, cloud platforms, software firms, and data center names. The sector labels may look different, but the economic exposure can still point toward one theme.
This is why concentration analysis needs more than a holdings list. Portfolio teams need to connect holding weights, sector exposure, market capitalization, constituent performance, and theme-level dependency. The same idea appears in FMP's guide to building a sector exposure analyzer for any ETF, where holdings and sector classifications are combined to reveal how portfolio weight actually spreads across sectors. When those inputs come from a consistent FMP data layer, Claude can compare them more reliably and identify whether the ETF's apparent diversification hides structural concentration.
The Data Foundation Behind ETF Concentration Analysis
ETF concentration analysis depends on more than one holdings table. The review needs to understand what the fund owns, how much weight each holding carries, which sectors dominate the portfolio, and whether the largest constituents share the same market-cap or thematic exposure. Pulling these inputs from FMP gives Claude a structured ETF data foundation where each dataset plays a specific role in the concentration read.
Fund structure sets the baseline. The ETF & Mutual Fund Information API provides the fund-level context such as ticker, name, expense ratio, and assets under management, which frames how the ETF presents itself before the holdings review begins.
Holdings and weights are the core inputs. The ETF & Fund Holdings API shows the underlying securities and holdings-level exposure, while the ETF Holder Bulk API provides composition data in bulk, including asset lists, weights, shares, and market values. These two together are what let Claude see where the fund's actual weight sits and how concentrated the top holdings are.
Allocation structure shows how the weight spreads across sectors and regions. The ETF Sector Weighting API breaks down the fund's assets by sector, which is how sector imbalance gets identified. The ETF & Fund Country Allocation API adds country-level allocation for funds where regional concentration matters. This second dataset is most useful for international or globally diversified ETFs and can be treated as optional when the fund is domestically focused.
Constituent context is what makes the holdings list interpretable. The Company Profile Data API and Company Profile Bulk API supply sector, industry, price, and market-capitalization data for the constituents, individually or in bulk, which is how Claude tests whether the largest positions cluster around mega-cap names or share the same business model.
Market behavior connects concentration to recent performance. The Stock Quote API provides current market data for the constituents, and the Stock Price and Volume Data API provides historical OHLC, volume, and percentage-change data. Together they help Claude see whether concentration is also showing up in how the underlying names have been moving.
Concentration risk is often a data-alignment problem before it becomes a portfolio interpretation problem. If holdings, weights, sectors, market caps, and prices do not line up correctly, the review may miss the real dependency. Pulling these inputs from FMP keeps them on the same fund record and the same snapshot, which is what makes the concentration read consistent across funds.
Accessing FMP Data via Claude MCP
To run this system inside Claude, we connect Financial Modeling Prep's data layer through its MCP server, which allows Claude to retrieve financial datasets directly without writing manual API requests.
You first need an active FMP API key, which can be generated from your Financial Modeling Prep dashboard. This key is used to authenticate all MCP-based data requests.
Once the API key is available, FMP can be connected in Claude using its remote MCP endpoint:
|
https://financialmodelingprep.com/mcp?apikey=YOUR_FMP_API_KEY |
In Claude, navigate to Settings → Connectors → Add custom connector, and paste this URL into the Remote MCP Server field. After saving, Claude will automatically discover the available FMP tools.
For this article, the MCP-based system focuses on ETF exposure surveillance. It does not rank ETFs or suggest which fund to buy. It reviews whether an ETF's holdings and allocation structure create hidden dependency. That distinction matters because concentration risk can sit beneath a fund that looks diversified at the surface level.
A typical analysis can start with ETF holdings to identify the largest positions. Claude can then compare those weights with sector allocation and constituent market capitalization. From there, it can check whether the ETF depends heavily on mega-cap names, one sector, or one recurring theme.
Aligned FMP datasets make this analysis more reliable. Claude can connect holdings, weights, sectors, market caps, and price behavior from the same financial data layer. That allows the system to focus on exposure interpretation instead of data cleanup.
The final output acts as a portfolio exposure monitoring layer. It highlights top holding dependency, sector imbalance, mega-cap concentration, thematic exposure, and diversification deterioration. It also assigns severity and confidence levels so portfolio teams can decide which exposure risks need closer review. This mirrors the broader idea behind automated market intelligence briefings, where structured FMP data helps teams move from raw market inputs to consistent signal classification.
ETF Concentration Risk Review Framework
ETF concentration needs a clear review structure. A fund may look diversified at the headline level, but its exposure can still cluster around a narrow group of holdings, sectors, market-cap groups, or themes. The review covers these areas separately and then connects them into one concentration view.
Top Holding Dependency
The first area checks how much fund weight sits in the largest holdings. A fund with hundreds of securities can still depend heavily on its top five or top ten names. If those holdings drive most of the return pattern, the ETF behaves less like a diversified basket and more like a focused exposure vehicle.
Top holding weight should always be interpreted against the fund's objective and weighting methodology. A market-cap-weighted broad ETF is expected to carry larger weights at the top of the holdings list. A concentrated thematic fund is designed to do the same. The question is not whether the top holdings are heavy, but whether the weight pattern matches what the fund's mandate would lead an analyst to expect.
The signal becomes stronger when the largest holdings share the same business model or earnings driver. Several top positions may belong to different industries while still depending on AI infrastructure, cloud spending, digital advertising, consumer platforms, or semiconductor demand.
Sector Imbalance
The second area reviews sector weight. Some ETFs are designed to concentrate in one sector, so a sector-heavy fund is not automatically a problem. The real question is whether the sector exposure matches the fund's stated purpose and the allocation role the investor has assigned to it.
The distinction worth tracking is between expected sector concentration and hidden sector concentration. A semiconductor ETF carrying heavy semiconductor weight is expected concentration. A broad ETF with heavy technology exposure may carry more growth and rate sensitivity than the fund label suggests, which is hidden concentration. A dividend ETF with large financial or energy exposure may behave differently during rate shocks or commodity swings than its income-focused framing implies.
Mega-Cap Exposure
The third area checks how much of the fund depends on the largest companies. Market-cap weighting can produce this naturally. When the biggest companies outperform, their weights rise and the ETF becomes more dependent on them.
Mega-cap exposure is not a flaw on its own. For a broad-market ETF, leaning on the largest companies is part of how the fund is built, and many portfolios use that exposure intentionally. The review point is to surface how much of the fund's behavior comes from a small group of mega-cap names, so portfolio teams can see whether that exposure still fits the role the ETF plays in the broader allocation.
Thematic Concentration
The fourth area looks beyond sector labels. Themes often cut across sectors, so standard classification may miss the real exposure. An AI ETF may include semiconductors, software, cloud platforms, networking companies, and data center suppliers. The holdings sit in different industries, but the performance driver can still be the same.
The same issue appears in clean energy, fintech, cybersecurity, infrastructure, and dividend-oriented ETFs. The review looks for repeated economic drivers across the holdings, not only repeated sector labels.
Issuer-level exposure belongs in this same review. Some funds hold multiple share classes of the same underlying company, which can appear as separate line items in the holdings table while pointing back to one issuer. Combining those positions during the review is what shows the true economic exposure rather than the line-item count.
Diversification Deterioration
The fifth area checks whether diversification has weakened over time. Concentration can rise without a fund manager making a major change. Strong performers can become larger weights, weaker holdings can shrink, and the fund's exposure mix can drift.
That makes concentration review a recurring task rather than a one-time check. It helps portfolio teams see whether an ETF still provides the exposure they expected or whether it has quietly become more dependent on fewer names, sectors, or themes.
Running the Claude MCP Prompt
Once the FMP MCP connector is active, Claude can retrieve the ETF data needed for a compact concentration review. The prompt needs to keep the output focused. Otherwise, Claude may produce a long ETF summary instead of a useful concentration read.
For this article, QQQ works well as the example ETF. It is familiar to most readers and works well for concentration analysis because its holdings often show clear mega-cap and technology exposure.
Use the prompt below inside Claude:
|
Use Financial Modeling Prep data through the MCP connector to create a compact ETF concentration risk analysis for QQQ. Analyze: - ETF holdings - top holding weights - sector allocation - country allocation if available - constituent market capitalization - recent constituent performance - fund information Focus only on concentration risk and hidden dependency. Do not provide ETF rankings or investment advice. Return the output in this exact structure: 1. ETF Concentration Matrix Create a compact table with these columns: - Concentration Signal - Evidence from FMP Data - Affected Exposure Area - Severity: Low / Medium / High - Confidence: Low / Medium / High - Escalation Required: Yes / No 2. Top Holding Dependency Show: - Top 5 holdings and weights - Top 10 holdings total weight - Largest single holding - Dependency interpretation in 3 bullets 3. Sector Exposure View Show: - Top sectors and weights - Sector imbalance risk - Whether the ETF is balanced or concentrated 4. Mega-Cap and Thematic Exposure Show: - Mega-cap exposure pattern - Common theme across major holdings - Hidden dependency risk 5. Final Monitoring Note Write a short 4-5 line monitoring note for a portfolio risk team. Important constraints: - Keep the output compact. - Do not write a long ETF overview. - Do not include investment advice. - Do not use promotional language. - Use only evidence found from FMP data. |
This prompt gives Claude a narrow role. It asks for holdings, sector exposure, market-cap dependency, and hidden concentration, but avoids ETF ranking or portfolio recommendation language. The output will give us the material needed to explain whether QQQ's diversification comes mainly from the number of holdings or from genuinely distributed exposure.
Interpreting the Claude Output
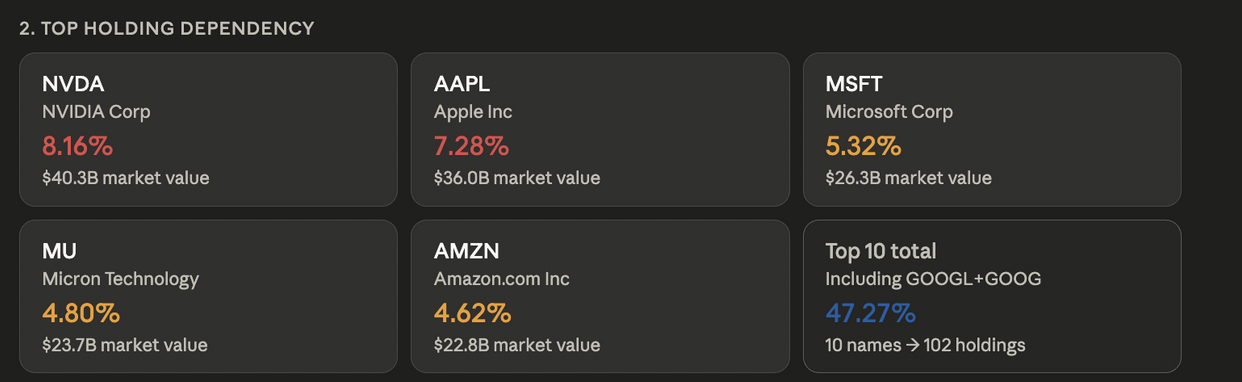
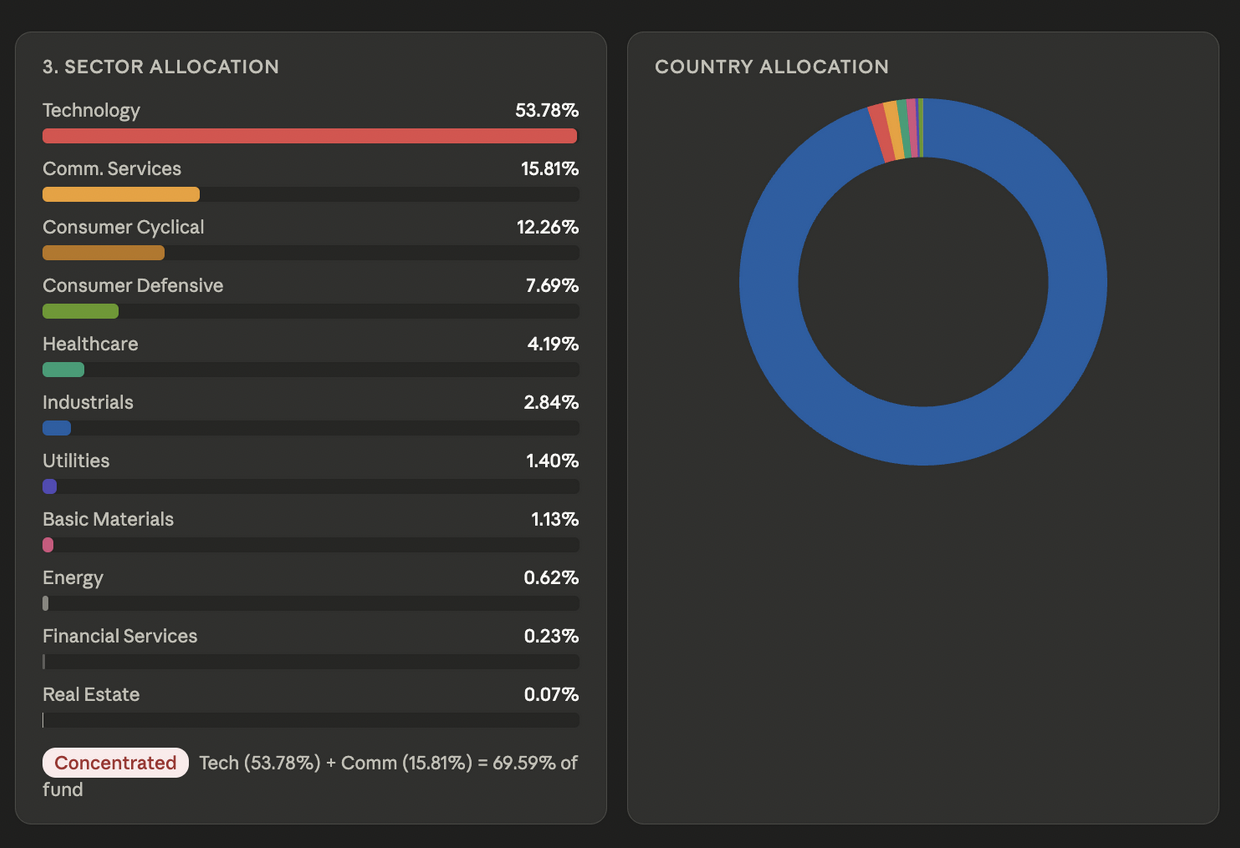
The figures in this section come from the Claude run shown in the screenshot below. They reflect QQQ's composition on the day of that run, not a current snapshot. ETF weights shift as constituents move, so a later run will produce different values.
Claude's analysis showed that QQQ does not behave like a fully balanced basket, even though it holds more than 100 securities. The concentration sits in a few related areas: technology, AI-linked semiconductors, mega-cap companies, and one duplicated issuer exposure through Alphabet's share classes.
Sector exposure was the first signal. In this run, Technology represented 53.78 percent of the fund and Communication Services another 15.81 percent. The two together made up almost 70 percent of QQQ. For a Nasdaq-100 ETF, that level of technology exposure is partly expected, but the size of the combined weight is still worth tracking against the role the fund plays in a portfolio.
The AI and semiconductor cluster was the second signal. Claude's output reported that roughly 28 percent of the fund sat in companies tied to AI compute and data-center spending, including NVIDIA, AMD, Broadcom, Micron, Intel, Lam Research, Applied Materials, KLA, ARM, and Marvell. If AI infrastructure spending slows, the pressure can move across several important holdings at the same time, not just one stock.
The Alphabet exposure added a concentration point that is easy to miss. GOOGL and GOOG appeared as separate holdings but represent the same underlying company. Together they accounted for 6.78 percent of the fund in this run. This is why holdings-level review needs issuer-level interpretation: more line items do not always mean more issuers.
The long tail mattered for a different reason. Claude's output reported that the bottom 52 holdings carried less than 10 percent of total fund weight. That explains effective diversification better than holdings count. QQQ may look diversified by the number of names, but most of the risk sits closer to the top and middle, not the long tail.
QQQ's concentration does not come from one holding. It comes from several layers reinforcing each other: high technology weight, AI-linked semiconductor exposure, duplicated Alphabet exposure, and a thin long tail. That pattern is not automatically a problem, and parts of it are expected for a Nasdaq-100 ETF. The value of the review is making the structure visible, so teams can see where the dependency sits and decide whether it still fits the allocation role they have given the fund.
Turning Holdings Data Into Exposure Review Rules
ETF concentration analysis becomes more useful when it turns holdings data into clear review rules. A high weight in one stock, sector, or theme is not automatically a problem. The question is whether that exposure is visible, intentional, and aligned with the portfolio's risk limits.
1. Top-Holding Dependency
If the largest holdings control a major share of the ETF, the fund moves into closer review. This helps analysts see whether the ETF is driven by broad participation or by a small group of dominant companies.
2. Sector Imbalance
A sector-heavy ETF may be expected to concentrate, but a broad ETF with unusually high exposure to one sector needs a different review. In the QQQ analysis, Technology and Communication Services together represented almost 70 percent of the fund. That does not make the ETF flawed, but it does make the sector exposure impossible to ignore in the context of a broad-market role.
3. Shared Thematic Exposure
Holdings may sit in different industries and still depend on the same business cycle. The AI compute cluster in QQQ is a good example. Semiconductors, hardware, cloud, and data-center-linked names appear as separate companies, but many of them respond to the same spending trend.
4. Issuer-Level Exposure
Some funds hold multiple share classes of the same company. In QQQ, GOOGL and GOOG appeared separately but pointed to Alphabet. The review combines that exposure because the economic dependency comes from one underlying business, not from two distinct issuers.
5. Long-Tail Effectiveness
A fund with many holdings can still have a weak diversification base if the bottom positions carry very little weight. Dozens of small positions add breadth to the holdings list, but they do not meaningfully change how the fund behaves.
Severity Examples
These five rules become more useful when they feed into a severity read for analyst review:
- High: the top 10 holdings dominate the fund and share the same sector or theme
- Medium: sector concentration is visible but expected given the fund's structure
- Low: exposure is broadly distributed and aligned with the fund's stated objective
Severity is a starting point, not a verdict. The rules help analysts separate visible diversification from effective diversification, but the final read still depends on the fund's mandate, the portfolio's role for that ETF, and the risk limits the team is working within.
Applying ETF Concentration Review Across a Portfolio
ETF concentration review becomes more useful when the same logic runs across the funds a portfolio team actually holds. One ETF may carry top-heavy mega-cap exposure. Another may hide sector imbalance. A third may appear diversified but depend on one theme. A repeatable approach helps teams compare these reads consistently across funds.
The portfolio-level use cases are where this matters most:
- comparing overlap across multiple ETFs in the same allocation
- identifying repeated mega-cap exposure across several funds
- reviewing whether an ETF still fits the allocation role it was originally given
- tracking concentration drift after large market moves
Standardizing ETF Exposure Reviews
Portfolio teams often compare ETFs with different objectives, structures, and weighting methods, which can make exposure review inconsistent. A consistent review lens applied to each fund (top holding dependency, sector weight, issuer concentration, market-cap exposure, thematic dependency, and long-tail effectiveness) keeps the comparison usable.
This also helps teams move past vague labels such as "diversified" or "tech-heavy." Each fund instead has a concrete read on where the exposure sits and how much of the fund depends on it.
Reducing Hidden Overlap
ETF overlap becomes a portfolio-level issue when several funds hold the same dominant names. A portfolio may appear diversified by fund count while still carrying repeated exposure underneath.
A common version of this shows up in growth-oriented portfolios. A team holding QQQ, a broad growth ETF, and a semiconductor ETF may look diversified by fund label, but the underlying weight can concentrate in the same mega-cap technology and AI infrastructure names across all three funds. The concentration is invisible at the fund level and only becomes clear when issuer-level exposure is reviewed across the holdings of every ETF in the allocation.
Supporting Allocation Oversight
Risk teams need to know whether ETF exposure still matches the intended allocation. A fund may start as part of a broad growth allocation, but concentration can rise as a few holdings outperform. Sector and theme exposure can also drift over time. The review helps teams catch that drift and see whether the ETF still fits its original role or now carries a stronger dependency than expected.
Creating a Repeatable ETF Exposure Review
Once the review logic is defined, the same approach can support regular ETF checks, portfolio overlap reviews, concentration drift tracking, and allocation oversight. FMP provides the structured ETF and constituent data, and Claude applies the concentration logic across holdings, sectors, issuers, market-cap groups, and themes.
The result is a consistent exposure view for portfolio and risk teams. It does not replace investment judgment. It gives teams a clearer read on where ETF risk is actually concentrated, so the judgment that follows can rest on the same evidence each time.
Where ETF Concentration Analysis Needs Analyst Review
ETF concentration analysis can make hidden exposure easier to see, but it still needs context. A high concentration read does not always mean the fund is poorly designed. The real question is whether the concentration is expected, measured, and acceptable for the portfolio.
Holdings Can Change
ETF holdings and weights change over time. A concentration review reflects the data available at the time of analysis. If the ETF rebalances, if prices move sharply, or if a few holdings outperform, the exposure picture can shift. This makes concentration review a recurring task rather than a one-time check.
Sector Labels Can Miss the Real Theme
Sector classification helps, but it does not always explain the actual dependency. A company may sit in technology, communication services, industrials, or consumer discretionary while still depending on the same theme, such as AI infrastructure, cloud spending, digital advertising, payments, or energy transition. The review needs issuer and theme-level interpretation alongside sector data, because hidden dependency often appears across sectors rather than within one.
Concentration Is Not Always a Problem
Some ETFs are designed to be concentrated. A semiconductor ETF, a clean energy ETF, or a sector ETF may need heavy exposure to match its objective. In those cases, concentration is not a flaw by itself. The review helps teams understand whether the concentration is intentional or hidden, which is the more useful distinction than the concentration value alone.
Market-Cap Weighting Can Drift
Market-cap-weighted ETFs can become more concentrated as winners grow larger. The fund may not change its rules, but its effective exposure can still drift toward a smaller group of dominant companies, especially during strong momentum cycles. That drift is exactly why concentration review benefits from a recurring cadence. A snapshot from one quarter does not capture how the fund may have shifted by the next.
Human Review Still Matters
The review highlights where exposure is concentrated, but it cannot decide whether that exposure fits every portfolio. A risk team may accept high concentration in one allocation and reject the same concentration in another. The final decision depends on mandate, benchmark, diversification targets, risk limits, and investor expectations.
From ETF Diversification Claims to Concentration Visibility
ETF diversification is not only about the number of holdings. A fund may own more than 100 securities and still depend heavily on a few companies, sectors, or themes. That is why exposure analysis needs to go deeper than the headline fund structure.
QQQ made this clear. The fund held many securities, but the analysis showed strong technology weight, meaningful AI-linked semiconductor exposure, duplicated Alphabet exposure, and a long tail with limited influence. These layers created a different picture from the simple idea of broad holdings-based diversification.
An MCP-based concentration system helps portfolio teams make that gap visible. FMP provides structured ETF holdings, sector weights, company profiles, market-cap data, and price inputs. Claude connects those inputs into a clearer view of top holding dependency, sector imbalance, issuer exposure, and thematic concentration.
This does not make concentration good or bad by itself. It makes the exposure easier to understand. Portfolio teams can then decide whether the dependency fits the fund's role, the portfolio mandate, and the level of risk they are willing to accept.
For teams that want to operationalize ETF exposure monitoring, FMP's datasets and MCP access can support a scalable concentration review system across funds, sectors, themes, and allocation models. Teams can explore FMP pricing plans before building a broader portfolio surveillance setup.







