


An FMP Signals Lab Case Study
In the second quarter of 2026, FMR LLC, the filing entity for Fidelity, more than doubled its position in UnitedHealth Group, lifting its stake from roughly 12.0 million to 28.0 million shares. UNH rose 53.6% over the quarter, so a manager who traded nothing at all would still have seen the position's weight in their book climb on price alone. Applying the 13F Drift Framework separates the two effects.
Of the 0.3337 point increase in Fidelity's book weight, 0.0455 points came from price movement and 0.2882 points from buying, so 86% of the increase was trade-driven. That produced the strongest drift score in the defined UNH universe, +2.76, more than two and a half times the next filer. That accumulation ran against a field that mostly went the other way: 16 of the 28 filers in the universe cut their share counts, led by Capital Research Global Investors at -38.4%.
This case study applies the framework to one contested ownership move to show how the active-versus-passive split changes the read. It is not a forecast of UnitedHealth's returns.
Case Study Parameters
|
Signal |
13F Drift |
|
Company/Security |
UnitedHealth Group Incorporated (UNH) |
|
Quarter |
Q2 2026 |
|
Filing Window |
Quarter ended Jun. 30, 2026: filings due by Aug. 14, 2026 |
|
Share Class Scope |
UNH, a single class of common stock |
|
Methodology |
Active vs. passive decomposition from the 13F Drift Framework |
|
Universe/Filter |
28 reporting 13F filers, defined in full under Defining Scope For the Study |
|
Price Convention |
Quarter-end close to quarter-end close: $270.59 on Mar. 31, 2026 to $415.63 on Jun. 30, 2026, a rise of 53.6% |
|
Data Source |
FMP 13F institutional ownership analytics endpoints. Quarter-end closes from the FMP historical price endpoint. |
|
Data Pull Date |
Sept. 10, 2026 |
New to the 13F Drift Framework? The full research system, including the active-versus-passive decomposition and the reproducible code, lives on the framework page. This case study applies it to one name for one quarter.
What We Looked At
UnitedHealth Group's share price rose 53.6% during the second quarter of 2026, from $270.59 to $415.63 on a quarter-end close-to-quarter-end close basis. That rise followed a long decline. UNH closed the first quarter of 2025 at $523.75, and by the end of the first quarter of 2026 it had fallen 48.3% from that level, to the lowest quarter-end close in at least a year. The second quarter recovered part of that ground, and left the shares 20.6% below the March 2025 close.
A move of this size, in either direction, is exactly where a static ownership snapshot becomes hardest to read. Every filer that held the name and did nothing saw its UNH weight rise over the quarter, and a filer that trimmed modestly could still show a larger position in dollar terms than it held three months earlier. In a single quarter's filings, read alone, buying and holding look much the same.
This case study runs the 13F Drift Framework on UNH for the quarter ending June 30, 2026, filed by the August 14 deadline, to separate active buying from price-driven drift and to see where the large holders actually stood. The position data comes from the Filings Extract With Analytics By Holder API, which returns each filer's current-quarter and prior-quarter values in the same row, so the quarter-over-quarter comparison is built in rather than assembled from two separate pulls.
One structural point applies to every reading below. A 13F is due 45 days after quarter end, so the positions described here were already several weeks old when they became public, and are older now.
Defining Scope For the Study
UNH has a single class of common stock, so there is no multi-class complication of the kind that affects issuers reporting separate Class A and Class C lines. Every figure below refers to the same security.
The universe is constructed by applying the following rules in order, and the filer count after each one is shown so the definition can be reproduced exactly.
|
Filter Applied, In Order |
Filers Remaining |
|
Filer rows returned for UNH, Q2 2026, all pages |
3,713 |
|
Position market value at or above $100,000,000 |
295 |
|
Rows carrying a put or call designation removed |
257 |
|
Blank investor names removed |
257 |
|
Prior-quarter shares at or above 1,000,000 |
94 |
|
Position market value at or above $2,000,000,000 |
30 |
|
Rows with a share change of zero removed |
30 |
|
Filer failing a prior-quarter integrity check removed |
28 |
|
Final universe |
28 |
Position market value is the size of the filer's UNH position, used as a practical proxy for filer scale rather than as a measure of the filer's total book. A production deployment would use total book size from the Holder Performance Summary API instead.
Three of these rules deserve a note. The options exclusion is applied on the put or call designation carried in the filing itself, not on the filer's name. Thirty-eight rows above the $100,000,000 threshold carried such a designation, and six of them were large enough to have reached the final universe, where they would have appeared as ordinary position changes. Because a reader cannot see that this filtering happened, the column below is labelled Common Share Change rather than Share Change.
The $2,000,000,000 position threshold takes the universe from 94 filers to 30. The $100,000,000 rule removes far more rows in absolute terms, 3,418 of the 3,713 returned, but almost all of those are small positions that were never candidates for the analysis. The $2 billion threshold is the rule that does the analytical work. It is a deliberate choice to surface large positions rather than the long tail, and it means the 28 filers here are not the complete list of institutions holding UNH.
The last rule is new to this study, and it applies two checks. The first compares each filer's prior-quarter baseline against what that filer actually reported for the first quarter of 2026, on share count and on market value. All 30 agreed, so nothing was carried forward incorrectly. The second checks that a filer's own share count and market value are consistent with the market price, in both quarters: dividing the reported value by the reported shares should return the quarter-end close. For 27 of the 30 it does, to within a tenth of a percent. Two filers fail, and both are excluded.
AllianceBernstein values its UNH position one quarter behind in both filings. Its first-quarter figures imply $330.11 a share, which is the December 31, 2025 close to the cent rather than the March 31 close of $270.59. Its second-quarter figures imply $270.59, the March close rather than the June close of $415.63. Neither error can be repaired from the filing that contains it.
JPMorgan Chase fails in both quarters and in opposite directions. Its first-quarter figures imply $261.79 a share against a close of $270.59, and its second-quarter figures imply $419.82 against a close of $415.63. A filer aggregating positions across sub-accounts would still return a price close to the market, because summing shares and values across accounts produces a weighted average. Opposite errors of this size mean the share count and the reported value cannot both be right, and nothing in the filing establishes which is. The discrepancy carries into the decomposition: the calculation returns an active weight of +0.045, where valuing the 1,143,506 shares the filer added at the June close against the same book returns +0.026.
Geode Capital is the third filer outside a tenth of a percent, at 0.34% in the first quarter and 0.36% in the second. Both deviations run the same way and are close to the same size, which is the signature of a different price source rather than an internal inconsistency, so it is kept.
Two filers report book changes far larger than the rest of the field: Invesco at 1.61 times and Amundi at 9.43 times, against a range of 1.05 to 1.32 across the other twenty-six. Neither figure is an error. Each reproduces exactly when derived from an unrelated holding, as the next section explains. The likeliest reading is that their first-quarter and second-quarter filings describe different reporting entities, but nothing in this data establishes that, so neither filer is excluded on suspicion. They rank ninth and eleventh and appear in neither table below.
Excluding the two filers that fail the valuation check does not drive the findings, and the figures either way are set out here.
|
|
Published universe, 28 |
All filers, 30 |
|
Fidelity active weight |
+0.2882 |
+0.2882 |
|
Trade-driven share of the weight increase |
86.4% |
86.4% |
|
Fidelity drift score |
+2.76 |
+2.83 |
|
Fidelity rank |
1 of 28 |
1 of 30 |
|
Ratio to the next filer |
2.56x |
2.69x |
|
Filers with positive active weight |
12 of 28 |
13 of 30 |
Fidelity's active weight and its trade-driven share are identical under both universes, because both are properties of Fidelity's own filing rather than of the distribution the scores are measured against. Both tables below contain the same eight filers under either universe, with only the last two reducer positions changing order.
A Note on the Framework Version
This study applies a revised version of the active and passive split. Earlier work in this series estimated the price-driven component by applying the name's price change to the prior-quarter weight, which holds the rest of the filer's book fixed in value. That assumption fails whenever the book's other holdings move, and in a quarter when books rose broadly it pushed the trade-driven residual negative across almost the whole field. The version used here replaces the assumption with each filer's actual book value in both quarters, which the filing itself supplies: a book's value is the market value of a position divided by the weight that position carries.
That derivation was tested rather than assumed. If the weight field is a true portfolio weight, the same filer's book must emerge whichever of its holdings is used to compute it. Across the 1,981 filers that reported both UNH and Apple for the quarter, every one produced the same book value from either security, with a median disagreement of 0.01% and a worst case of 0.45%. The revised passive component also divides by the book as it stands at quarter end, which already contains any shares the filer bought. Recomputing against a counterfactual book with that trading removed changes active weight by a median of 0.0003 points and at most 0.008, so the choice is immaterial.
Consistent with the framework page's stated policy, earlier case studies are not retroactively edited and stand on the version in effect when they were published.
Fidelity's Increase Was Mostly Buying, Not Price
FMR LLC increased its UNH share count by 132.9% over the quarter, from 12,019,046 shares to 27,992,995, adding 15,973,949 shares. The position went from roughly $3.25 billion to $11.63 billion. Of that $8.38 billion increase, about $1.74 billion is price appreciation on shares already held and about $6.64 billion is new shares valued at the quarter-end close.
The drift score combines the change in share count, the percentage change, and the trade-driven weight change into one number, where a higher score means stronger net accumulation. It is a composite of three inputs, not a single reported field. On that measure Fidelity records +2.76, the highest in the defined universe and more than two and a half times the +1.08 of the next filer, Fisher Asset Management.
The decomposition is what makes the increase legible. Fidelity's UNH weight rose from 0.1713% of its book to 0.5050%, a total change of +0.3337 points. Fidelity's book itself grew over the quarter, from $1.90 trillion to $2.30 trillion, a rise of 21.4%. Setting the position's prior value against the book it actually sits in today, price movement accounts for +0.0455 points of the weight increase. The remaining +0.2882 points is the trade-driven residual. So 86% of the weight increase came from buying rather than from the price, in a quarter when the price was rising and doing some of the work unaided.
Two pieces of context keep this in proportion. Fidelity has reported a UNH position for 72 consecutive quarters, first appearing in September 2008, so this is a long-standing holder scaling up rather than a new thesis being established. And at 0.5050% of its book, UNH remains a small weight for Fidelity. This is a large commitment in dollar terms inside a very large and diversified book, not a concentrated position.
Fidelity (FMR LLC): UNH Weight Change Decomposed, Q2 2026
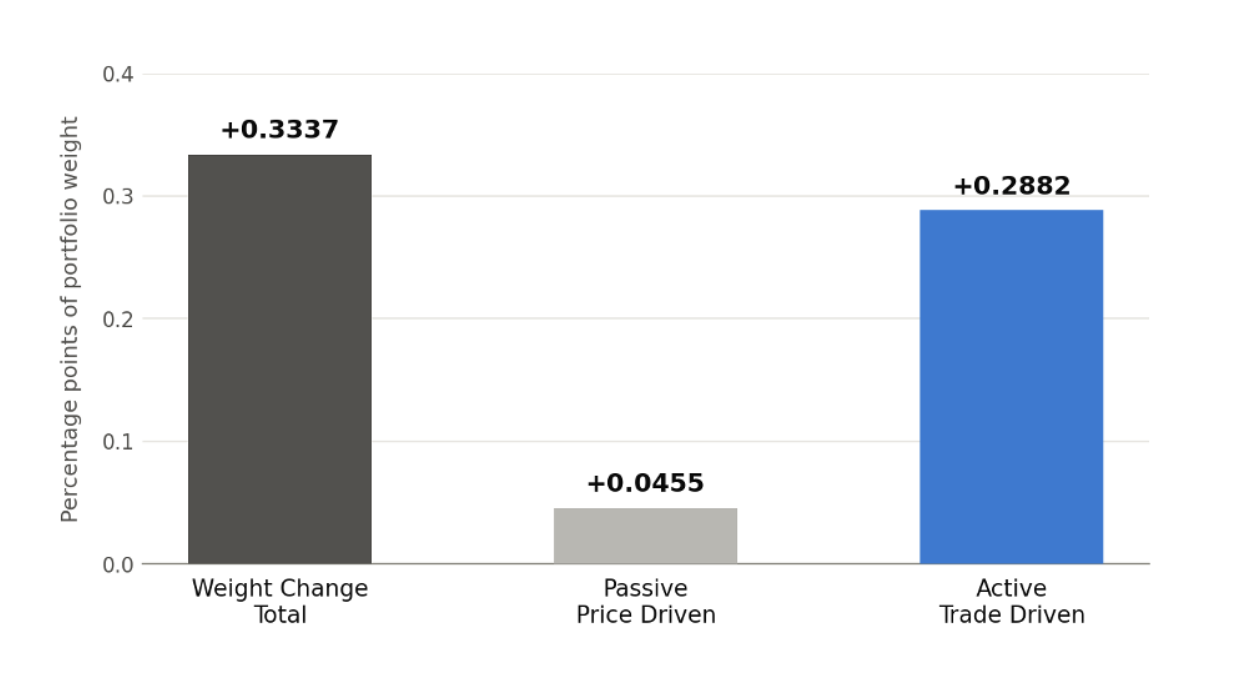
Reading the chart: Total is the reported change in UNH's share of Fidelity's book, in percentage points. Passive is the weight the position would carry today had Fidelity not traded, given the book's actual size at quarter end. Active is the trade-driven residual, the value the position gained through buying, as a share of that book. Passive and Active are framework-derived, not reported 13F fields.
What the Accumulator Table Surfaces and What Needs Context
Top Active Accumulators of UnitedHealth Group, Q2 2026
|
Filer |
Common Share Change |
Pct Change |
Active Weight |
Drift Score |
|
FMR LLC (Fidelity) |
+15,973,949 |
+132.9% |
+0.288 |
+2.76 |
|
Fisher Asset Management |
+3,844,568 |
+73.4% |
+0.476 |
+1.08 |
|
Franklin Resources |
+2,969,666 |
+52.3% |
+0.267 |
+0.52 |
|
Capital World Investors |
+2,104,517 |
+7.6% |
+0.104 |
+0.34 |
|
T. Rowe Price |
+2,279,867 |
+10.9% |
+0.095 |
+0.32 |
|
BlackRock |
+3,395,530 |
+4.6% |
+0.021 |
+0.24 |
|
Bank of New York Mellon |
+616,723 |
+6.1% |
+0.043 |
+0.05 |
|
Wellington Management |
+583,536 |
+5.8% |
+0.042 |
+0.04 |
Common-stock positions only. Options-based holdings are excluded: rows carrying a put or call designation in the filing are removed before the universe is built. UNH has a single class of common stock. Common Share Change and Pct Change come directly from 13F filings. Active Weight and Drift Score are framework-derived: Active Weight is the value the position gained through trading as a share of the filer's book, and Drift Score is the composite ranking measure defined on the framework page. The table is ranked by Drift Score, not by share change.
Every filer in this table increased its share count, and every one carries a positive active weight. That consistency is a product of the revised calculation. Under the earlier estimate, five of these eight showed a negative trade-driven weight change while their share counts rose, which is a contradiction rather than a finding: they were being charged for the growth of the rest of their own books. Across the full universe, the old estimate produced nine such cases. Capital World Investors is the clearest, moving from -0.108 to +0.104 once its book is accounted for.
The top three stand apart on scale of accumulation rather than on the sign of the number. Fidelity, Fisher Asset Management and Franklin Resources each increased their share counts by more than 50%. Below them the character of the table changes. BlackRock added more shares than Franklin Resources in absolute terms, 3,395,530 against 2,969,666, but did so on a 4.6% increase to an already very large position, which is the pattern of a large index and multi-strategy platform rather than a discretionary decision on UNH.
Fisher Asset Management is worth pausing on for a different reason. Its active weight of +0.476 is larger than Fidelity's +0.288, so on the trade-driven weight component alone it ranks first. Fidelity still leads the composite because its share-count and percentage changes are far larger, and those two inputs carry 60% of the weighting between them. That is a useful reminder that the drift score is a weighted blend and that no single column in this table determines the ranking.
This kind of reading depends on having the filer's full position detail, prior-quarter baseline, security type and portfolio weight available together. Because FMP exposes all of them in one place, the accumulator list can be interrogated rather than taken at face value: the put and call designation made the options exclusion possible, the prior-quarter filings made the baseline check possible, and the weight field is what allows each filer's book to be measured at all.
Most of the Field Reduced Into the Rally
Accumulation is more interesting when it is contested, and UNH in the second quarter was contested. While Fidelity built, a majority of the universe cut: 16 of 28 filers reduced their share counts, against 12 that added.
Top Active Reducers of UnitedHealth Group, Q2 2026
|
Filer |
Common Share Change |
Pct Change |
Active Weight |
Drift Score |
|
Capital Research Global Investors |
-6,578,041 |
-38.4% |
-0.381 |
-1.19 |
|
Bank of America |
-1,977,810 |
-16.9% |
-0.053 |
-0.33 |
|
Charles Schwab Investment Mgmt |
-987,167 |
-4.7% |
-0.055 |
-0.30 |
|
Geode Capital Management |
-1,016,758 |
-4.5% |
-0.023 |
-0.25 |
|
Capital International Investors |
-1,212,284 |
-13.5% |
-0.104 |
-0.23 |
|
Dodge & Cox |
-394,498 |
-4.2% |
-0.086 |
-0.21 |
|
UBS Asset Management Americas |
-907,824 |
-12.2% |
-0.0691 |
-0.13 |
|
Goldman Sachs |
-863,0504 |
-11.0% |
-0.031 |
-0.13 |
Common-stock positions only. Options-based holdings are excluded: rows carrying a put or call designation in the filing are removed before the universe is built. Sorted ascending by Drift Score. Common Share Change and Pct Change come directly from 13F filings. Active Weight and Drift Score are framework-derived. This table shows active position reduction within the 13F Drift Framework. It is not a bearish signal, a forecast, or an investment conclusion on its own.
Capital Research Global Investors is the clearest reducer in the group by a wide margin. It sold 6,578,041 shares, cut 38.4% of its position, and its active weight of -0.381 is more than three times the next largest reduction on that measure. Bank of America cut 16.9%, Capital International Investors 13.5%, UBS Asset Management Americas 12.2% and Goldman Sachs 11.0%. Every row here shows a reduction in the share count itself as well as a negative trade-driven weight, so none of them is an artefact of the weight calculation.
The three smallest reductions in the table, Charles Schwab at 4.7%, Geode Capital at 4.5% and Dodge & Cox at 4.2%, are real but modest, and their ordering relative to one another should not be read as a ranking of conviction. The composite is separating them on differences of a few hundredths of a point.
Taken together, the reducers are the counterweight to Fidelity. As one long-standing holder more than doubled its position, a majority of the large filers in the universe were trimming into a quarter when the price rose 53.6%. The framework does not adjudicate who is right. It quantifies the split, which is the point.
What This Tells Us, and What It Does Not
The framework establishes several things about the quarter with reasonable clarity. Fidelity more than doubled a position it has held since 2008, and 86% of the resulting weight increase came from buying rather than from the price, measured against the actual growth of its own book. That gave it the highest drift score in the defined universe by a wide margin, and it happened while a majority of the large filers in that universe were reducing. As a description of what changed, that is solid.
What it does not establish is what happens next. This is a single-quarter reading, and 13F data arrives with a 45-day lag, so the positions described here are already several weeks old. A manager who builds aggressively in one quarter may keep building, hold, or reverse. The framework treats a single-quarter drift score as an attention signal, a reason to look more closely, rather than a conclusion. The stronger read comes from whether the position persists across the following quarters, which later studies in this series will track as the filings arrive.
Three limitations bear on how these numbers should be read.
The universe is deliberately narrow. Twenty-eight filers is a much smaller set than the several hundred that report UNH, and it is the product of a $2 billion position threshold applied to a single name. Conclusions drawn here describe the behavior of large position holders. They do not describe institutional ownership of UNH as a whole, and drift scores are comparable within this universe rather than across studies with differently sized universes.
Two filers report book changes that are internally consistent but hard to credit as organic. Invesco's reported book grew 61% over the quarter and Amundi's grew 843%, against a range of 5% to 32% across the rest of the universe. Both figures reproduce exactly when derived from an unrelated holding, so the filings are not in error, and the likeliest explanation is that the two quarters describe different reporting entities. Nothing available here settles it. Both filers are left in the universe and neither reaches either table, but a reader comparing filers on the trade-driven measure should know that those two rows rest on a book comparison that may not be like for like.
A new position and a missing filing are not the same thing, and the data does not always separate them. Three filers report UNH positions above $1 billion for the second quarter with no first-quarter position to measure against, so none enters the universe. They are not one phenomenon. Sixth Street Partners filed a 13F for the first quarter and reported no UNH, so its $8.24 billion position is a genuine initiation. Jupiter Topco has no filing history before this quarter at all, so it is a new filing entity rather than a new holder. Norges Bank did not file for the first quarter, and since it has skipped quarters before, its $5.29 billion position cannot be classified from this data either way. The new-position flag records the absence of a comparison, and what that absence means has to be established filer by filer.
A drift score is an attention signal. It is not a verdict on a filer, a judgment of skill, or a statement about the security. What the quarter shows plainly is narrower than that, and still worth having: as UNH climbed and most of the large holders in this universe used the move to reduce, a manager that has held the name since 2008 more than doubled it, and once its own book growth is accounted for, the decomposition says it got there by buying.
For the full framework and the code to reproduce this analysis on any name, see the framework page.







