


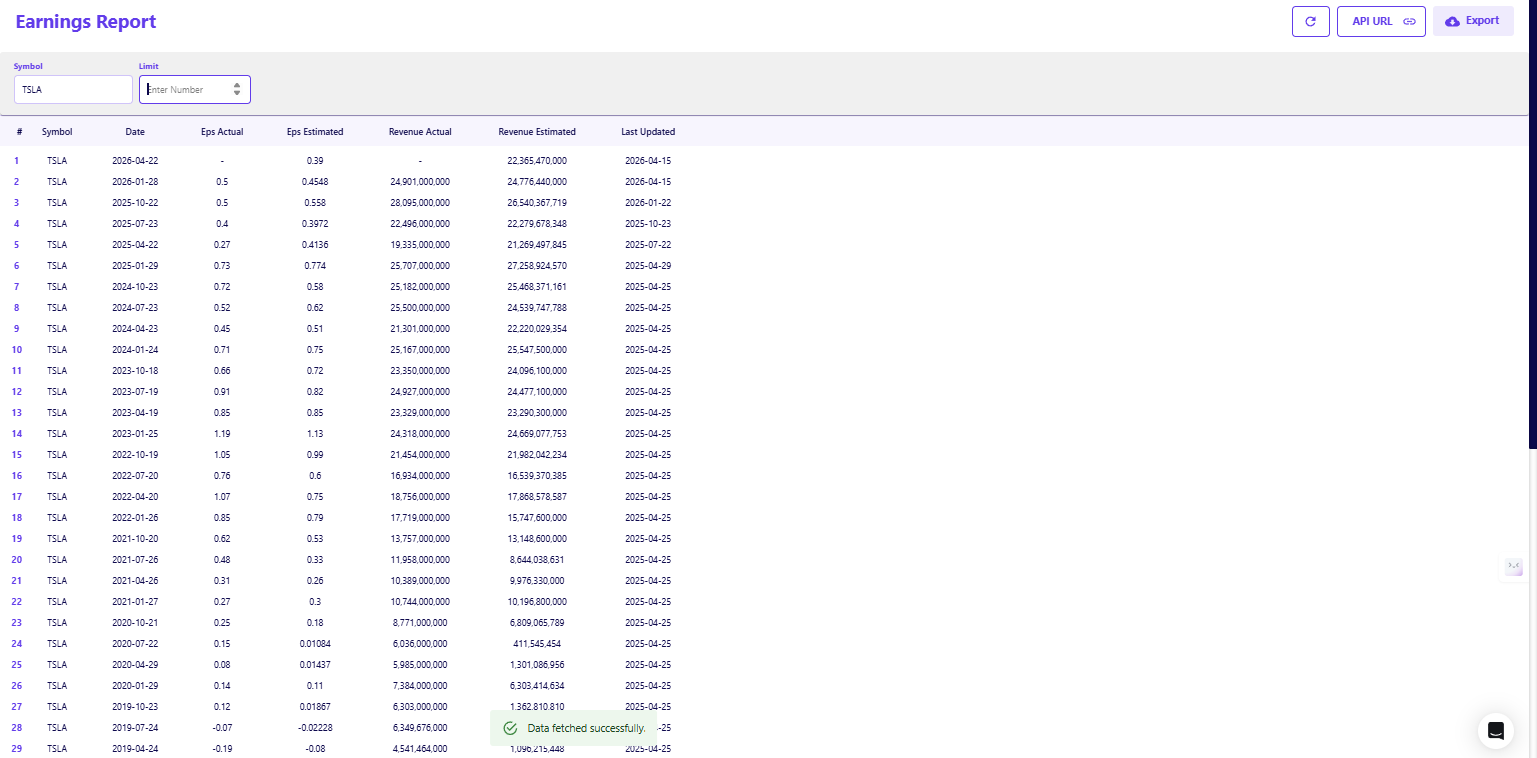
An earnings surprise is officially defined as the numerical difference between the consensus analyst expectation and the actual reported figure at the exact time of the earnings release. This dataset is derived from three core inputs: analyst consensus estimates, reported earnings results, and earnings event timestamps. Evaluating a fifty-cent earnings per share delivery in isolation provides a fragmented view of corporate performance. In October 2025, Tesla reported an actual EPS of 0.50 that missed consensus expectations of 0.558. Three months later in January 2026, the company reported the exact same 0.50 EPS, but this time it registered as a positive surprise against a lowered 0.4548 consensus.
The operational delivery remained entirely flat across six months, yet the resulting dataset recorded one failure and one success. This illustrates why earnings surprise data must be treated as a derived dataset layer rather than a static reporting figure. Analysts calculate this layer by extracting the exact consensus estimate immediately prior to an event and measuring the variance against the final actual results.
Building a complete historical view requires aligning these moving estimates with reported actuals programmatically across thousands of events. Application programming interfaces enable this by providing structured access to both historical consensus pipelines and actual earnings reports. This infrastructure allows quantitative teams to track sequences of historical performance to track sequences of estimate-versus-actual outcomes over time.
Key Takeaways
- Earnings surprises operate as derived datasets, calculated by extracting the precise variance between pre-event consensus estimates and final reported results.
- Temporal alignment remains the primary engineering hurdle; capturing estimates immediately prior to the earnings print prevents post-event revision leakage and lookahead bias.
- Institutional platforms provide pre-calculated metrics, while APIs function as foundational data infrastructure that allows quantitative teams to construct bespoke historical tracking layers.
- Evaluating continuous sequences of beats and misses standardizes performance tracking and isolates true management execution from shifting sell-side sentiment.
Where Can I Find Surprise History for Past Earnings Releases?
Earnings surprise history requires varying levels of data infrastructure depending on the depth of analysis needed:
- Retail platforms provide visual, limited history suitable for brief reviews of recent quarters.
- Institutional datasets supply standardized, deeper history with consistent methodology across covered equities.
- Application programming interfaces deliver structured, programmatic access to the underlying historical records required to build custom tracking layers.
These infrastructure feeds deliver the company-level and event-level granularity necessary to map performance across entire economic cycles. Historical depth fundamentally changes how quantitative teams utilize earnings data. Isolating long sequences of aligned estimates and actuals allows systems to distinguish between isolated deviations and consistent patterns across reporting periods. Tracking these historical event-level datasets provides a structured view of estimate-versus-actual outcomes over time.
What Exactly Is Included in Earnings Surprise Data?
A robust earnings surprise dataset relies on a standardized schema of core fields to maintain temporal accuracy. The structure requires a company ticker, the specific reporting period, the aggregated consensus estimate, and the actual reported metric. Data pipelines calculate the surprise value from these inputs, expressing the variance as both an absolute currency difference and a normalized percentage. Each earnings release is a discrete event-level data point.
Relying on the FMP Earnings Report API allows analysts to extract the exact components needed to derive this layer. Returning to the TSLA January 2026 reporting event, the data provides an actual EPS of 0.50 and an estimated EPS of 0.4548. The resulting derived data point is an absolute surprise of +0.0452 and a normalized percentage variance of +9.93 percent.
Normalizing the bottom-line surprise into a percentage ensures analysts can accurately compare deviations across companies with vastly different share prices. A ten percent earnings deviation carries the same relative weight in a time-series model whether the absolute difference is three cents or three dollars. Each of these normalized percentage calculations functions as a discrete event within a larger tracking mechanism.
Why Earnings Surprise Data Requires Alignment Across Datasets
Calculating an accurate historical surprise requires capturing a valid consensus estimate at the exact time of the earnings release. Extracting an estimate snapshot even one day late contaminates the tracking layer with post-event analyst revisions. The primary engineering challenge involves matching the correct historical estimate to the corresponding fiscal reporting period without introducing lookahead bias.
Consider the TSLA earnings date scheduled for April 22, 2026. The data pipeline must lock in the estimated EPS of 0.39 and the estimated revenue of 22.36 billion prior to the actual print. If the pipeline pulls the estimate on April 23, the data will likely reflect adjusted forward guidance rather than the true pre-event expectation.
Inconsistency across data providers further complicates this temporal alignment due to varying consensus methodologies and analyst cutoff windows. Resolving these discrepancies internally requires dedicated data engineering resources just to maintain a baseline tracking environment. Relying on pre-aligned data layers ensures systems maintain consistent event-level alignment without requiring manual reconciliation of fiscal calendar mismatches.
How Institutional Platforms vs APIs Handle Earnings Surprise Data
Institutional platforms distribute earnings surprise data as pre-calculated, standardized metrics applied uniformly across all covered equities. This method guarantees immediate historical depth with consistent methodology, serving analysts who need standard terminal access without building local infrastructure. These closed ecosystems prevent teams from inspecting the underlying estimate spread or applying unique exclusion rules.
Application programming interfaces provide the raw estimate and actual data components separately to support flexible analysis pipelines. The FMP Financial Estimates API reveals that the 2026 TSLA consensus EPS of 2.598 is actually derived from thirty-three analysts with a massive spread ranging from a 1.41 low to a 3.46 high.
APIs provide access to estimate and actual data components, allowing teams to construct custom earnings surprise calculations and maintain consistent historical tracking across reporting periods.
Transitioning from static terminal exports to programmatic ingestion drastically reduces internal data alignment errors. Institutional tools deliver a finished metric, while APIs supply the structural data necessary to build custom tracking logic. Integrating these discrete data feeds allows firms to enhance their research and evaluation workflows without replacing proprietary risk models.
How to Build a Historical Earnings Surprise Tracking Workflow
Deploying a reliable tracking system requires a strict sequence to process and align raw reporting components. The initial step demands retrieving historical consensus estimates mapped to specific corporate reporting periods. The second step captures the actual reported figures finalized during those corresponding earnings announcements.
The third step focuses on precise temporal alignment. Analysts must ensure the consensus estimate represents the market expectation immediately prior to the print by matching the timestamps directly.
Once aligned, the workflow calculates the absolute and percentage difference to quantify the surprise. The final phase translates these discrete event calculations into a continuous historical database. This structured history creates a continuous historical dataset of event-level earnings outcomes that can be tracked across companies and reporting periods.
What Earnings Surprise Data Enables in Practice
Structured earnings surprise datasets enable consistent tracking of estimate-versus-actual outcomes across reporting periods.
At a foundational level, these datasets support tracking sequences of earnings events, allowing systems to organize historical results into aligned time-series structures. This enables comparison of outcomes across quarters, companies, and economic cycles using standardized data.
They also support performance benchmarking by maintaining consistent records of expected versus reported results. Because each earnings release is treated as a discrete event, systems can compare outcomes across companies without introducing inconsistencies from differing reporting structures.
The primary value lies in structuring these derived data points into a continuous historical dataset. This allows organizations to maintain a unified record of earnings outcomes that can be integrated into broader financial data systems without relying on fragmented or point-in-time snapshots.
Turning Earnings Surprise Data Into a Structured Performance Layer
Earnings surprise data demonstrates maximum utility when extracted and maintained as a continuous historical dataset rather than evaluated as isolated quarterly events. Aligning estimates and actuals at the event level generates a factual, structured historical record of estimate-versus-actual outcomes.
Institutional platforms standardize this information into rigid metrics, while APIs allow engineering teams to build bespoke historical performance layers. Constructing these internal systems demands rigorous dataset alignment and temporal accuracy to prevent systemic lookahead bias.A properly aligned tracking mechanism supports consistent tracking of corporate performance across economic cycles.
Frequently Asked Questions
What is the difference between an absolute and percentage earnings surprise?
An absolute earnings surprise calculates the exact currency variance between the estimated EPS and the reported EPS. A percentage surprise divides that absolute difference by the baseline estimate to normalize the variance. Normalization is mathematically required to track and compare performance magnitude across companies with vastly different share prices.
How far back does historical earnings surprise data typically go?
Retail finance platforms generally display four to eight quarters of recent earnings surprise history for casual review. Institutional APIs and historical datasets provide ten to twenty years of temporally aligned estimates and actuals. This extended historical depth covers multiple macroeconomic cycles and allows for accurate long-term consistency tracking.
Why do different platforms show slightly different earnings surprise values?
Data vendors utilize varying consensus methodologies and apply distinct cutoff dates for analyst inclusions prior to the actual earnings print. Providers also implement different rules for handling non-recurring items or specific non-GAAP adjustments. If the baseline consensus estimate differs even slightly between providers, the resulting derived calculation changes.
What causes data alignment issues when calculating historical earnings surprises?
Misalignment happens when consensus estimate timestamps are not properly matched to the exact moment of the final earnings release. Fiscal quarter mismatches, corporate calendar adjustments, and late reporting revisions cause off-by-one errors in time-series datasets. Pulling a consensus estimate after the actual release occurs introduces severe lookahead bias into the tracking layer.
Do earnings surprise APIs include revenue estimates?
Many institutional data providers include top-line revenue estimates and actual reported revenue adjacent to bottom-line EPS data. Revenue reporting structures remain less standardized across varying sectors than strict EPS figures. This structural variance demands careful data mapping and alignment when tracking historical top-line surprises.
How do stock splits affect historical earnings surprise tracking?
Historical EPS estimates and actual figures must be retroactively scaled to reflect any corporate stock splits to maintain accurate long-term tracking. Failing to apply a strict split adjustment results in massive artificial breaks in absolute EPS values within the time-series model. Institutional data feeds automatically adjust these historical figures to preserve the integrity of the tracking layer over time.







