


Market data APIs are not interchangeable. A workflow built for market microstructure research has different data needs than a daily backtest, a factor screener, or a dashboard that combines prices with fundamentals.
Some teams need tick data or order book depth because they are studying trade-level behavior, liquidity, execution quality, or very short-horizon price movement. Others need OHLCV or intraday bars because they are testing strategies across historical price series, building charting tools, or running lower-frequency models. Many research workflows also need pricing data connected to fundamentals, filings, estimates, ownership data, or corporate events.
The right API depends on the job. This article focuses on API selection, not trading strategy design. The goal is to understand what kind of market data structure fits the workflow before choosing a provider or building around the wrong feed.
Key Takeaways
- Tick data is useful for market microstructure, order book, execution-quality, and highly granular research workflows.
- OHLCV and intraday data support many backtesting, screening, charting, and lower-frequency quant workflows.
- Adjusted historical prices matter when a backtest needs to account for splits, dividends, and corporate actions.
- REST APIs can support historical research, backtesting, dashboards, and scheduled retrieval, but they are not usually built for low-latency execution.
- FMP is a strong fit when market data needs to connect with fundamentals, statements, filings, estimates, ownership data, company profiles, and broader financial context.
Tick Data Versus OHLCV Data
One of the first decisions is whether the workflow needs tick data or aggregated OHLCV data.
Tick data records individual trades and quotes. It is often used for market microstructure research, execution analysis, order book studies, liquidity modeling, and highly granular price research. This level of detail can matter when the workflow depends on what happened at the trade or quote level.
OHLCV data is different. It summarizes price and volume over a set interval, such as one minute, five minutes, fifteen minutes, one hour, or one day. Instead of processing every trade or quote update, the workflow uses a structured row with open, high, low, close, and volume for the period.
For many backtesting and research workflows, OHLCV is more practical than tick data. It is easier to store, easier to query, and easier to run across larger symbol universes. A workflow using 15-minute intraday price bars, for example, can study intraday price movement without processing raw exchange-level message data.
The decision comes down to resolution. If the workflow studies order book behavior, execution quality, or trade-level events, a specialized tick or order book feed may be needed. If the workflow is focused on historical returns, charting, screening, or lower-frequency backtests, OHLCV or intraday bars may be enough.
The same decision applies to subminute OHLCV feeds used in quant workflows: more resolution only helps when the workflow can use it.
Historical Price Data for Backtesting
Backtesting workflows usually need clean historical price series, consistent timestamps, and formats that can be pulled into a model or research environment without excessive cleanup.
Adjusted historical prices are especially important. A stock split or dividend can change the price series in a way that looks like a price move if the data is not adjusted. That can distort return calculations, volatility estimates, and historical strategy results.
For many workflows, full historical end-of-day price data is the starting point. It supports daily backtests, historical charts, portfolio research, and screening workflows that do not require intraday resolution.
The core question is simple: how much price history does the model need, and at what interval?
A daily factor model may only need end-of-day historical prices. An intraday strategy may need one-minute, five-minute, or fifteen-minute bars. A market microstructure workflow may need tick-level data from a specialized feed. Choosing the wrong level of detail can make the workflow harder to maintain without adding useful signal.
For teams still setting up a historical workflow, a small sample is often the best first test. Pulling clean historical stock price data helps confirm symbol coverage, response structure, adjusted pricing behavior, and whether the data fits the model before the workflow scales to a larger universe.
Derived Indicators and Raw Inputs
Some workflows need raw historical prices. Others benefit from derived indicators that are already calculated.
For example, a team may want to calculate moving averages, volatility measures, or other technical overlays locally. Another team may prefer to pull a pre-calculated indicator when the goal is dashboard display, screening, or faster prototyping.
A pre-calculated simple moving average is one example of derived data that can sit beside raw price history. It is not a requirement for backtesting, and it should not replace understanding the underlying price series. But it can reduce client-side calculation work when the workflow needs technical overlays alongside historical prices.
The choice is not “raw data or derived indicators” in every case. Many workflows use both. Raw prices support the research layer, while derived metrics can support dashboards, screeners, alerts, or exploratory analysis.
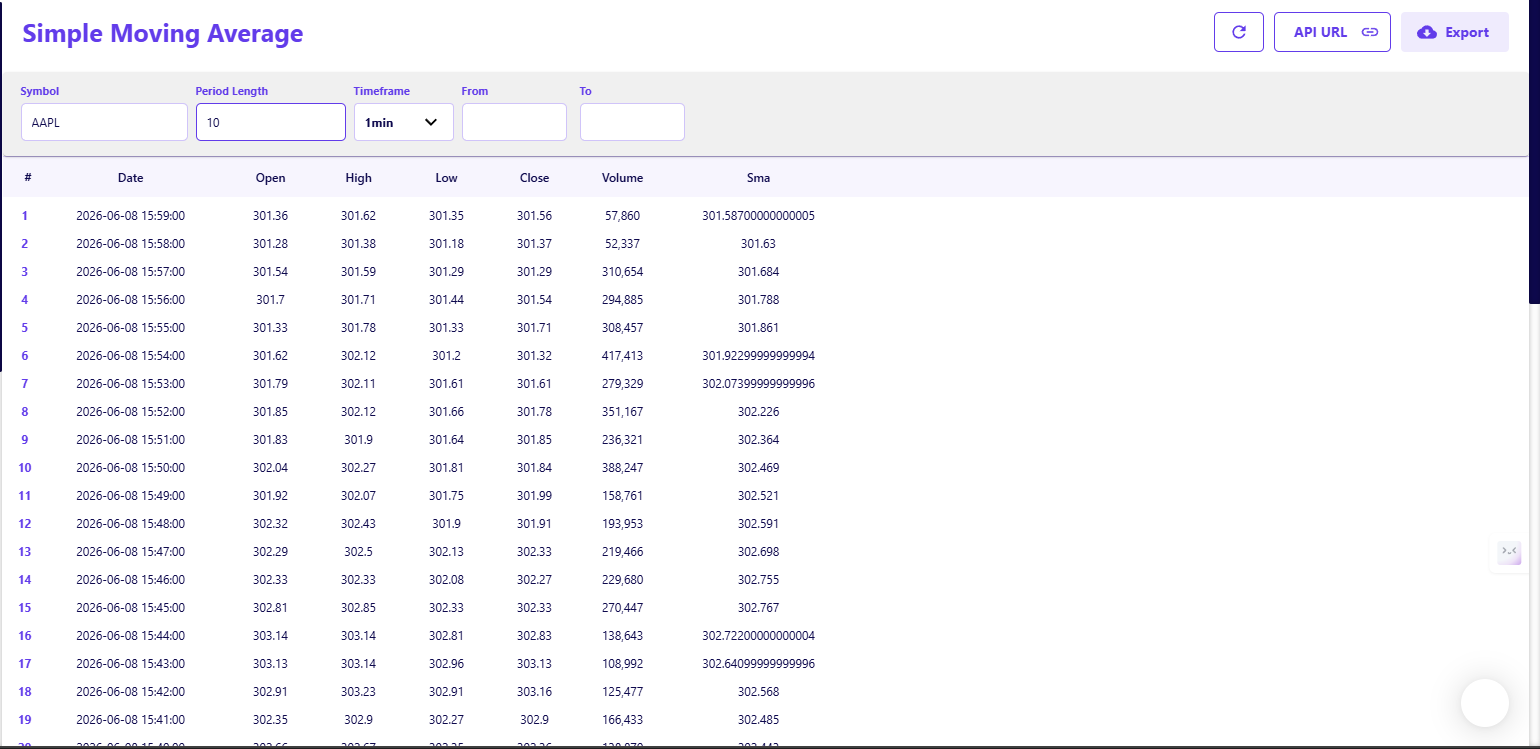
Pre-calculated indicator endpoints can reduce client-side calculation work when teams need technical overlays alongside historical price data.
Latency and Resolution Considerations
Market data workflows often get grouped together, but historical research and live execution have different technical needs.
Historical research and backtesting usually care about coverage, structure, completeness, and throughput. The workflow needs to pull enough data, across enough symbols, in a format the model can use. REST APIs are often well suited for this kind of work because they can deliver historical price data, fundamentals, estimates, and other datasets through standard HTTP requests.
Live execution workflows are different. If the system is routing orders or trying to act on very short-lived price changes, latency and delivery method matter more. Those workflows may need specialized low-latency infrastructure, direct feeds, WebSockets, or other delivery methods built for execution.
That does not make REST APIs less useful. It just means they fit different jobs. REST APIs can support historical research, backtesting, dashboards, scheduled data retrieval, and many non-execution workflows. They are generally not designed for microsecond-level execution.
|
Workflow Type |
What Matters Most |
|
Historical research and backtesting |
Historical depth, adjusted prices, coverage, structure, and throughput |
|
Dashboards and scheduled retrieval |
Reliable access, usable formats, refresh cadence, and endpoint coverage |
|
Live execution |
Latency, feed delivery, market depth, and execution infrastructure |
|
Multi-dataset research |
Pricing data connected to fundamentals, filings, estimates, ownership, and company context |
For teams comparing intraday, OHLCV, and high-frequency data structures, the tradeoff usually comes down to how much resolution the workflow actually needs and how much complexity the team is prepared to manage.
Where FMP Fits in Market Data Workflows
Some market data workflows need highly specialized pricing feeds. Others need market data connected to a broader financial research stack.
Specialized market data providers are often used when teams need raw tick data, full order book depth, venue-level feeds, or market microstructure data. Those workflows are usually focused on execution quality, liquidity analysis, order book behavior, or very short-horizon trading research.
FMP fits a different kind of workflow. It is useful when market data needs to connect with fundamentals, financial statements, SEC filings, analyst estimates, ownership data, company profiles, earnings events, and broader financial context.
That distinction matters for quant and backtesting teams. A strategy may start with historical prices, but the research process may also need to understand whether a price move happened around an earnings report, a filing update, a valuation change, a balance sheet shift, or a change in ownership data. In those cases, the data problem is not only about price history. It is also about connecting market data to the company and event context around it.
FMP should not be treated as a replacement for specialized tick-data, full order book, or low-latency execution infrastructure. Its strength is broader financial data coverage through APIs, especially for workflows where pricing is one input inside a larger research, modeling, screening, or dashboard environment.
For teams building those workflows, broader context can be the difference between pulling a price series and understanding what happened around it.
How to Match a Market Data API to the Workflow
The cleanest way to choose a market data API is to start with the workflow and work backward.
Use these questions before choosing a feed:
|
Question |
Why It Matters |
|
Do I need tick data or OHLCV data? |
Tick data fits trade-level and order book research. OHLCV fits many backtests, charts, screeners, and lower-frequency models. |
|
Do I need historical research data or live execution feeds? |
Historical research needs coverage, structure, and throughput. Live execution needs low-latency delivery and execution infrastructure. |
|
Do I need pricing alone or pricing connected to other datasets? |
Multi-factor research may need fundamentals, filings, estimates, ownership data, or corporate events alongside prices. |
|
Do I need single-symbol access or portfolio-wide snapshots? |
Large universes may benefit from endpoints that reduce request overhead. |
|
Do I need raw inputs or derived indicators? |
Raw data supports custom research. Derived indicators can help with dashboards, screening, or faster prototyping. |
For portfolio-wide pricing snapshots, batch quote access can reduce request overhead by pulling multiple quotes in a single call. That does not replace historical price data or tick feeds, but it can help when the workflow needs current pricing context across many symbols.
For broader workflows, API fit also depends on how pricing data connects to the rest of the research stack. A market data endpoint may answer one question. A full workflow may need to connect prices with company profiles, fundamentals, estimates, filings, ownership, or events. That is where integration starts to matter.
The right API depends on resolution, coverage, breadth, and delivery needs. Start there before comparing providers.
FAQs
What is the main difference between tick data and OHLCV data?
Tick data records individual trades and quotes. It is used when the workflow needs trade-level or order book detail. OHLCV data summarizes price and volume over a fixed interval, such as one minute, fifteen minutes, one day, or one week. OHLCV is often easier to use for backtesting, charting, screening, and lower-frequency research.
When do I need tick data instead of OHLCV?
Tick data is useful when the workflow depends on market microstructure, order book behavior, execution quality, or very short-horizon trading research. OHLCV data is often enough for daily factor models, historical screening, technical charting, portfolio research, and many lower-frequency backtests.
What type of API is better for backtesting?
Many backtesting workflows work well with adjusted historical OHLCV data. Adjusted prices help account for splits, dividends, and corporate actions, which makes historical return calculations cleaner. Intraday or tick-level APIs may be needed when the backtest depends on shorter time intervals or trade-level behavior.
Can FMP support quant and backtesting workflows?
Yes. FMP can support many quant, research, dashboard, screening, and backtesting workflows that use structured historical prices, intraday OHLCV data, real-time quotes, batch quotes, fundamentals, estimates, filings, ownership data, and company context.
FMP is especially useful when pricing data is part of a broader financial workflow. For example, a backtest or research tool may need historical prices, but it may also need company fundamentals, earnings events, analyst estimates, SEC filings, or ownership data.
What market data workflows are better suited to specialized providers?
Specialized providers may be a better fit when the workflow requires raw tick-by-tick exchange messages, full order book depth, venue-level feeds, packet-level data, or low-latency execution infrastructure. Those workflows are usually focused on market microstructure, order book behavior, execution quality, or very short-horizon trading.
Can REST APIs support historical research and backtesting?
Yes. REST APIs can support historical research, backtesting, dashboards, scheduled retrieval, and many non-execution workflows. They are generally not designed for microsecond execution, but they can work well when the goal is to pull structured historical or intraday data into a research environment.
When does a broader financial data platform matter?
A broader platform matters when pricing data needs to connect with other datasets. If the workflow uses historical prices together with fundamentals, filings, estimates, earnings events, ownership data, or company identifiers, it may need more than a specialized price feed.







