


Institutional capital often rotates at the sector level before broader market narratives fully adjust. Shifts in ownership across sectors can reveal where large investors are increasing conviction, reducing exposure, or repositioning around emerging themes. Those movements can act as early signals of sector leadership or potential deterioration.
Traditionally, identifying these signals requires manually reviewing 13F filings, aggregating ownership changes across holdings, mapping exposures by sector, and determining whether those shifts reflect meaningful rotation or short-term noise. That process is slow, fragmented, and difficult to scale consistently.
The approach outlined in this article, using Financial Modeling Prep's MCP server, enables research teams to transform institutional ownership data into a structured signal system for detecting sector rotation and evaluating capital flow shifts. By combining institutional ownership data, sector-level aggregation, and Claude-generated analysis, the process classifies capital flow signals as bullish, bearish, or neutral, while attaching confidence levels that support more consistent decision-making.
Rather than treating institutional ownership as a static screening exercise, this workflow frames it as a repeatable monitoring system for detecting sector rotation, generating decision-ready signals, and supporting capital flow analysis at scale.
Data quality plays a critical role in this type of analysis. Institutional ownership data can be noisy, delayed, or difficult to interpret in isolation. When ownership changes, sector mappings, and position data are aligned within a structured data layer, the resulting signals become more reliable, comparable, and consistent across sectors.
FMP Data Inputs Behind the System
This workflow combines multiple datasets from Financial Modeling Prep to move from raw institutional filings to sector-level capital flow signals. Each dataset contributes a distinct layer of the analysis: filing-level ownership changes, sector allocation shifts, and company-level positioning validation.
- Institutional Ownership Filings API: This endpoint provides the filing-level ownership layer for detecting how institutional positions are changing across reporting periods. It serves as the primary input for identifying additions, reductions, and emerging capital flow shifts.
- Holders Industry Breakdown API: This endpoint is particularly important for this workflow because it translates holdings into sector and industry exposure trends, making it possible to analyze where institutional capital is concentrating or rotating away.
- Positions Summary API: This dataset adds a company-level validation layer, helping determine whether sector-level flows reflect broad institutional conviction or are concentrated in a small number of names.
Taken together, these datasets move the workflow from raw 13F ownership disclosures to a structured sector rotation signal, where institutional capital movements can be evaluated as potential early indicators of strengthening or weakening sector positioning.
Accessing FMP Data via Claude MCP
To run this workflow inside Claude, we connect Financial Modeling Prep's data layer through its MCP server, which allows Claude to retrieve financial datasets directly without writing manual API requests.
You first need an active FMP API key, which can be generated from your Financial Modeling Prep dashboard. This key is used to authenticate all MCP-based data requests.
Once the API key is available, FMP can be connected in Claude using its remote MCP endpoint:
|
https://financialmodelingprep.com/mcp?apikey=YOUR_FMP_API_KEY |
In Claude, navigate to Settings → Connectors → Add custom connector, and paste this URL into the Remote MCP Server field. After saving, Claude will automatically discover the available FMP tools.
From this point, Claude can retrieve and reason across datasets such as institutional ownership filings, holders industry breakdown data, and position summaries within a unified analytical system. The MCP layer manages tool selection and data retrieval automatically, allowing multiple datasets to operate as an integrated research system rather than separate analytical tasks.
For this article, that system acts as the foundation for a sector rotation signal engine, transforming raw ownership disclosures into a structured monitoring platform for tracking institutional capital movement and sector positioning.
Building the Sector Rotation Signal Engine
Institutional ownership changes become more useful when transformed from filing-level observations into a structured signal engine. Rather than treating changes in holdings as isolated events, this system evaluates how capital is rotating across sectors and converts those shifts into interpretable positioning signals.
The engine is built around three dimensions. The first is net capital flow direction, which evaluates whether institutional ownership is expanding or contracting within a sector. Persistent increases in ownership can indicate accumulation, while broad reductions may signal weakening conviction.
The second dimension is breadth of participation, which examines whether positioning changes are supported by broad institutional participation or driven by a narrow set of investors. This distinction matters because broad participation often strengthens signal reliability, while concentrated flows may carry lower conviction.
The third dimension is capital concentration and momentum, which helps determine whether sector allocations are accelerating, stabilizing, or deteriorating over time. This adds a forward-looking layer to the system by distinguishing one-time positioning changes from sustained rotation behavior.
Together, these dimensions feed a signal classification layer:
Bullish Rotation Signal
Assigned when ownership expansion is broad-based, sector allocations are increasing, and capital flows show strengthening momentum.
Neutral Rotation Signal
Assigned when positioning signals are mixed, sector allocations remain stable, or evidence of rotation lacks sufficient conviction.
Bearish Rotation Signal
Assigned when ownership contraction broadens, sector exposure declines, and capital flows indicate deteriorating institutional positioning.
To make these classifications more decision-ready, the system also assigns a confidence layer. Signal confidence increases when capital flow direction, participation breadth, and allocation momentum align; it decreases when those dimensions diverge.
This structure turns raw ownership changes into a repeatable sector rotation signal engine, creating a consistent analytical foundation before examining actual sector-level outputs.
Applying the Signal Engine to Live Sector Data
To evaluate how the signal engine behaves in practice, the same framework was applied through Claude using live institutional ownership, sector exposure, and position summary data retrieved through the MCP-connected system. The resulting output shows how the classification framework translates from methodology into observable sector rotation signals.
Prompt Used for Signal Generation
|
Analyze sector rotation signals using FMP MCP data. Use institutional ownership filings, holders industry breakdown data, and position summaries to identify sectors showing increasing or declining institutional capital allocation. For at least three sectors:
Also identify whether the sector positioning suggests early leadership or possible sector decline. Return both:
|
Signal Interpretation from This Run
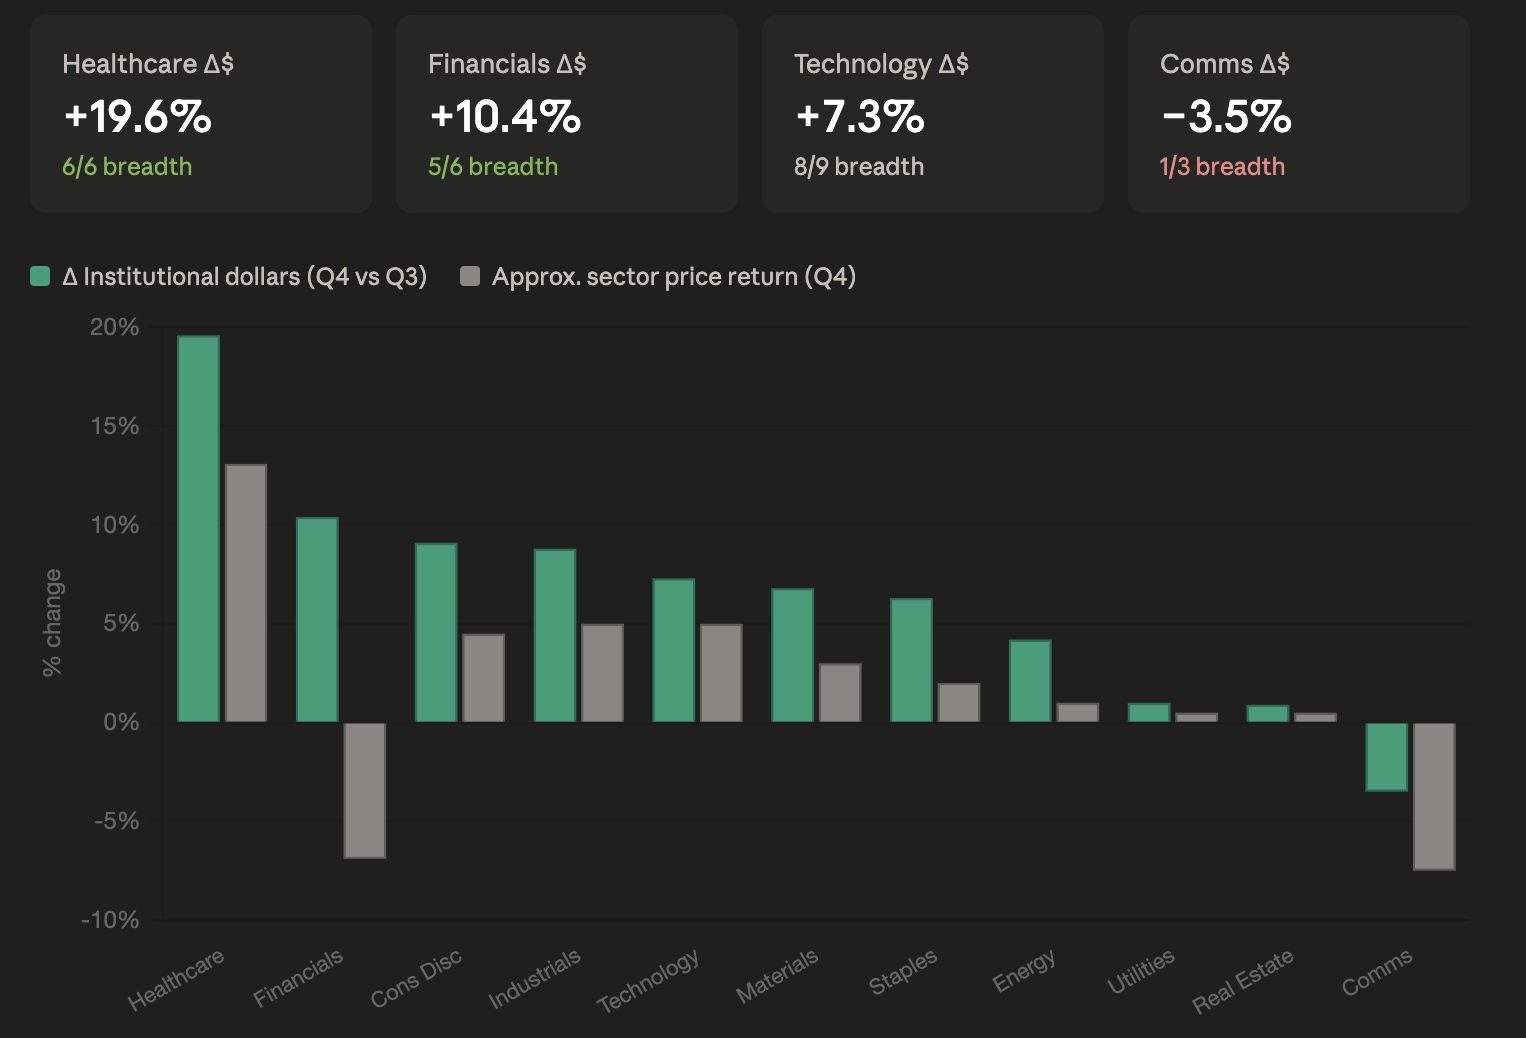
Running the prompt produced a clear risk-on rotation profile, with institutional capital rotating toward growth and cyclical leadership while defensive sectors showed distribution pressure.
Financials generated the strongest bullish signal with 85% confidence, supported by rising ownership, expanding invested capital, growing holder participation, and declining protective positioning. The alignment across all three dimensions made this the strongest conviction signal in the system.
Semiconductors also screened bullish with 82% confidence, driven by accelerating new-money inflows, growing sector AUM, and improving positioning behavior. The signal reflects broad institutional participation rather than isolated concentration.
Software and cloud infrastructure also remained bullish, reinforcing that institutional accumulation extends beyond a narrow thematic trade into broader technology infrastructure.
On the defensive side, Healthcare produced a 78% bearish signal, while Utilities registered a 72% bearish signal, both driven by broad capital distribution and weakening ownership trends.
Energy remained neutral to slightly bearish, with mixed capital flow signals reducing classification confidence.
Taken together, the system detected a risk-on sector rotation regime, with strongest conviction concentrated in Financials and Semiconductors, while Healthcare and Utilities showed the clearest deterioration signals.
Company-Level Comparison Within a Sector
Sector-level signals become stronger when validated at the company level. A sector can appear to attract institutional capital, but conviction is often very different when capital is broadly distributed across multiple leaders versus concentrated in a small number of names. That distinction matters because broad participation typically strengthens a sector signal, while narrow concentration can make leadership more fragile.
This system adds a company-level comparison layer to test whether sector rotation signals are supported by widespread institutional positioning or driven by isolated concentration.
For bullish sectors such as Financials and Semiconductors, the analysis can compare company-level positioning across representative leaders to evaluate:
- Whether institutional accumulation is broad-based across the sector
- Whether capital is clustering around a small number of dominant names
- Whether company-level positioning confirms or weakens the sector signal
For example, within Semiconductors, comparing ownership positioning across leading names can help determine whether the bullish sector signal reflects durable sector participation or concentration around a single AI beneficiary. The same logic applies in Financials, where broad positioning across banks may reinforce sector leadership more strongly than capital concentrated in only a few institutions.
This comparison layer improves the system by distinguishing sector momentum from concentration-driven momentum, adding a validation step before translating sector signals into stronger allocation views.
Prompt Used for Company-Level Validation
|
Using FMP MCP data, validate whether institutional conviction in Semiconductors and Financials is broad-based or concentrated.
For each company assess:
Then determine:
Return:
|
Company-Level Signal Validation and Divergence Analysis
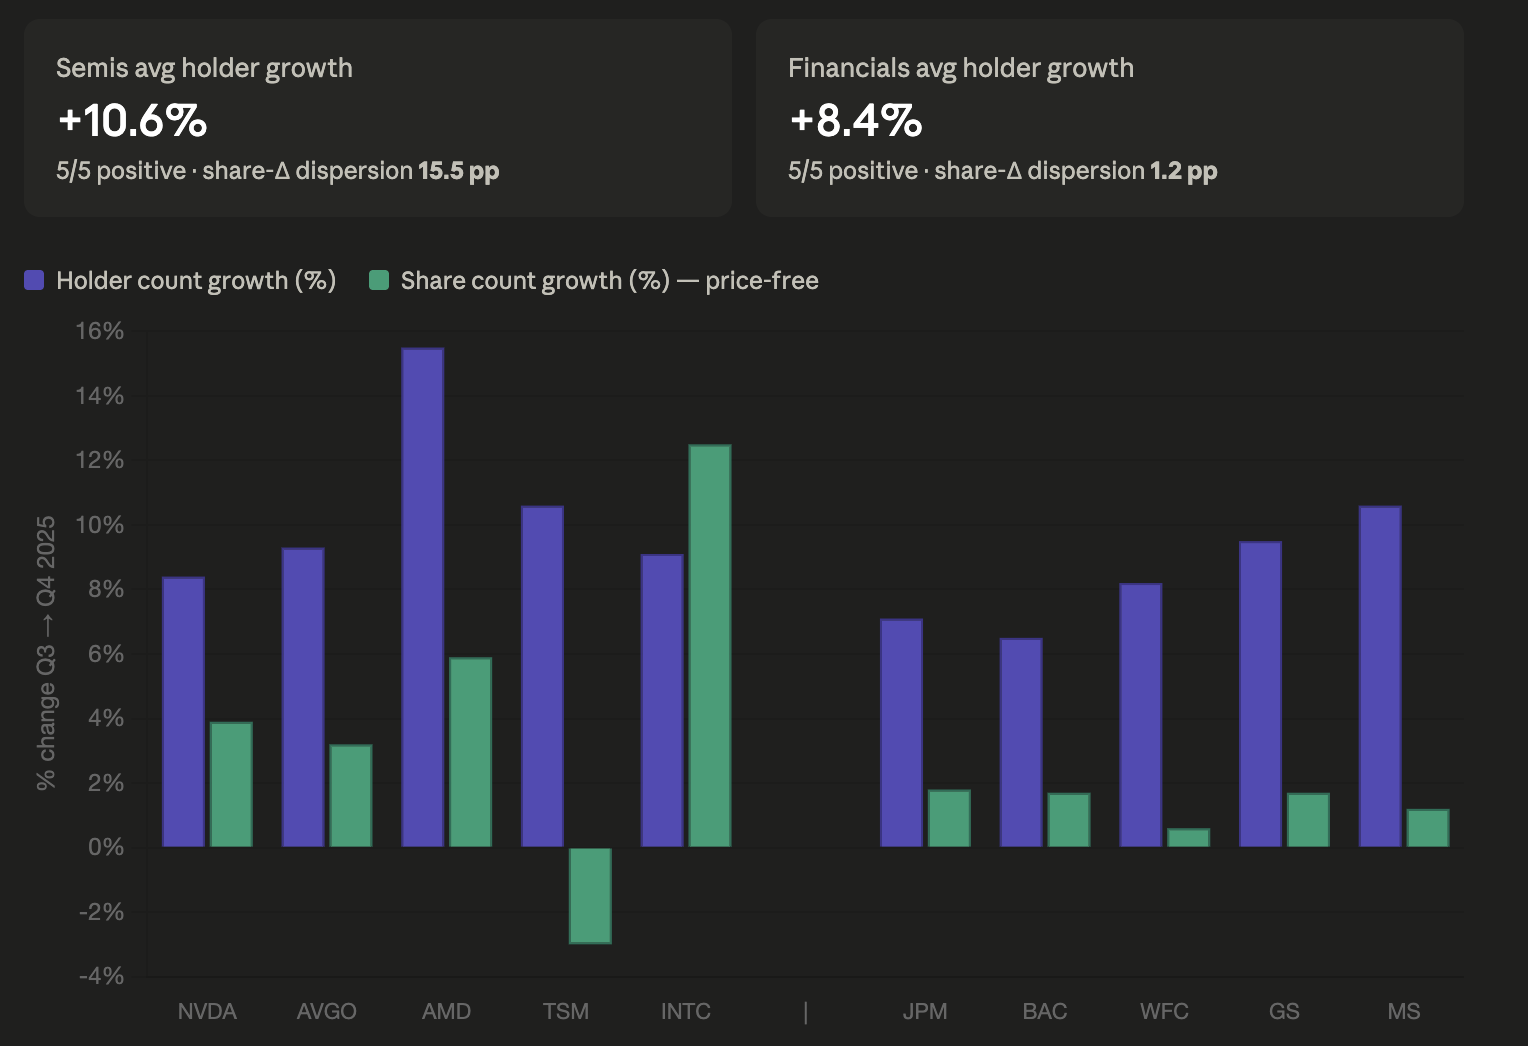
Company-level validation refined the sector signals by distinguishing broad institutional conviction from concentrated leadership, adding a second layer of precision to the system.
Financials: Broad-Based Conviction Strengthened the Signal
Financials strengthened the earlier bullish sector signal through consistent accumulation across banks and capital markets names, rather than concentration around a single leader. Position additions, broader holder participation, and improving positioning behavior all point to sector-wide institutional conviction.
This elevates Financials from a bullish sector signal to a stronger leadership signal supported by broad participation.
Semiconductors: Bullish Signal Confirmed, but Narrower Than It Appeared
Semiconductors remained bullish, but company-level data showed that momentum is concentrated primarily around AI compute and foundry exposure rather than evenly distributed across the sector.
That changes the interpretation materially. Rather than broad semiconductor leadership, the signal is more accurately an AI infrastructure leadership signal, with strong but narrower institutional support.
Divergences That Improved Signal Precision
The system also surfaced important divergences:
- AMD diverged from the broader semiconductor signal, suggesting selectivity may matter more than broad sector exposure.
- Broadcom showed ownership churn beneath strong inflows, introducing a potential stability risk.
- Bank of America showed slightly weaker conviction characteristics than other financial leaders, adding nuance within an otherwise strong financial signal.
At the company level, JPMorgan emerged as the strongest broad-conviction signal, while NVIDIA and TSMC anchored concentrated semiconductor leadership.
Overall, the validation layer strengthened the Financials signal while partially qualifying the Semiconductor signal, improving precision before translating sector rotation signals into allocation decisions.
Continuous Monitoring Framework
The signal engine becomes materially more useful when operated as a persistent monitoring system rather than a one-time analytical exercise. Instead of evaluating sector rotation only when filings are manually reviewed, the system can run on scheduled intervals, track changes in institutional positioning over time, and surface when signal classifications materially strengthen, weaken, or reverse.
A practical implementation would run the analysis on each new 13F reporting cycle, recompute sector rotation signals, and compare current classifications against prior periods to detect changes in institutional conviction. This transforms the system from static analysis into ongoing signal surveillance, enabling continuous tracking of institutional positioning across sectors.
Three monitoring layers support this structure:
Signal Tracking Layer
Track how bullish, neutral, and bearish sector classifications evolve across quarters, including changes in confidence levels and sector leadership rankings.
Change Detection Layer
Monitor for shifts such as:
- Bullish sectors weakening toward neutral
- Defensive sectors moving into accumulation
- Concentrated leadership broadening or deteriorating
- Divergences emerging between sector and company-level signals
These transitions often matter more than signal levels alone.
Delivery and Research Infrastructure Layer
Once generated, signals can be persisted and distributed through enterprise channels such as dashboards, research alerts, or Slack and email notifications, allowing teams to monitor rotation changes continuously rather than rebuilding analysis from scratch each quarter.
Operated this way, the system becomes less a research exercise and more a repeatable sector monitoring platform designed for ongoing capital flow surveillance.
Where the Signal Can Mislead
While institutional capital flow signals can surface valuable sector rotation dynamics, they are not immune to distortion. Like any systematic signal framework, interpretation improves when certain structural limitations are recognized.
Filing Lag Can Delay Emerging Rotation Signals
Because 13F disclosures are reported with a lag, institutional positioning may have already evolved by the time signals are observed. In rapidly changing markets, that lag can cause the system to capture established rotation rather than the earliest shift in positioning.
Concentration Can Overstate Sector Strength
Strong sector-level signals can sometimes be driven by a small number of dominant holdings rather than broad sector conviction. As the semiconductor validation showed, concentrated leadership can resemble broad sector momentum unless company-level participation is examined alongside sector aggregates.
Macro Regime Shifts Can Override Flow Signals
Institutional positioning can sometimes reflect macro hedging, policy expectations, or temporary risk repositioning rather than durable sector conviction. In those periods, capital flows may look like rotation signals even when they are responding to short-term macro shocks.
Signal Changes Often Matter More Than Static Signals
A sector screening bullish today may matter less than whether confidence is strengthening or weakening over time. For that reason, changes in signal direction often carry more information than any single classification in isolation.
These limitations do not weaken the system; they define where additional caution or context improves interpretation. In practice, they make the signal engine more robust by clarifying where sector rotation signals should be treated as strong conviction indicators versus conditional signals requiring additional validation.
Conclusion
Institutional ownership data becomes far more valuable when treated as a signal system rather than a static filing review exercise. By combining Financial Modeling Prep data, Claude, and MCP-driven orchestration, this approach turns fragmented ownership disclosures into a more reliable and consistent framework for detecting sector rotation, validating institutional conviction, and supporting decision-making at scale.
Operated as a persistent monitoring platform, the system improves how capital flow analysis is performed — making sector positioning signals more reproducible, scalable, and actionable for research teams. Teams that want to operate this system as a recurring research process can expand coverage across broader datasets and company universes. Financial Modeling Prep's pricing tiers provide scalable access to the data required to support this type of analysis at larger scale.







