FMP
Capturing ETF Flows as the Ultimate Early Signal for Capital Rotation
Oct 17, 2025
Money flows speak louder than analyst notes. While traditional valuation models fixate on historical financials, real-time ETF flow data captures capital's predictive movements, often signaling major sector shifts weeks before earnings reports or consensus revisions catch up.
This guide elevates ETF flow analysis from a basic tracking exercise to an essential component of market intelligence for CFOs, CIOs, and quant leaders. We detail how to interpret daily inflows and outflows in sector and thematic ETFs, translating these subtle shifts into actionable capital allocation and risk management strategies that drive alpha and provide a genuine information edge.
Reframing ETF Flows: Active Crowd Behavior and Predictive Analytics
For financial executives, the core strategic challenge is predictive asset allocation, identifying where the next wave of capital is moving. We must reframe ETF flows (Exchange-Traded Fund capital movements) not as passive fund mechanics but as a reflection of aggregate, real-time investor behavior and conviction.
When a large institutional investor a pension fund, hedge fund, or sovereign wealth fund executes a sector rotation (a strategic shift of assets from one sector or style to another), they frequently use ETFs for their speed and scale.
The resulting creation of new ETF shares, or inflows, provides a leading indicator for several critical reasons:
- Speed of Execution: ETFs trade instantly. Shifting billions in capital via ETFs is dramatically faster than trading hundreds of individual stocks, making the flow data exceptionally current. This speed is non-negotiable for large-scale portfolio managers reacting to macro data releases.
- Institutional Conviction: Major flow events represent the collective conviction of sophisticated, well-capitalized market participants, suggesting a structural bet on a macroeconomic or thematic trend. These flows are inherently less subject to high-frequency trading noise.
- Price Discovery: Significant inflows force the Authorized Participant (AP) to buy the underlying basket of stocks, exerting immediate buying pressure that often precedes broader market awareness and analyst revisions. This mechanism ties flow directly to near-term price momentum.
This rapid capital movement is a leading signal for market structure changes (e.g., shifts in market cap dominance or factor leadership). Executives must prioritize this data source to gain an information edge over those solely reliant on lagging financial statements and quarterly EPS (Earnings Per Share) reports. Recognizing the capital's movement before its impact is visible in traditional fundamentals is key to proactive portfolio positioning.
The Leading Indicator Edge: Sector Rotation and Thematic Shifts
The strategic value of analyzing ETF flows lies in their temporal advantage. Flow data reveals a changing market narrative before that narrative is validated by traditional financial metrics. This timing is invaluable for a Head of Strategy focused on anticipating competitive positioning and market trends.
The sequence of events is highly predictive: a macro signal leads a CIO to anticipate which sectors will benefit or suffer, initiating a portfolio adjustment via large buys or sells in sector-specific ETFs (e.g., Industrial Select Sector SPDR, XLB), creating massive, measurable inflows/outflows. These flows drive the prices of constituent stocks, and only later do analyst models and consensus estimates adjust.
This sequence confirms flow as a true leading signal. For instance, the resurgence of institutional capital into Energy ETFs in early 2023 was a clear anticipatory bet on global oil demand recovery and sustained commodity strength driven by geopolitical risk and persistent inflation. Analyzing the historical data is the only way to confirm this timing. We can observe how a sudden, sustained jump in the energy sector's ETF capital allocation historically preceded a rally in global oil futures by several weeks.
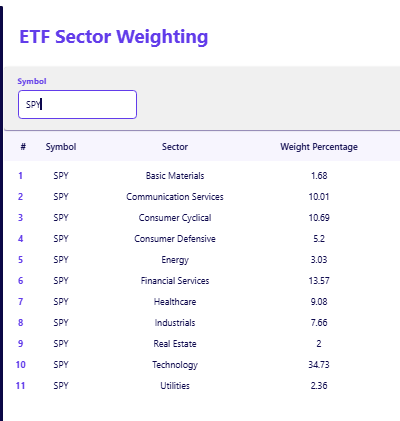
For quantitative leaders, confirming these historical patterns requires granular, systematic data. A quant team can build a proprietary index to compare the month-over-month change in capital allocated to sectors like technology and energy, benchmarking the flow change against subsequent sector performance.
This allows for data-backed validation of the flow signal's predictive accuracy, which is crucial for building systematic rotation models. Access this granular data via the FMP ETF Sector Weighting API.
ETF Holdings Data: Translating Flow Signals to Constituent Risk
The flow signal itself is only the first step. For a CIO or Portfolio Manager, the ultimate action requires understanding which stocks within the ETF will bear the brunt of the buying or selling pressure. This is where ETF holdings data becomes mission-critical, linking macro-level flow to micro-level equity strategy.
Strategic Use Cases for ETF Holdings Data:
- Targeted Alpha Generation: When a significant inflow anomaly is detected in a thematic ETF (e.g., cloud computing), a quant team should immediately analyze the ETF holdings to identify the most heavily weighted, yet perhaps undervalued, constituent stocks. These become high-conviction long targets, capitalizing on the expected price pressure. Programmatic access to the entire stock basket via the FMP ETF Holdings API is essential for automating this screening process.
- Liquidity Risk Assessment: Massive outflows from a concentrated sector ETF pose a severe risk to the ETF's least liquid holdings. Monitoring the holdings data allows a CFO or risk manager to anticipate forced selling, particularly in small- or mid-cap stocks that represent high-percentage positions within the fund.
- Exposure Management: If the primary ETF you track holds another ETF, analyzing the second-level holdings prevents blind exposure. Using the FMP ETF Holdings API ensures accurate, up-to-date portfolio risk profiles by mapping out the full chain of underlying assets.
The Starter and Premium plans offer access to ETF holdings and sector-level flow data for manual monitoring. The Ultimate plan supports bulk or batch data delivery, enabling automated detection of sector inflow anomalies across global ETFs ideal for building quantitative rotation alert systems.
Building a Flow Watchlist: Tactics for Anomaly Detection
To integrate ETF flow signals into a robust, automated investment process, quant researchers and senior portfolio managers need a systematic approach to identifying flow anomalies inflows or outflows that exceed a statistically significant threshold relative to historical norms. Noise, such as daily rebalances or minor tax-loss selling, must be filtered out.
Actionable Steps for Systematic Flow Detection:
- Define Strategic Thresholds: The most powerful signals occur when capital flows exceed a standard deviation above the 90-day average daily flow. Flows below this threshold are likely passive mechanics; those above signal high-conviction institutional movement.
- Focus on Thematic ETFs: Funds focused on highly specific structural themes (e.g., Cybersecurity, Genomics, or Renewable Energy) are extremely sensitive to shifts in long-term capital trends. Their flows are often more predictive of multi-year structural shifts than broader sector funds.
- Net New Assets (NNA) over Volume: For a true signal, track Net New Assets (NNA) rather than just trading volume. NNA reflects capital creation or destruction, not just secondary market trading. Sustained NNA in a specific ETF is the clearest indicator of a structural conviction.
Quant teams can translate this into real-time alerts. If the Financials ETF (XLF) records three consecutive days of NNA above the 3 standard deviation threshold, it warrants an immediate review of exposure to major banking and insurance components. This process moves a firm from reactive to proactive, ensuring that capital allocation decisions are made before the rally gains momentum.
Capital Allocation and Risk Management Through Flow Analysis
The insights derived from ETF flow analysis have direct implications for both strategic capital allocation and enterprise risk management (ERM), catering directly to the priorities of a CIO and CFO.
Flow Signals for Capital Allocation (The CIO's Mandate):
- Proactive Underweighting/Overweighting: Persistent, long-term outflows from a major sector ETF (e.g., Utilities) signal a structural shift in investor preference, perhaps tied to rising interest rates or policy changes. A CIO can proactively reduce exposure, mitigating downside risk before the correction accelerates.
- Relative Value Trades: Contrasting flows between related style factors—for example, persistent inflows into the iShares MSCI USA Value Factor ETF alongside sustained outflows from the Growth Factor ETF highlights a clear strategic shift toward Value factors. This supports a data-driven adjustment to the portfolio's style factor weighting.
Flow Signals for Risk Management (The CFO's Mandate):
- Liquidity Strain Monitoring: Sudden, massive outflows from specific, highly concentrated, or illiquid ETFs can signal a potential liquidity crunch or forced de-risking by a major institutional player. This provides a critical ERM signal, particularly during times of market stress, requiring a review of counterparty risk and internal liquidity buffers.
- Thematic Risk Alignment: Monitoring flows in "Tail Risk" or volatility-linked ETFs (e.g., those tracking the VIX) provides a real-time gauge of institutional anxiety. This informs a CFO's strategy on hedging costs, debt duration, and capital preservation.
The predictive power of flow data extends to real-time asset pricing. A large institutional trade can immediately move a single stock. When an S&P 500 ETF buys a massive block of shares, a quantitative model should capture the instantaneous price impact.
From Flow Data to Forward-Looking Capital Strategy
ETF flow analysis is a sophisticated layer of market intelligence that transcends traditional fundamental analysis. It provides the forward-looking context necessary for executives to navigate an increasingly dynamic market environment. The core insights are clear: where the capital goes, performance will follow.
By shifting focus to real-time ETF flows, finance executives gain a measurable edge. The data reveals institutional conviction, anticipates sector rotation, and provides crucial warnings for liquidity and thematic risks. It enables a proactive stance on capital allocation by highlighting macro trends before they manifest in earnings. Furthermore, quant leaders can leverage these flow signals to refine their methodology for building single-stock estimate and price target models.
Do not follow the noise; follow the money. Your next step in leveraging this predictive data is automation. The FMP ETF Holdings API offers the granular, reliable data necessary to programmatically monitor and detect sector-level flow anomalies across your global watchlist, allowing for the automation of flow-based trading signals.
Frequently Asked Questions
What is the difference between ETF flows and trading volume?
Trading volume is the total number of shares bought and sold, representing secondary market activity. ETF flows (creations/redemptions) represent capital moving into or out of the fund itself, which is a structural change in the fund's total assets and a more reliable signal of new investor conviction.
Which type of ETF flow is most predictive for capital allocation decisions?
Flows in sector-specific (e.g., Financials, Technology) and thematic ETFs (e.g., AI, Water Infrastructure) are often the most predictive. They directly reveal where large capital pools are placing structural bets on macroeconomic or technological shifts.
Can a financial executive use ETF flow data for risk management?
Absolutely. Sudden, sustained outflows from high-yield, high-beta, or highly-leveraged sector ETFs (e.g., leveraged loan funds) are key indicators of a sudden institutional shift toward de-risking, warranting a portfolio-wide review of tail risk exposure and liquidity.
How quickly do ETF flows impact the underlying stock prices in a sector rotation?
The impact can be nearly instantaneous. When Authorized Participants create new ETF shares due to inflows, they must immediately buy the proportional basket of underlying stocks, which can exert real-time price pressure before the broad market even recognizes the fundamental shift.
What is a "flow anomaly" and how can I detect it without manual checks?
A flow anomaly is a daily or weekly capital flow (inflow or outflow) that significantly deviates from the historical average (often defined as 2 standard deviations or more). Quant teams detect this using bulk data APIs to flag flows that exceed pre-set, statistically-validated thresholds.
Does the size of the ETF matter when interpreting ETF flows for risk management?
Yes. The most critical metric is the percentage change in Assets Under Management (AUM). A $50 million outflow from a $500 million ETF (a 10% drop) is a severe risk signal, while the same dollar outflow from a $50 billion ETF is negligible.
Can ETF flows be used as a leading indicator for CFOs concerned with margin optimization?
Yes. Sustained inflows into commodity-related ETFs (e.g., Energy or Agriculture) forecast rising input costs. A CFO can use this advance warning to proactively hedge commodity exposure or adjust pricing strategy to protect gross margins.

Apple’s Slow Shift from China to India: Challenges and Geopolitical Risks
Introduction Apple (NASDAQ: AAPL) has been working to diversify its supply chain, reducing dependence on China due to...

MicroStrategy Incorporated (NASDAQ:MSTR) Earnings Preview and Bitcoin Investment Strategy
MicroStrategy Incorporated (NASDAQ:MSTR) is a prominent business intelligence company known for its software solutions a...

WACC vs ROIC: Evaluating Capital Efficiency and Value Creation
Introduction In corporate finance, assessing how effectively a company utilizes its capital is crucial. Two key metri...