


Market intelligence briefings help research teams start each day with a clear view of what changed, why it changed, and where attention should move next. But in many teams, this process still depends on manual work. Analysts check index performance, scan top movers, read market news, connect the dots, and then prepare updates for portfolio managers, traders, or internal stakeholders.
That workflow creates two problems. First, it takes time. Second, the final briefing often depends on how each analyst reads the same data. One person may focus on index movement, another may focus on stock-specific news, while another may miss a signal because the data lives across multiple sources.
Financial Modeling Prep's MCP Server supports this need by acting as a structured data access layer for market intelligence. Through Claude, enterprise teams can orchestrate market indices, top movers, news, and macro inputs into one connected analytical system instead of reviewing each signal through separate tools or manual checks.
The goal is not to create another market summary. The goal is to enable a continuous market intelligence layer that can classify signals, preserve raw data transparency, and deliver consistent decision support across email, Slack, dashboards, or internal research platforms.
What a Daily Market Briefing System Must Answer
A useful market briefing should do more than report whether the market moved up or down. Research teams need a clear explanation of the session, the drivers behind major moves, and the signals that deserve follow-up.
At a minimum, the system should answer four questions:
- What happened across major market indices?
- Which stocks moved the most?
- Did recent news explain those moves?
- What should analysts monitor next?
This matters because market activity does not always send a clean signal. An index may close higher while only a few large-cap stocks drive the move. A stock may appear in the top gainers list because of strong company news, while another may move sharply without any clear catalyst. These cases need different levels of confidence.
The briefing system should therefore separate raw movement from decision-ready interpretation. It should identify broad market direction, highlight unusual stock movement, connect that movement with available news, and classify the final signal as bullish, bearish, or neutral. This creates a shared interpretation layer, so analysts, portfolio managers, and risk teams evaluate the same market session using consistent evidence and signal logic.
For institutional teams, this creates a consistent starting point. Instead of asking every analyst to scan the market from scratch, the system gives everyone the same structured view of market activity and the same logic for deciding what deserves attention.
FMP Data Inputs Behind the System
A daily market intelligence briefing needs more than one market snapshot. It needs broad market direction, stock-level movement, news context, and macro signals that can be reviewed together. FMP provides these inputs through structured financial datasets that can support a repeatable briefing system.
This reliability layer matters because daily briefings become harder to trust when indices, top movers, news, and macro context come from disconnected or inconsistently timed sources. One source may show market movement, another may show stock-level changes, and another may update news at a different point in the session. A structured FMP data layer helps reduce that gap by giving the briefing system a more consistent foundation for signal classification and review.
This market intelligence system uses three FMP data inputs:
- Market indices: This API provides a directory of stock market indexes across global exchanges. In this briefing system, it helps define the index universe used for market-level tracking.
- Top movers: FMP's market performance data identifies both the strongest gainers and sharpest losers. In this workflow, it helps the briefing focus on stocks with unusual upside or downside movement.
- Stock news: This API provides timely market and company-specific news. In the briefing system, it adds the context needed to explain whether a major stock move has a clear catalyst.
The index input gives the briefing its market-level view. The top movers input adds the stock-level signal layer. The news input helps explain whether price action connects to a clear market or company-specific event.
Together, these datasets allow the briefing system to move from raw market activity to structured interpretation. Instead of checking indices, movers, and news separately, the system combines them into one consistent market intelligence layer. Aligned datasets also reduce interpretation variability because analysts, portfolio managers, and risk teams evaluate market signals from the same evidence base.
Accessing FMP Data via Claude MCP
To run this system inside Claude, we connect Financial Modeling Prep's data layer through its MCP server, which allows Claude to retrieve financial datasets directly without writing manual API requests.
You first need an active FMP API key, which can be generated from your Financial Modeling Prep dashboard. This key is used to authenticate all MCP-based data requests.
Once the API key is available, FMP can be connected in Claude using its remote MCP endpoint:
|
https://financialmodelingprep.com/mcp?apikey=YOUR_FMP_API_KEY |
In Claude, navigate to Settings → Connectors → Add custom connector, and paste this URL into the Remote MCP Server field. After saving, Claude will automatically discover the available FMP tools.
From this point, Claude can retrieve and reason across datasets such as market quotes, top movers, general news, stock-specific news, and treasury rates within one MCP-powered research flow. The MCP layer manages tool selection and data retrieval automatically, allowing multiple datasets to operate as an integrated briefing process rather than separate manual checks.
For this article, that system acts as the foundation for an automated market intelligence briefing. It transforms raw market activity into a structured output that explains index direction, stock-level movement, news-supported catalysts, unexplained moves, signal classification, and analyst follow-up actions.
Traditional Market Briefing vs. MCP-Driven Briefing
In a traditional workflow, market briefing creation starts with manual scanning. An analyst checks index performance, reviews top gainers and losers, opens recent headlines, and then decides which movements deserve attention.
This process works, but it does not scale well. It also creates inconsistency. Two analysts can look at the same market session and produce different briefings because they may select different movers, read different headlines, or apply different judgment thresholds.
An MCP-driven briefing changes the workflow. Instead of manually moving across multiple data sources, the analyst starts with a research objective. FMP's MCP Server then supports a structured flow where market indices, top movers, and news can be retrieved and analyzed together.
The difference is not only speed. The bigger advantage is orchestration. The MCP layer helps convert separate data checks into one connected intelligence system. It reduces the need for manual API chaining, repeated data collection, and static briefing templates that break when market conditions change. This also matters from a financial data infrastructure cost perspective, because fragmented market data processes often create hidden work across engineering, reconciliation, governance, and review.
In practice, this means the briefing can move from raw observations to a structured output. It can separate broad market direction from stock-specific movement, check whether news supports the move, and assign a signal classification with a confidence level.
This is the value of the system. It does not simply summarize market data. It standardizes how market activity turns into a decision-ready briefing.
Raw FMP Data Layer
Before the briefing becomes an insight, the system needs a clean raw data layer. This layer should capture the market activity exactly as it comes from FMP before any interpretation happens.
For this workflow, the raw layer should contain three groups of data.
1. Index-level market data
This shows how major benchmarks moved during the session. It gives the briefing its broad market direction.
A raw index view can include:
- Index name
- Symbol
- Latest price
- Daily change
- Percentage change
This helps the system understand whether the market tone started from broad strength, broad weakness, or mixed index movement.
2. Top mover data
This identifies the stocks that need attention first. The briefing should not scan every stock equally. It should focus on names where price action shows unusual movement.
A raw mover view can include:
- Company name
- Ticker
- Price
- Daily change
- Percentage change
- Volume, if available
This gives the system a short list of stocks that may require explanation.
3. News data
This adds context behind the movement. Price action alone can tell us what changed, but news helps explain why it may have changed.
A raw news view can include:
- Ticker
- Headline
- Published date
- Source
- Summary or article text, if available
- Article URL
This layer matters because the final briefing should not treat every price move the same way. A stock that moves after earnings, guidance, regulatory updates, or analyst commentary carries a stronger signal than a stock that moves without a visible catalyst.
At this stage, the system should avoid interpretation. It should only collect and organize the raw inputs. The next layer uses FMP's MCP Server to connect these datasets and turn them into a structured market briefing.
MCP Orchestration Inside the Briefing System
Once the raw data layer is defined, the next step is orchestration. This is where FMP's MCP Server becomes more valuable than a simple data connection. Instead of only retrieving data, MCP helps coordinate dataset selection, sequencing, and reasoning based on the research objective.
In a static workflow, the analyst or engineering team must decide every API call in advance. They need to define which endpoint to call first, how to pass symbols between steps, how to collect news for selected movers, and how to structure the final output.
With MCP, the workflow can start from the research objective instead.
For this briefing, the objective is simple:
Generate a daily market intelligence briefing using market indices, top movers, and news.
From there, the MCP layer helps Claude select the required FMP tools and move through the workflow in a logical sequence. It can first retrieve market-level data, then identify stocks with strong price movement, and then collect news context for the names that require explanation.
The orchestration flow looks like this:
- Retrieve market index data to understand broad direction.
- Retrieve top movers to identify unusual stock-level activity.
- Retrieve news for selected movers and market themes.
- Align price movement with available news.
- Separate supported signals from unexplained moves.
- Generate a structured briefing with signal classification and confidence.
This matters because market briefing creation is not a single API call. It is a multi-step research process. FMP's MCP Server helps connect those steps without forcing teams to build and maintain custom orchestration logic for every briefing format.
The result is a workflow that can adapt to the market session. If the market shows broad weakness, the briefing can focus on downside drivers. If only a few stocks move sharply, it can focus on stock-specific catalysts. If large moves appear without clear news, it can flag them for analyst review instead of forcing a confident conclusion.
Claude Prompt for Daily Market Intelligence Briefing
After defining the raw data layer and orchestration flow, the next step is to run the briefing request through Claude using the FMP MCP connector. The prompt should give the system a clear research objective, define the required datasets, and force the output into a structured format.
Here is the prompt we can use:
|
Use the Financial Modeling Prep MCP Server to generate a daily market intelligence briefing for the latest available market session. Before writing the briefing, first show: 1. Which FMP datasets or MCP tools you used 2. The sequence in which you used them 3. A compact raw data snapshot from each dataset Use the following data inputs: 1. Major market indices 2. Top stock movers, including gainers and losers 3. Recent market and company-specific news Your task is to create a decision-ready market briefing for an institutional research team. The briefing should include: 1. Market overview - Summarize the overall market direction. - Explain whether the session appears bullish, bearish, neutral, or mixed. 2. Index-level summary - Identify the major indices reviewed. - Explain how each index moved. - Highlight whether market movement was broad-based or concentrated. 3. Top movers - Identify important gainers and losers. - Explain which movers appear most relevant for analyst attention. - Do not list every mover. Focus on names with meaningful price movement or news support. 4. News-linked drivers - Connect major stock or market moves with relevant news where available. - Clearly separate news-supported moves from moves without an obvious catalyst. 5. Signal classification For the overall market and for each important mover, classify the signal as: - Bullish - Bearish - Neutral - Review Required 6. Confidence level Assign a confidence level for each major signal: - High - Medium - Low Base confidence on the alignment between price movement, index direction, and available news. 7. Analyst action layer For each major signal, explain what an analyst should monitor next. Examples: - monitor continuation - review earnings or guidance - check sector-level confirmation - investigate unexplained movement - watch for reversal risk 8. Final briefing format Return the output in a format suitable for email, Slack, or dashboard delivery. Use clear headings. Keep the briefing concise. Avoid unsupported assumptions. If news does not clearly explain a move, say so directly. |
This prompt produces two useful outputs: a raw FMP data transparency layer and the final market briefing. The next section uses that output to show how raw market activity becomes a structured intelligence brief.
MCP Execution Output: Raw Data Transparency Layer
After running the prompt through Claude with FMP's MCP Server connected, the system returned a transparent execution layer before generating the final briefing. This matters in a production research environment because teams need to see which datasets supported the analysis, not only the final market summary.
The system first loaded FMP tool schemas for quotes, market performance, news, and economics. It then retrieved market data for major benchmarks and ETFs, including the S&P 500, Dow Jones Industrial Average, Nasdaq, Russell 2000, VIX, SPY, QQQ, and IWM.
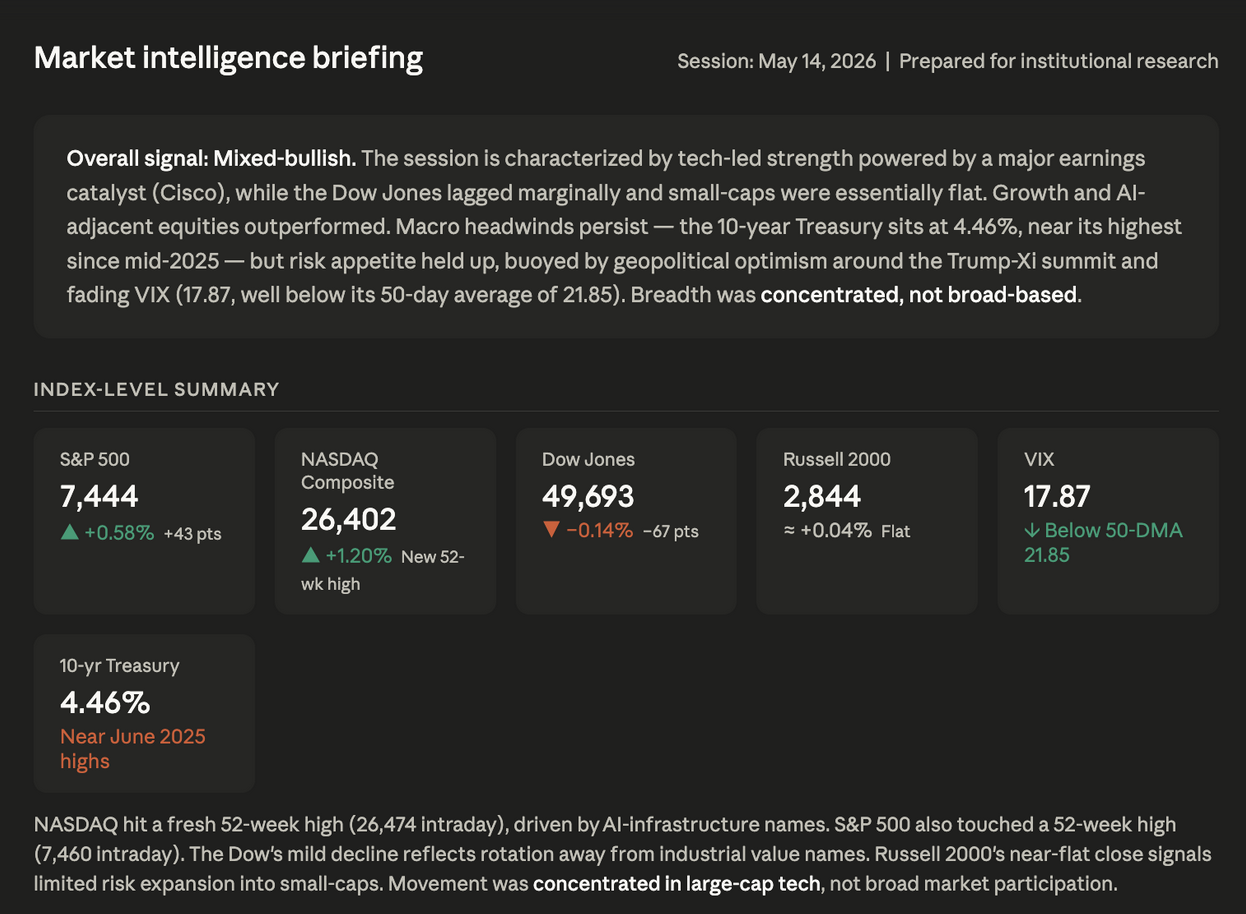
The raw market snapshot showed a mixed but technology-led session. The Nasdaq gained more than 1% and reached a 52-week high, while the S&P 500 also moved higher. The Dow was slightly negative, and the Russell 2000 stayed almost flat. This gave the system an early read that market strength was concentrated rather than broad-based.
The system then retrieved top gainers and losers from FMP's market performance dataset. After filtering for relevance, the key gainers included TSEM, FRVO, MEI, VELO, and REPL, while WIX, REZI, EYE, TLSI, and BTM appeared among the sharpest downside movers.
Next, the system pulled general market news and stock-specific news from FMP. The news layer captured broader themes around the Trump-Xi summit, treasury yield movements, Federal Reserve leadership coverage, energy risk around Hormuz, LinkedIn layoffs, and the Cerebras IPO. It also captured company-specific updates for names such as Cisco, WIX, FRVO, and Alibaba.
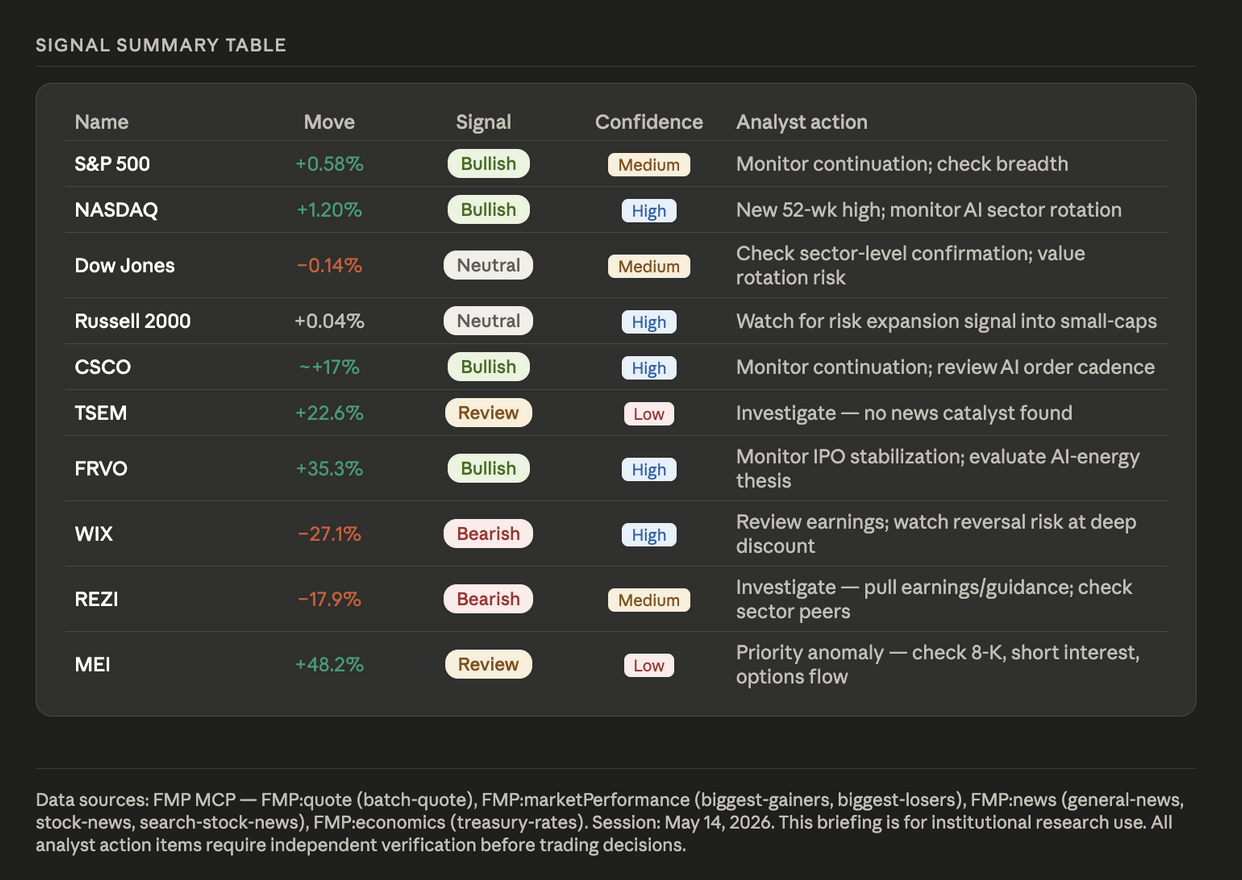
This helped the system separate news-supported moves from unexplained moves. Cisco had a clear earnings-related catalyst, FRVO had IPO-related coverage, and WIX had earnings miss coverage. For TSEM, MEI, and REZI, the available news search did not show a direct catalyst, so those names required further analyst review.
Finally, the system retrieved treasury rate data from FMP's economics dataset. For teams that use rates as part of valuation or risk context, FMP's guide on using interest rates and inflation data in financial models provides useful background. The rate layer added macro context to the briefing and helped analysts evaluate whether long-end yields could affect growth stocks, valuation sentiment, or broader risk appetite.
This raw transparency layer gives the briefing system a stronger evidence base. It shows market direction, stock-level movers, news-supported catalysts, unexplained moves, and macro context before the decision layer applies signal classification and analyst actions.
Decision Layer: Signal Classification and Analyst Actions
The raw execution layer gives the system enough evidence to classify market signals. The decision layer applies one simple rule: a signal becomes stronger when price movement, market direction, and news context point in the same direction. This is especially important because market signals often move at different speeds, a theme FMP explores in its article on signal timing and institutional workflows. When one of those pieces is missing, the system lowers confidence or marks the move for review.
In this run, the broad market signal was mixed-to-bullish with medium confidence. The Nasdaq gained more than 1% and reached a 52-week high, while the S&P 500 also moved higher. However, the Dow was slightly negative, and the Russell 2000 stayed almost flat. That means the session was positive, but not fully broad-based.
For a research team, the action is clear. Analysts should monitor whether strength expands beyond large-cap technology. If Nasdaq leadership continues while small caps and cyclicals remain weak, the briefing should flag concentration risk rather than treat the session as broad market strength.
At the stock level, the strongest signals came from names where price movement had clear news support. Cisco showed a bullish signal with high confidence because the workflow found multiple earnings updates, including beat-and-raise coverage. WIX showed a bearish signal with high confidence because the decline connected to earnings miss coverage.
These are the kinds of moves analysts can prioritize first. The next action for Cisco is to monitor follow-through and check whether the earnings reaction supports broader strength in networking or enterprise technology names. For WIX, analysts should review earnings details, margin commentary, guidance, and potential estimate revisions.
Some movers need a different treatment. FRVO had IPO-related coverage, so the system should not classify the move the same way it would classify a mature stock with earnings or guidance news. The better classification is review required with medium confidence. Analysts should monitor volume, trading stability, and whether the move continues after the initial IPO reaction.
For TSEM, MEI, and REZI, the workflow did not find a direct news catalyst in the available FMP news search. These names should receive a review required signal with low confidence. The system should not force a bullish or bearish explanation when the evidence is incomplete. Analysts can then investigate filings, delayed news, sector flows, liquidity, technical breakouts, or events outside the current news feed.
The treasury rate layer adds macro context. With the 10-year yield at 4.46% and the 30-year yield at 5.03%, analysts should also track whether higher long-end yields start to affect growth stocks, valuation sentiment, or broader risk appetite.
This decision layer makes the briefing useful because it does not treat every market move equally. It separates confirmed signals from incomplete signals, assigns confidence based on evidence alignment, and gives analysts a clear follow-up path.
Systemization: Turning Daily Briefings Into a Continuous Intelligence Layer
The real value of this workflow comes when teams run it consistently. A one-time briefing helps an analyst understand one session. A daily system creates a repeatable intelligence layer that teams can use across research, trading, portfolio monitoring, and risk review.
The workflow can run on a fixed schedule. For example, teams can trigger it after market close to generate an end-of-day briefing, or before the next session to prepare a morning research note. The same structure can also run during the day if teams want intraday monitoring for large movers or breaking news.
This also follows the same principle behind designing a research architecture that scales: keep raw data, logic, and interpretation separated so the workflow remains easier to audit, extend, and reproduce.
A production setup can follow a simple flow:
- Trigger the briefing at a fixed time, such as market close or pre-market.
- Use FMP's MCP Server to retrieve market indices, top movers, news, and macro context.
- Store the raw data snapshot for audit and future comparison.
- Generate the structured briefing with signal classification and confidence.
- Deliver the output through email, Slack, dashboards, or internal research tools.
- Save the final briefing so teams can track how signals changed over time.
This systemized approach gives every stakeholder the same market view. Portfolio managers can read the summary. Analysts can focus on review-required names. Risk teams can track bearish or macro-sensitive signals. Leadership can receive a short version through email or Slack.
It also improves consistency. The briefing uses the same data inputs, the same signal logic, and the same confidence framework each day. That makes the output easier to compare across sessions instead of depending on different analyst styles or manual research habits.
For enterprise teams, this is where FMP's MCP Server becomes more than a data access layer. It supports a repeatable briefing process that can move from raw market activity to structured decision support, then deliver that output wherever teams already work.
Data Quality, Reliability, and Enterprise Use Cases
Once the briefing system runs consistently, data quality becomes an enterprise control layer. The system should not only retrieve index data, mover lists, news context, and macro inputs, but also preserve how those inputs supported each signal classification.
FMP helps reduce that gap by giving teams access to structured financial datasets through one connected infrastructure layer. In this workflow, the same MCP-driven process retrieved market quotes, top movers, company news, general market news, and treasury rates. That consistency matters because the briefing compares multiple signals within the same research flow.
This also improves reproducibility in financial research. A team can save the raw FMP snapshot, the generated briefing, the signal classification, and the confidence level for each run. If someone reviews the briefing later, they can see which data supported the conclusion and why a signal was classified as bullish, bearish, neutral, or review required.
For enterprise teams, this creates several practical use cases:
- Morning research notes for analysts and portfolio managers
- End-of-day market recaps for leadership and investment teams
- Slack alerts for large movers without clear news support
- Risk reviews for bearish signals or macro-sensitive moves
- Dashboard history to track how daily market tone changes over time
The same system can also support team-level consistency. Instead of every analyst writing market notes in a different format, the briefing follows the same structure each day. It uses the same data inputs, the same evidence logic, and the same classification framework.
That makes the output easier to trust, compare, and scale across coverage areas.
Limitations and Where the System Needs Review
An automated briefing system can make daily research faster and more consistent, but it should not remove analyst judgment. Market movement often reflects more than the visible data available at the time of the briefing.
The first limitation is news coverage. A stock can move sharply because of delayed filings, institutional flows, technical breakouts, rumors, or sector rotation. If the available FMP news search does not show a direct catalyst, the system should mark the move as review required instead of forcing an explanation.
The second limitation is timing. Market data, news, and macro indicators can update at different speeds. A briefing generated during the session may look different from one generated after market close. Teams should define the run time clearly, such as pre-market, intraday, or end-of-day.
The third limitation is signal confidence. A bullish or bearish label should not come only from price movement. Confidence should increase only when price action, market direction, and news context support the same conclusion. If those signals conflict, the system should lower confidence.
Finally, the workflow should keep raw data and generated outputs together. This gives analysts an audit trail and makes it easier to review why a signal was classified in a certain way.
These limitations do not weaken the system. They make it more reliable by showing where automation should support analysts and where human review still matters.
Scaling Market Intelligence Across Research Teams
Daily market intelligence becomes more valuable when teams treat it as a continuous decision-support system, not a manual recap exercise. Research teams need a repeatable way to understand what changed, why it changed, which signals carry evidence, and which moves still require analyst review.
FMP's MCP Server supports that shift by connecting market indices, top movers, news, and macro context into one structured analytical layer. Through Claude, teams can use this layer to generate consistent signal classifications, confidence levels, raw data snapshots, and analyst actions without relying on disconnected data checks or static briefing templates.
The result is a trusted market intelligence system that improves repeatability across research teams. It helps preserve transparency, reduce interpretation gaps, compare signals across sessions, and deliver decision-ready insights through email, Slack, dashboards, or internal research systems. Teams that want to scale this market intelligence system across users, delivery channels, and higher data usage can review FMP's pricing plans to choose the right access level.







