Separating Data, Logic, and Interpretation: Designing a Research Architecture That Scales

Mature quantitative research teams treat their pipelines like well-drawn blueprints, with data, processing, and interpretation separated into distinct layers. This separation is not merely an engineering preference — it is a safeguard for reproducibility, audit traceability, and model validation.
In practice, this means keeping raw data ingestion, transformation logic, feature engineering, model computation, and final interpretation in separate modules.
When Research Layers Collapse
Collapsing these layers into a single monolith (for example, embedding data and formulas inside the same spreadsheet or script) does more than create technical fragility — it introduces institutional risk. When data ingestion, transformation logic, and model computation are entangled, it becomes impossible to prove exactly how a result was produced. Reproducibility deteriorates, audit traceability disappears, and model validation becomes ambiguous.
In institutional research environments, this is not a minor engineering inconvenience. If a signal cannot be reconstructed from its original inputs and transformations, the analysis becomes difficult to defend. Decisions derived from that model may still appear correct, but without a verifiable chain from raw data to output, the results are no longer analytically defensible.
Why Modular Design Scales
By contrast, modular design confines complexity within each layer (data, logic, or reporting) and connects them through strict interfaces. This isolation enables scalability and maintainability as teams grow.
Mixing data and algorithms is especially dangerous in finance. In a spreadsheet or tightly coupled script, even a small data update can force a full model rewrite or manual audit. As TDWI analyst Daniel Mintz notes, data tends to be “heavy” while logic is “light,” and separating them “can make a huge impact” on collaboration and governance.
Modern platforms treat raw data as a locked-down resource and expose only managed logic layers for analysis. A disciplined architecture likewise locks in raw inputs (e.g. price history or financial statements) and puts all business rules, feature calculations, and indicators in separate layers that query the data. This prevents ad-hoc edits from corrupting the data source and lets different teams (data engineers, quants, analysts) work in parallel without stepping on each other's toes.
The Peril of Collapsing Layers
When data ingestion, transformation, and interpretation are not separated, research pipelines become brittle.
|
For example, countless teams start by pasting data into Excel, then adding custom formulas or code. Over time this grows into a confusing jumble: version control is impossible, bugs creep in, and nobody knows which version of the “model” is correct. Changes become dangerous - a simple update to a price series might skew an entire signal, or a new calculated field might inadvertently override old logic. In effect, the system has no clear contract: one change propagates everywhere. In small teams this may appear manageable, but the risks escalate quickly in institutional settings. Consider a backtest presented to an investment committee showing strong historical performance. Months later, after a vendor adjusts historical price data for a corporate action, the backtest results shift — yet the research team cannot demonstrate which data version was used in the original calculation. Without a recorded lineage from raw data through transformation logic to model output, the original result cannot be reconstructed. Similar failures emerge during governance reviews. A model risk or compliance team may request the exact signal calculation used to generate a historical research note or investment recommendation. If transformations were embedded in spreadsheets or notebooks rather than controlled layers, the team may discover that the original calculation cannot be reproduced exactly. At that point the issue is no longer debugging convenience — it becomes an audit exposure. Institutional research must be defensible, and defensibility requires a verifiable chain from raw data to final output. |
This challenge shows up in data pipelines as well. Without robust design, organizations “will struggle to ingest, transform, and govern data at scale”. Monolithic SQL scripts or notebooks are notoriously hard to debug and extend. The dbt blog observes that only modular, version-controlled transformations allow data workflows to be “scalable, testable, and collaborative”.
When research pipelines operate as a single engine — pulling raw data, transforming it, and producing results in one step — the system becomes difficult to extend, validate, and audit. Adding new datasets often requires rewriting core logic, and reproducing historical results becomes increasingly uncertain. Separation of concerns is therefore not merely an architectural preference; it is a prerequisite for maintainable, defensible research systems.
Pillars of a Modular Research Pipeline
Effective architecture divides the analytics workflow into clear stages. A typical layered pipeline might look like this:
1. Data Ingestion (Landing Zone)
Collect raw data from primary sources. This could be API calls to market data providers, databases of corporate filings, alternative data streams, etc. The goal is to land data in its original form, without applying business logic yet.
2. Data Transformation & Normalization
Clean the ingested data, normalize formats, correct for corporate actions (splits, dividends, currency conversions), and adjust for biases (e.g. survivorship). This stage can also involve merging multiple sources (e.g. joining prices with corporate action files) and ensuring data quality. Crucially, these operations are documented and version-controlled.
3. Feature Engineering (Logic Layer)
Compute derived features or factors from the cleaned data. For example, calculating financial ratios from income statements, computing technical indicators (RSI, moving averages) from price series, or generating fundamental signals. This layer applies business rules and transforms the standardized data into inputs for models.
4. Model/Analysis Layer
Run the actual quantitative models or analyses - be it a DCF model, statistical test, or machine learning pipeline. This layer consumes the engineered features, trains or computes outputs (scores, forecasts, portfolio weights), and stores the results in a structured way. Model training, backtests, or signal computations happen here, with versioning of code and parameters.
5. Reporting & Interpretation
Finally, assemble outputs into dashboards, reports, or decision frameworks. This is where human interpretation occurs: risk reports, executive summaries, or automated trading signals are produced. By this point, each insight is traceable back through the layers to raw data.
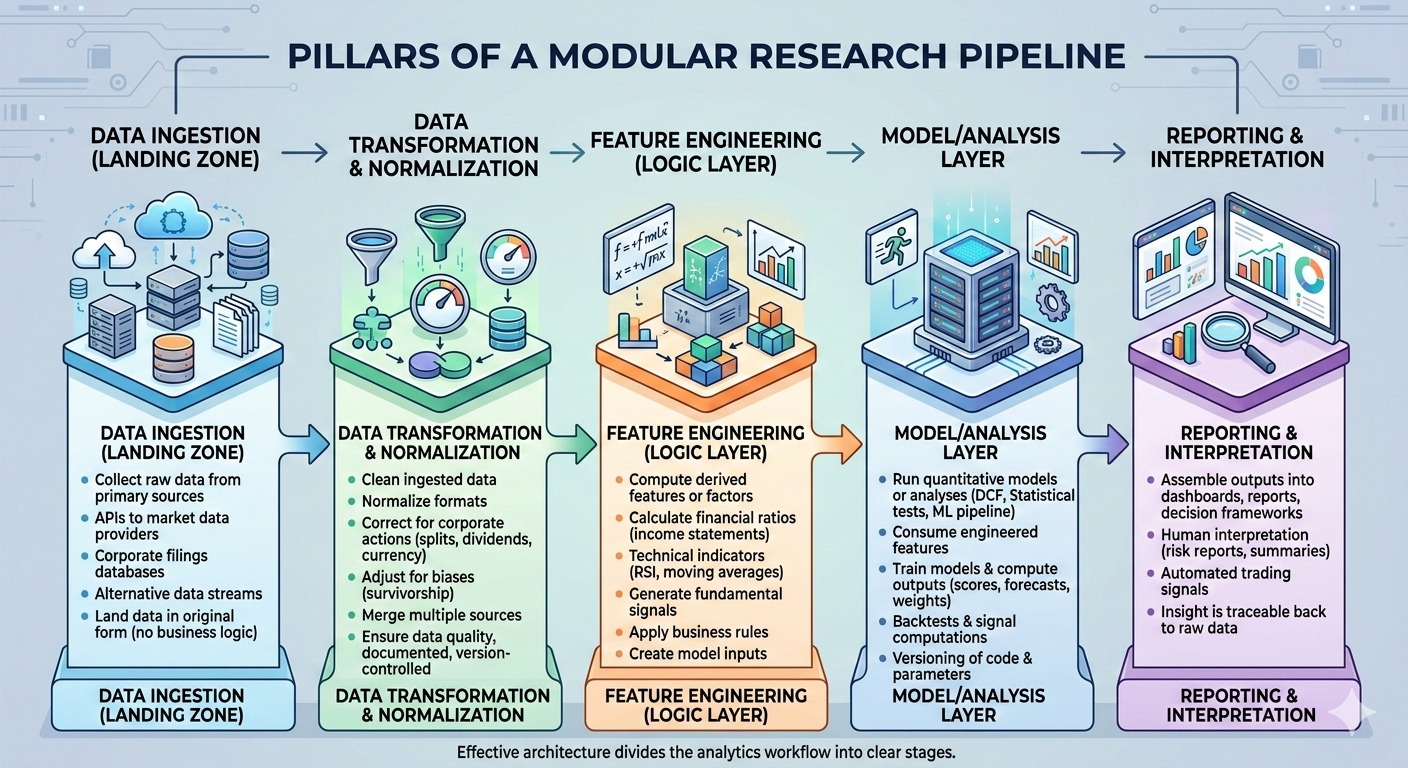
At each boundary between layers, only well-defined interfaces (files, database tables, API calls) are used.
|
Think of it like classical software architecture: you wouldn't write a web page that directly manipulates the database; instead it goes through a service layer. Likewise, in a research system, analysts should rely on data consumers (e.g. database views or APIs) rather than raw files whenever possible. |
This disciplined layering enforces abstraction - higher layers don't need to know how data was cleaned or sourced, only that it meets the expected format.
More importantly, abstraction preserves reproducibility. Because each layer operates on well-defined inputs, analysts can reconstruct historical outputs by replaying the same pipeline against the same data snapshot. Strict boundaries also prevent silent data drift — situations where upstream adjustments unknowingly propagate into models — ensuring that analytical results remain traceable and verifiable over time.
Data Ingestion Layer: FMP as a Reliable Source
In the modular architecture, the data ingestion layer is the foundation. Here we pull in raw data - no screening, no analysis - directly from sources.
In practice, a structured financial data API can serve as the ingestion layer for such a system. Platforms such as Financial Modeling Prep provide programmatic access to financial statements, analyst estimates, historical price series, and market metrics through stable endpoints. Within a modular architecture, these endpoints simply populate the landing zone — supplying raw inputs that downstream layers normalize, transform, and analyze.
Automating Data Ingestion
For example, rather than analysts downloading filings manually, a data engineer might set up a scheduled process that calls FMP's income-statement and balance-sheet endpoints for each ticker. Price series come from FMP's historical-price-eod API. Each of these API calls returns data in a consistent JSON schema. By storing this in a database, downstream layers can query the “raw” tables without worrying about duplication or format changes.
Standardization Across Symbols and Time
Importantly, FMP's data is standardized across symbols and time.
These datasets provide consistent historical pricing and corporate information that can be integrated directly into the ingestion layer. This consistency means that the next layer (transformation) has a predictable payload - no need for per-company ad hoc parsing.
In practice, many teams use FMP alongside existing data sources: as “How Financial Modeling Prep Fits Into Existing Research Workflows” article explains, FMP is designed to slide into your workflow as an additional data source and efficiency booster without replacing tools like Excel or Bloomberg. You can start by pulling one dataset (e.g. ten years of income statements) via FMP instead of manual entry, immediately improving reliability.
Example: Typical Nightly Data Jobs
In short, think of FMP APIs as your official data taps. For example, a quant team might have jobs that nightly fetch:
- Price and volume. Returns end-of-day prices, volumes, and VWAP.
- Financials. Returns the latest quarterly/yearly income statements.
- Estimates. For forward earnings, ratings, and target prices.
- Key metrics. For thematic data.
Maintaining a Stable Data Foundation
By architecting it this way, the ingestion code merely fetches and stores the data. All interpretation is delayed to later layers. The pipeline's “data foundation” stays stable even if new endpoints are added.
Transformation and Feature Layer: Clean, Normalize, and Compute
Once raw data lands in the system, the next layer “enhances” it before modeling. This transformation layer handles all data cleaning, normalization, and preliminary feature generation. For example, raw price data might be adjusted for splits/dividends and aligned to standard timestamps; financial figures might be annualized or currency-adjusted; missing values flagged or interpolated. FMP's financials and market data are already quite clean, but typical transformations include sorting data by date, pivoting tables, or merging streams. The key is to treat this stage as a static process: once defined, it should be re-runnable and testable.
Re-runnability and Institutional Reproducibility
Re-runnability is essential for institutional reproducibility. Transformation pipelines should be version-controlled, transformation logic logged, and raw data stored immutably so that historical datasets can be reconstructed exactly as they existed at the time of analysis. When these controls exist, teams can replay the entire pipeline — from raw ingestion through feature generation — and reproduce any model output with confidence.
The Data Enhancement Layer in Quant Architecture
A well-known quant architecture approach describes this as a Data Enhancement layer: it “cleans and normalizes” raw market data, adjusts for biases, and “transforms it into features usable by models” - while remaining static to preserve reproducibility. In practice, that means keeping scripts or SQL that, say, compute trailing twelve-month ratios from raw statements or generate continuous time series from discrete updates.
Example: A Typical Transformation Pipeline
For instance, one might implement a nightly ETL job that
(a) merges FMP income statements with foreign exchange rates to compute all figures in USD;
(b) joins stock prices with corporate actions to produce adjusted-close series;
(c) computes standard ratios like P/E or ROE and stores them.
Each of these steps is version-controlled so changes are audited.
Modular Transformation Workflows
As the dbt guides emphasize, data transformation should use modular, controlled code. “With dbt, these transformations become modular, version-controlled code,” and in turn “data workflows become more scalable, testable, and collaborative”.
For example, each transformation might be a separate dbt model or script: “normalize currency,” “adjust prices,” “calculate ROIC,” etc. This way, if a data anomaly is found (e.g. a missing price), only that module needs updating.
It's also easier to add new features: to create a new factor (say, a moving-average crossover), you simply add a new transform on top of the cleaned price data, without touching the ingestion logic.
The Feature Factory
Critically, this layer should not produce final signals; it only preps data. One can think of it as a “feature factory.” When designs are properly separated, even someone new to the project can inspect intermediate tables or outputs to understand data lineage. If something looks wrong (e.g. a ratio is unexpectedly negative), engineers fix it at the transformation stage, then rerun downstream models. This prevents “data drift” from silently breaking models. Moreover, keeping it static means that once you reconstruct this step, you can always reproduce any historical calculation - a key requirement for auditing and compliance.
Model and Signal Layer: Independent Experimentation
With features in place, the model layer can consume them. At this point, quants or data scientists build and backtest models using the engineered data.
Running Experiments on Versioned Data
Because upstream processes are versioned, researchers can run experiments without altering the base dataset. In practice this means recording the data snapshot identifier, transformation version, and model configuration used in each run. Logging these elements allows teams to reconstruct exactly which inputs produced a given forecast, backtest, or signal — a critical requirement for model governance and research validation.
Plug-and-Play Model Components
Each model (statistical rule, machine learning algorithm, factor combination, etc.) is treated as a plug-and-play component that only reads from the feature store and writes its outputs to a results database or file.
Enabling Parallel Research
This separation empowers parallel development. Researchers can try new alpha signals or strategies in isolation, confident that they start from the same published data state. If a model needs tweaking (e.g. a parameter change), it doesn't require touching how data was gathered or cleaned.
Separating Model Development and Deployment
Some firms even split model deployment from modeling: models might run on a schedule in an analytics environment, but once validated, their outputs feed into production systems. Regardless, this layer must track versions rigorously. For example, each model run should log the data version and parameters used, so that its results are traceable.
Governance and Traceability
Separation here also aids governance. If an executive report calls for analysis of last quarter, engineers can spin up the exact same pipeline steps for that date range, ensuring consistency between research and reporting.
Ensemble and Signal Aggregation Layers
When teams scale up, it's common to introduce an ensemble or signal aggregation layer between raw models and final output (as seen in some quant architectures). This layer might combine several model scores, weighting them by risk constraints, without touching the raw factors. The end result remains an alpha or forecast, but again, it's produced by orchestration of distinct components, not by one giant script.
Reporting and Interpretation: Structured Insights
Finally, the top layer translates model outputs into actionable insights. This can be a portfolio construction module, an executive dashboard, or even automated trades. Importantly, this interpretation is decoupled from data and logic. Analysts writing narratives or generating alerts rely on the signals and analytics stored by the model layer.
Reporting from Model Outputs
For example, a risk report might pull summary statistics (Sharpe ratio, drawdown) from model outputs, rather than recomputing from raw trades.
Context and Insight Generation
This separation is reminiscent of FMP's Signal Architecture Canvas: inputs (price, fundamentals, technicals) feed through logic to produce clear insights and actions. The difference between a raw alert and a true insight is context and aggregation. By keeping interpretation in its own layer, you ensure the business meaning is always aligned with the latest data and logic. If new regulatory requirements or strategic questions emerge (say, highlighting ESG factors in reports), the team can add those queries on top, without rebuilding the pipeline.
Decision-Ready Outputs
At this stage, the output is mature: charts, factor weights, or reports that can be consumed by decision-makers. Because each layer was strictly defined, confidence in the results is higher.
Traceable Analytical Decisions
For instance, if a stock is flagged as overvalued, risk managers can trace that decision back: “We used RSI from FMP's technical indicators, P/E from FMP's financial ratios, both filtered through our ensemble logic” - and all those steps are recorded.
A Modular Research Workflow
A properly layered research system looks less like a single workflow and more like a conveyor belt of modules:
Raw data is loaded => cleaned => features are computed => models run => insights generated - each step done by a different team or system.
Preserving Institutional Stability
Changes in one module have minimal impact on others. New data sources (e.g. an ESG feed or a new market) plug into the ingestion stage without touching models. Logic updates (e.g. revised factor definitions) go into the transform layer without reengineering how data is fetched. Reports can evolve with new metrics without disturbing underlying code. This modularity preserves institutional stability even as methods and datasets expand.
Embedding FMP in Your Pipeline
Financial Modeling Prep's APIs naturally complement this design. Because FMP provides discrete endpoints (financials, ratios, historical-price-eod, analyst-estimates), it slots into the ingestion layer seamlessly. Analysts can treat each stable endpoint as a data feed.
Using FMP Endpoints as Data Feeds
For example, an automated job might call FMP's Financial Estimates API to pull forward earnings forecasts and store them in a “consensus_estimates” table, independently of the price and fundamentals databases.
Likewise, FMP's Advanced Market Metrics APIs deliver ready-to-use signals like RSI or sector PE ratios, which teams can ingest without building them from scratch.
Integrating FMP into Existing Workflows
Importantly, using FMP doesn't force teams to abandon existing tools. FMP “was built to slide into your workflow as an additional data source”. You can continue using Excel, Python, or trading platforms as before - just point them at the new, reliable data tables instead of manual inputs.
Separating Data, Logic, and Interpretation
In summary, scalable research infrastructure is about decomposing complexity. By keeping raw data ingestion, transformation logic, model computation, and reporting in separate modules, teams avoid the fragility of monolithic analytics. Modern data-engineering wisdom confirms this: layered systems let you isolate distinct concerns and design complexities and manage each with clear interfaces. For institutional quant teams, this translates to fewer surprises, better reproducibility, and more collaborative growth.
FMP's Role in a Layered Research Architecture
Financial Modeling Prep's suite of APIs fits neatly into such an architecture. Its endpoints become the ingestion points for the data layer: price feeds, fundamentals, and advanced metrics.
Using structured API endpoints for ingestion reduces the need for custom data collection pipelines and allows teams to focus engineering effort on transformation logic and model development.
Why Architectural Discipline Determines Research Credibility
In institutional research environments, architectural discipline ultimately determines analytical credibility. When raw data ingestion, transformation logic, modeling, and interpretation are separated into controlled layers, every output becomes reproducible, auditable, and defensible. Analysts can reconstruct historical signals, governance teams can verify model lineage, and institutions can demonstrate exactly how research conclusions were derived. Modular research architecture therefore does more than improve engineering efficiency — it safeguards the reproducibility, audit defensibility, and institutional credibility on which modern quantitative research depends.
FAQ
Why is it important to separate data ingestion from logic?
Mixing raw data and business logic (e.g. in a single spreadsheet or script) creates hidden dependencies. Separating them means data can be locked away until needed and logic can be managed centrally. In practice, this prevents accidental data corruption and makes it easier to update one part without breaking others. Separate ingestion also lets teams bring data under version control and apply quality checks before any modeling.
What risks come from a monolithic, all-in-one pipeline?
Monolithic pipelines tend to be fragile and hard to maintain. A single change - say, a new data source or a formula tweak - can cascade through the entire system. Without clear layers, debugging is difficult: it's unclear which part of the pipeline introduced an error. In finance, this can lead to silent data errors or inconsistent reports, which are unacceptable at institutional scale.
How do FMP APIs help with this architecture?
FMP provides the raw data layer for your pipeline. For example, Financial Statements API instantly delivers years of income statements for any ticker, and its Market Data APIs provide clean historical price series. By using these as inputs, you remove manual data collection from your process. These endpoints are versioned and updated regularly, so your ingestion code has a stable target. Essentially, you map each FMP endpoint to a table in your “landing zone,” then build the rest of your pipeline on top.
Do I have to abandon Excel or Bloomberg to use FMP?
Not at all. FMP is designed to augment, not replace, existing tools. You can keep using Excel models, Bloomberg terminals, or custom code, but feed them FMP data instead of manual inputs. For example, you might use FMP's Excel add-in or simple CSV APIs to update your spreadsheets automatically. Developers can call FMP APIs in Python or R just like any other library. The point is to slide FMP into your workflow as a new data source, so your familiar workflows stay the same while data quality improves.
How does modular design improve reproducibility and stability?
By isolating each step, modular pipelines make it easy to rerun or audit any part of the workflow. If an analyst questions a model's output, engineers can reproduce the data inputs exactly (since the ingestion step is versioned) and trace every transformation. Isolation is essential for institutional stability: it gives confidence that decisions are based on consistent, auditable processes, even as teams and data sources change.

Treasury, trading, liquidity, and equity analysis for investors
Sanzhi writes for FMP with a focus on equity analysis, valuation, market data, and practical investment decision-making. He has worked across financial institutions in treasury, trading, and liquidity roles, bringing hands-on experience in investment analysis, market execution, risk, and strategy. His work focuses on helping readers interpret financial data with clarity, discipline, and an institutional market perspective.
Related




Financial data for every need
Real-time quotes and 30+ years of historical data, including prices, fundamentals, and insider transactions — all accessible via API.
Create Free Account