FMP
How to Pull Clean Historical Stock Price Data Using a Free API
Feb 10, 2026
Building a reliable backtest or market dashboard requires more than just the current price. You need a clean, consistent history of market behavior. However, sourcing this data is often harder than it looks. Web scraping is fragile, and manual downloads from finance portals often result in CSV files with missing dates, inconsistent formatting, or unadjusted prices that skew total return calculations.
Using Free Historical Price API to retrieve historical data solves these structural problems. It provides a standardized feed of Open, High, Low, Close, and Volume (OHLCV) data, ready for ingestion into your database or analysis tool. This approach allows you to focus on building the application logic rather than cleaning timestamp formats or patching gaps in the timeline.
Getting Started: Obtaining Your Free API Key
Before you can pull historical datasets programmatically, you need to establish a connection. This requires an API key, which acts as your unique digital ID for making requests.
Getting set up is straightforward and allows you to test the data immediately:
- Navigate to the Financial Modeling Prep pricing page.
- Locate the Free plan option and click Get my free API key.
- Enter your email to start the registration process—no credit card is required.
- Once verified, your unique API key will be displayed on your dashboard.
This key allows you to make immediate calls to the API. For a more detailed walkthrough on setting up your environment, you can refer to this guide on how to sign up and use a free stock market data API.
Accessing Raw End-of-Day Data
The foundation of most technical analysis and charting applications is raw price history. The Historical Price API delivers this in a clean JSON structure, perfect for populating charts or calculating volatility.
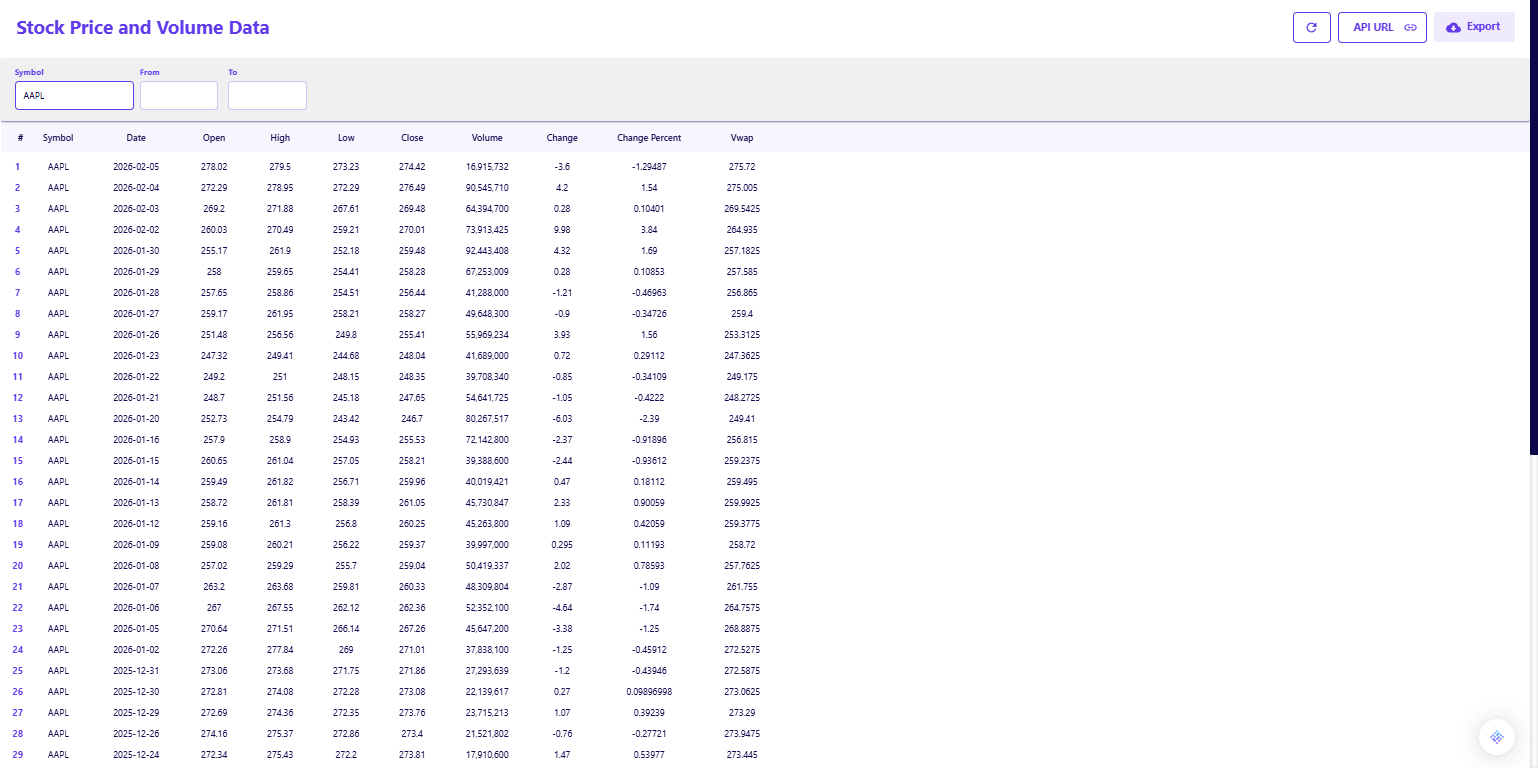
When you request the full history for a ticker like Apple (AAPL), you receive a structured list of daily trading sessions.
- Complete OHLCV: Each entry contains the Open, High, Low, Close, and Volume. For example, on February 5, 2026, you can see the specific trading range and the volume of 16.9 million shares, providing a precise picture of liquidity for that day.
- Change Metrics: The response includes pre-calculated fields for Change and Change Percent, allowing you to quickly identify days with significant volatility without running your own delta calculations.
- VWAP Inclusion: The Volume Weighted Average Price (VWAP) is included in the daily response, offering a benchmark for execution quality. If you are interested in using this metric for trend analysis, you can explore how to use VWAP with hourly stock charts.
Handling Dividends and Splits
A common pitfall in historical data analysis is failing to account for corporate actions. If a stock splits 4-for-1, the raw price drops by 75 percent. If you do not adjust for this, your model will interpret it as a catastrophic crash. Similarly, dividends paid out over time contribute significantly to total return but are not reflected in the raw closing price.
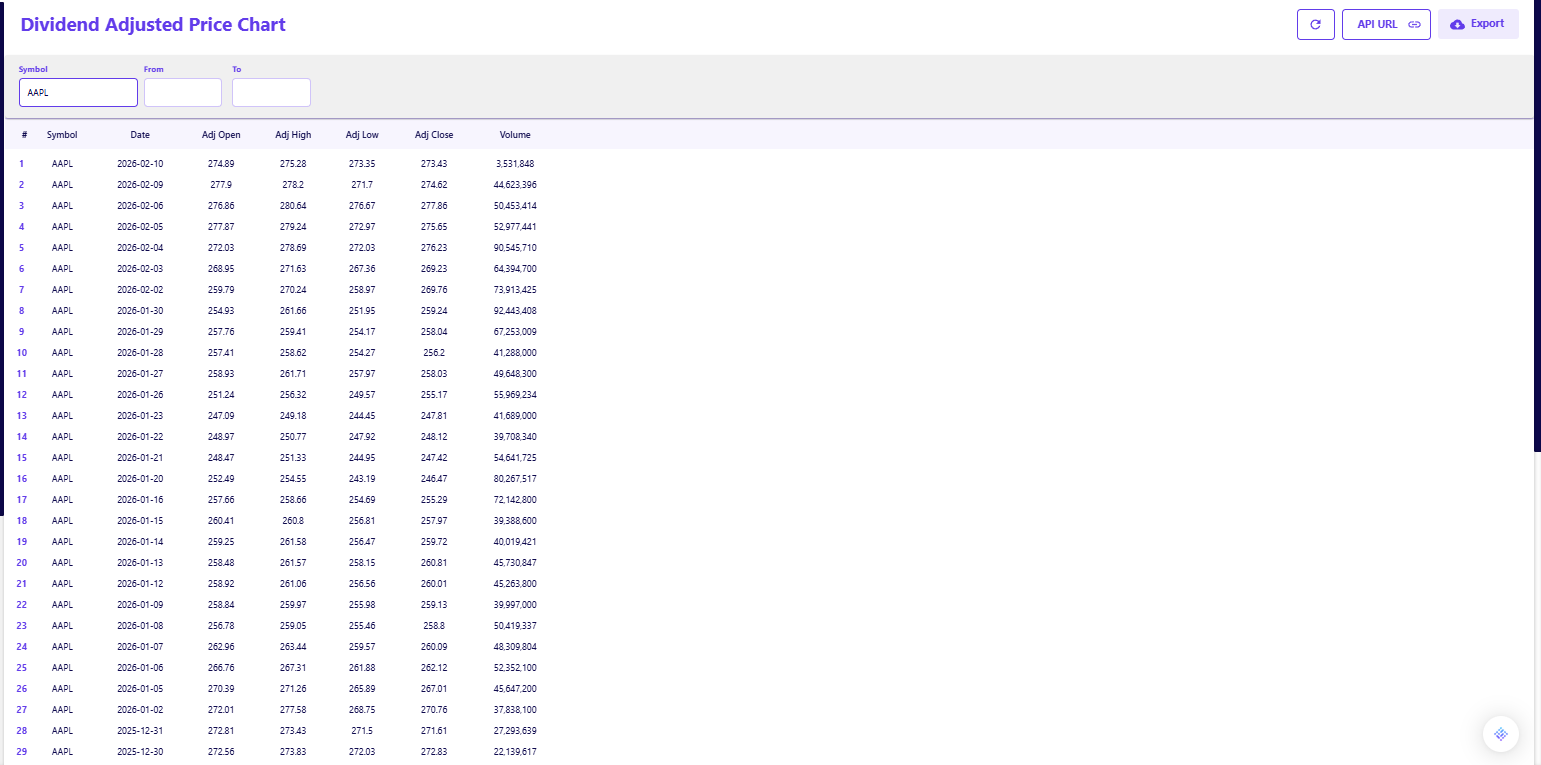
The Dividend Adjusted Historical Price API solves this by normalizing the data.
- Adjusted Close: This endpoint returns an Adj Close field alongside the raw data. This figure works backward to adjust past prices for all splits and dividend distributions, providing a true reflection of the asset's value appreciation over time.
- Consistent Time Series: By using the adjusted feed, you ensure that a chart plotted over five or ten years looks smooth and accurate, rather than having artificial gaps caused by stock splits.
Integrating Historical Data into Your Workflow
The goal of pulling this data is not to create a new silo, but to enhance the tools you already use. You do not need to be a developer to automate your data gathering; the API fits naturally into several common research workflows.
Automating Spreadsheet Updates
If your primary workspace is Excel or Google Sheets, you can eliminate the daily task of downloading CSVs. By using simple web data functions or plugins, you can pull the API response directly into your workbook. This allows your valuation models or backtests to update automatically every time you open the file. To see how this setup works in practice, review this guide on how Financial Modeling Prep fits into existing research workflows without replacing them.
Feeding Intraday Analysis
For those who need higher resolution than daily closes, the same API structure applies to intraday data. If your strategy relies on minute-by-minute price action, you can easily switch endpoints to capture that granularity. You can learn the specifics of that implementation in our guide on how to get stock intraday data with FMP APIs.
Building a Robust Data Foundation
Clean historical data is the bedrock of reliable financial analysis. By using a free API to automate the retrieval of both raw and adjusted prices, you eliminate the risk of manual errors and ensure your models reflect the true history of the market.
This low-risk, automated approach allows you to spend less time scrubbing CSV files and more time interpreting the data.
Frequently Asked Questions
How do I sign up for the free API?
To sign up, visit the documentation page, scroll down to the sign-up box, and insert your email address. No credit card is required.
Is the free plan really free forever?
Yes, the free plan is designed for personal use and allows for 250 requests per day. This gives you ample room to explore endpoints without an expiration date.
Do I need a credit card to get an API key?
No, the free tier is accessible without any payment information. You only need to provide a credit card if you decide to upgrade to a premium plan for higher rate limits or additional datasets.
Is historical data available on the free plan?
Yes, the free tier typically provides access to end-of-day historical data, allowing you to build charts and backtest strategies without a paid subscription.
How far back does the history go?
The API provides extensive history, often covering decades of trading data depending on when the company was listed.
What is the difference between Close and Adj Close?
Close is the raw price at the end of the trading day. Adj Close (Adjusted Close) amends that price to include the value of dividends and stock splits, giving a more accurate view of total return.
Can I get intraday historical data?
Yes, there are specific endpoints for intraday data (e.g., 1-minute, 5-minute intervals), though the depth of history available may vary by tier.
What format is the data in?
The data is returned in JSON format, which is standard for web APIs and easy to parse with Python, JavaScript, or import into Excel.
Do I need to adjust for splits manually?
No, if you use the Dividend Adjusted API, the Adj Close field is already normalized for all historical splits and dividends.

How to Track Stock Symbol Changes and Ticker Renames with a Free API
In financial data pipelines, the most frustrating error is often the simplest: "Symbol Not Found." You know the company ...

How to Map Public Company Identifiers (CIK, ISIN, CUSIP) Using a Free API
Every publicly traded company can be identified in several ways – by its ticker symbol, but also by codes like CIK, ISIN...

