How to Compare Adjusted vs Unadjusted Stock Prices with a Free API

A sudden structural break in a historical price series often points to a corporate action rather than a true market event. When reviewing a long-term timeline, treating a stock split as a nominal price drop will silently corrupt any downstream calculations. Analysts require a mechanism to distinguish between the actual execution prices of the past and the continuous, normalized prices needed for statistical modeling.
Relying on a single price feed obscures the reality of how a company manages its capital structure. Using a free API Stock Price API allows you to pull both adjusted and unadjusted datasets simultaneously for direct comparison. This self-serve approach provides immediate visibility into historical stock splits and dividends, ensuring your foundational data is clean before it enters your models.
Securing Access with a Free API Key
Accessing raw and normalized market data requires a dedicated connection point. You establish this connection through an API key, which serves as your unique identifier for routing requests.
This environment is designed for low-friction testing, allowing you to validate the data structure without procurement delays.
Registration Steps
You can generate your credentials in a few straightforward steps:
- Navigate directly to the Financial Modeling Prep pricing page.
- Select the free tier option and click to get your key.
- Provide a valid email address to complete the registration process without entering payment information.
- Retrieve your newly generated API key from your account dashboard.
Identifying Execution Levels with Unadjusted Data
Unadjusted data provides the exact clearing price of a share at the close of a specific historical trading session. This dataset is typically used for forensic review, such as auditing past trade executions or mapping precise technical support levels that the market physically interacted with.
The Unadjusted Stock Price API delivers this exact historical receipt. Calling this endpoint ensures you are looking at the market exactly as it existed on that specific date.
The Raw Output
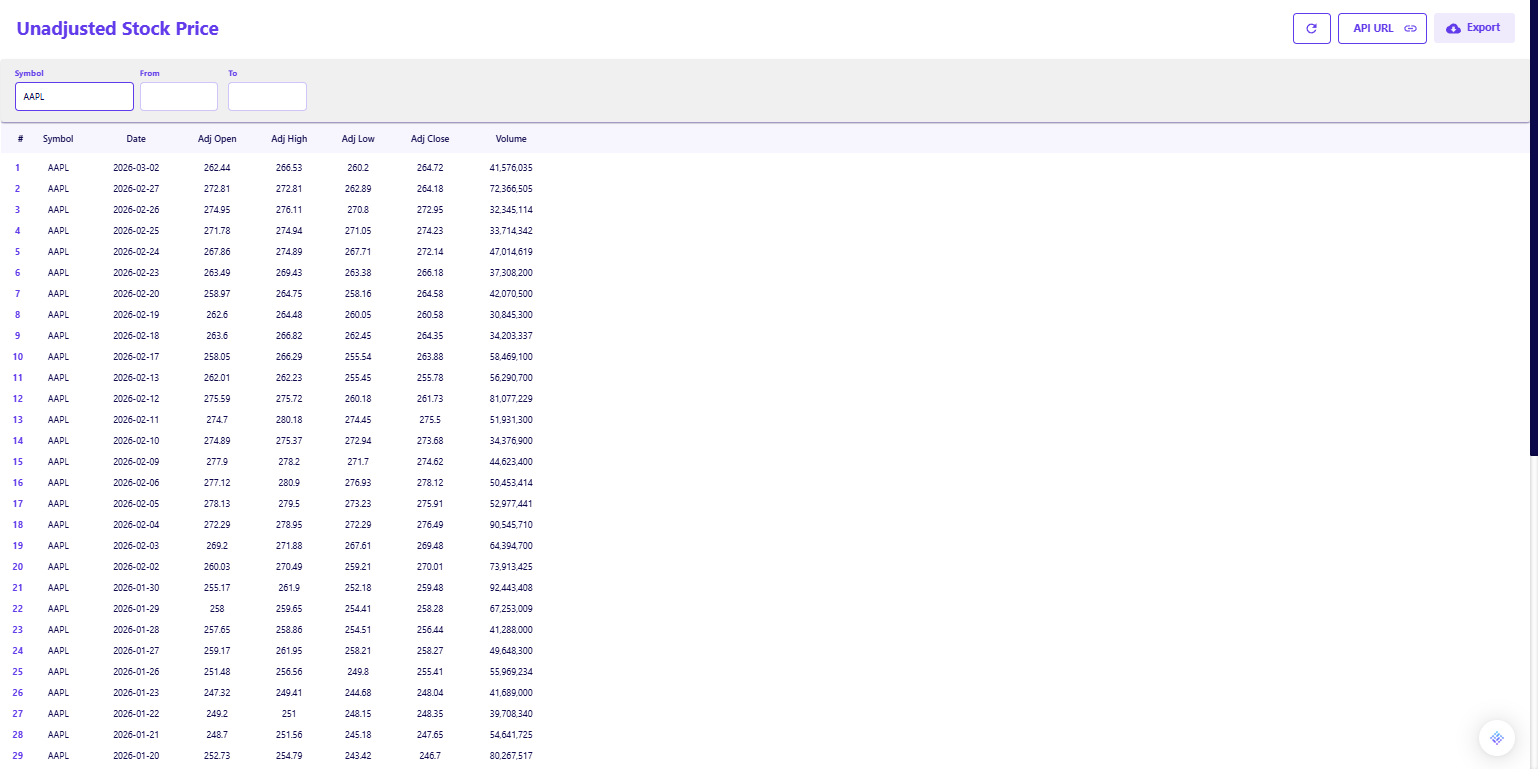
When you query a ticker like Apple, the API returns the nominal values recorded on the exchange.
- The response for March 2, 2026, shows a closing value of 264.72.
- The high and low fields reflect the exact intraday boundaries traded during that specific session.
- The volume field reports 41,576,035 shares, representing the actual physical liquidity available before any subsequent share count adjustments.
Maintaining Continuity with Adjusted Data
Adjusted data retroactively modifies historical prices to account for structural events like stock splits and dividend distributions. This normalization process removes artificial gaps, creating the continuous timeline required for accurate regression analysis and historical volatility calculations.
The Dividend Adjusted Historical Price API provides this smoothed reality. It works backward from the present, adjusting historical records to align with the current capital structure.
The Normalized Output
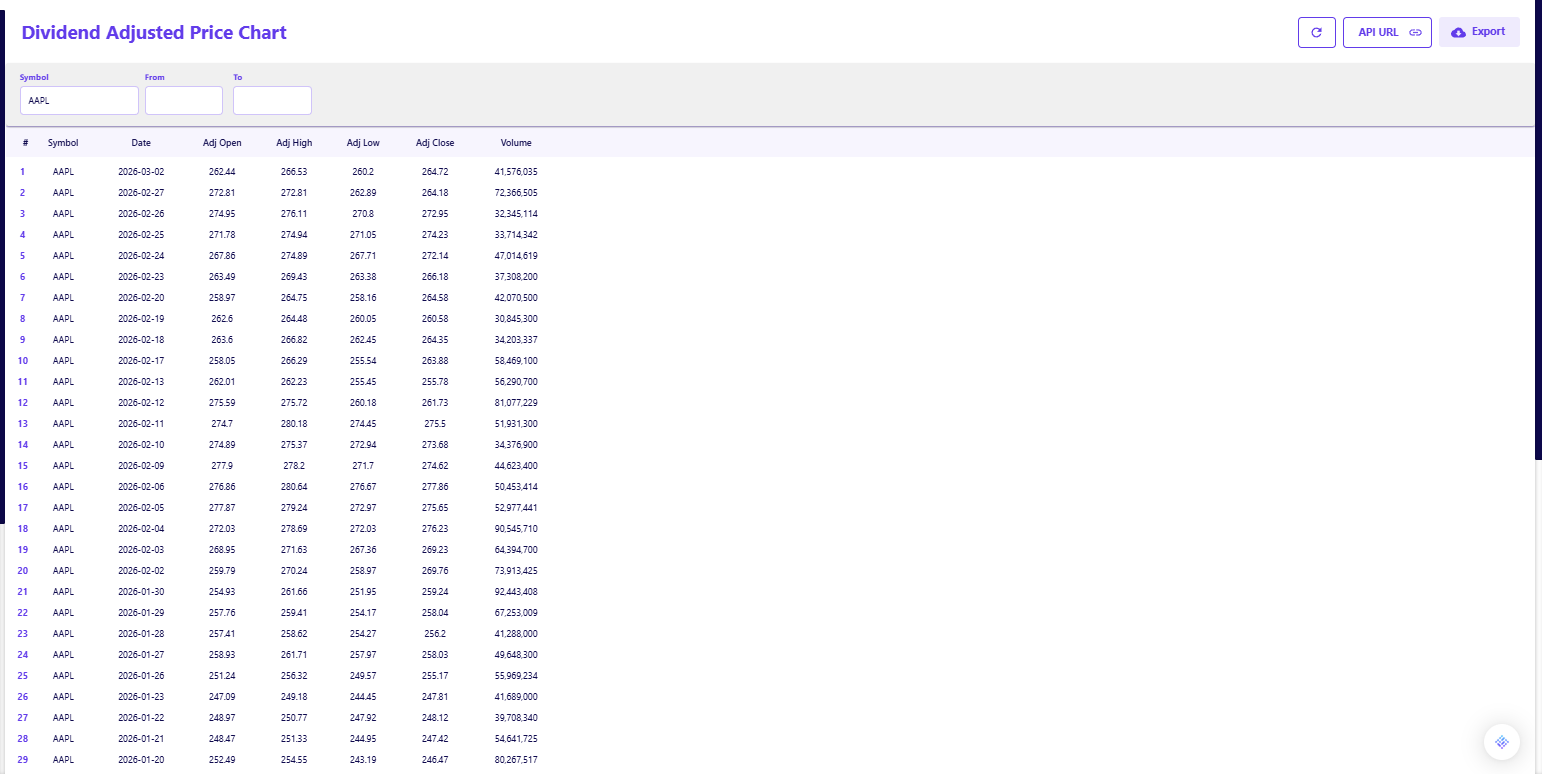
Querying the adjusted endpoint returns a timeline tailored for statistical continuity.
- Looking at the same March 2, 2026 date for Apple, the adjusted close is 264.72.
- The alignment between the adjusted and unadjusted figures on this specific date indicates no structural changes occurred between this session and the time of the query.
- For dates preceding a stock split, this endpoint would report significantly lower historical prices to reflect the split ratio, preventing the visual distortion of a severe price drop.
Validating Data Through Direct Comparison
The most practical application of having both datasets is performing an automated sanity check. Analysts typically pull both feeds to verify the integrity of their historical timelines before trusting the data.
The Sanity Check
You can build a simple validation rule by comparing the two outputs side-by-side.
- If the unadjusted close equals the adjusted close, the capital structure has remained static.
- A divergence between the two datasets instantly flags a historical corporate action.
- Small divergences generally point to dividend distributions, while large factor differences highlight stock splits.
Integrating Price Data into Analyst Workflows
These API endpoints are designed to feed directly into your existing analytical environment. You do not need to build complex software to leverage programmatic data retrieval.
Understanding how to route this data depends heavily on your timeline requirements. Reviewing the core differences in understanding stock market data sets: real-time vs historical vs intraday helps clarify which endpoints belong in your daily dashboards versus your structural models.
Spreadsheet and Script Integration
Both Excel and Python accommodate these data feeds natively.
- Spreadsheet users can route the unadjusted and adjusted JSON outputs into adjacent columns to calculate variance dynamically.
- Python scripts can automate this comparison across an entire watchlist, generating an exception report for any ticker exhibiting unexplained price gaps.
- This automated process guarantees that your valuation models are always referencing the correct baseline numbers.
Securing Data Integrity Before Modeling
Choosing between adjusted and unadjusted data is entirely dependent on the specific requirements of your model. By utilizing a free API to access both structures, you eliminate ambiguity and secure a complete picture of a company's trading history. Establishing this automated validation step ensures your foundational data remains accurate, continuous, and reliable.
Frequently Asked Questions
Is unadjusted price data available on the free tier?
Yes, the free plan includes access to historical price endpoints. You can retrieve both unadjusted and dividend-adjusted data for self-serve evaluation without a paid subscription.
Why is unadjusted data necessary?
Unadjusted data is required to view the exact price a stock traded at in the past. It is crucial for backtesting specific execution logic, reviewing historical option strike prices, or auditing accounting records.
How does the adjusted endpoint handle stock splits?
The adjusted endpoint retroactively divides historical prices by the split ratio. This ensures that a historical 4-for-1 split does not appear as a sudden loss of asset value on your timeline.
Does the adjusted price include dividend distributions?
Yes, the dividend-adjusted feed modifies past prices to reflect the value of cash dividends paid to shareholders. This creates a smoother curve that accurately reflects total asset value over time.
How can I detect corporate actions using these APIs?
You can detect corporate actions by comparing the unadjusted close to the adjusted close on any given historical date. Any mathematical variance between the two figures indicates a split or dividend occurred after that date.
Can I retrieve this data for international exchanges?
The API covers a wide range of global exchanges. However, adjustment methodologies and reporting standards can vary by region, so you should verify local corporate action rules.
Do I need a credit card to generate my API key?
No, the registration process for the free tier requires only an email address. You can generate your key and test the endpoints immediately without entering payment details.

Risk analysis and financial modeling for data-driven market workflows
Parth Sanghvi is a Senior Risk Consultant with experience in financial modeling, valuation, and risk analysis. For FMP, he focuses on translating complex market data and risk models into clear, accessible analysis for developers and investors. His work centers on helping readers understand how institutional-grade financial data applies to real-world workflows and decision-making.
Related




Financial data for every need
Real-time quotes and 30+ years of historical data, including prices, fundamentals, and insider transactions — all accessible via API.
Create Free Account