


Dividend payouts can look stable even when the financial base supporting them starts to weaken. A company may continue paying or increasing dividends while free cash flow tightens, leverage rises, cash balances decline, or debt obligations absorb more financial flexibility.
That creates a payout durability problem. Investors often notice the dividend yield first, but yield does not explain whether the company can keep funding distributions under changing operating conditions. A high yield may reflect market concern, not dividend strength.
This article shows how dividend sustainability monitoring can use Financial Modeling Prep data through Claude MCP to connect dividend history with operating cash flow, free cash flow, payout ratios, debt trends, leverage metrics, and balance sheet strength.
The goal is not to rank dividend stocks or compare yields. It is to create a structured review that helps analysts identify sustainable payouts, stressed distributions, early deterioration signals, and conditions that may require escalation.
Why Dividend Yield Can Hide Balance Sheet Stress
Dividend yield often looks like a simple measure of income opportunity, but it can mislead when viewed alone. A rising yield may come from a falling share price rather than a stronger payout profile.
The same issue applies to dividend growth. A company can keep increasing distributions for several periods even when the underlying cash flow base starts weakening. That creates a lag between visible payout behavior and actual financial durability.
Cash flow is the first pressure point. Operating cash flow shows whether the business can generate internal funding, while free cash flow shows what remains after capital expenditure. If dividends consume most of free cash flow, the payout has less room to absorb weaker demand, higher costs, or capital investment needs.
The balance sheet adds another pressure point. A company can maintain dividends by using cash reserves, raising debt, or reducing financial flexibility. That may support the payout temporarily, but it can also increase leverage strain and reduce the company's ability to protect the dividend during a downturn.
Coverage metrics help separate durable payouts from stressed distributions. When free cash flow coverage weakens, debt rises, or interest coverage compresses, the dividend becomes more dependent on management's willingness to prioritize payouts over balance sheet repair.
That is why dividend sustainability needs more than yield comparison. Analysts need to test whether the payout is supported by cash generation, balance sheet flexibility, leverage capacity, and coverage strength across periods.
For that testing to hold up, the underlying datasets have to be aligned. When dividend records, cash flow statements, debt figures, and balance sheet data are reviewed separately, the relationship between payout commitments and the financial capacity supporting them can get lost. Mismatched periods, incomplete coverage, or inconsistent leverage and cash flow definitions can make a payout look safer or riskier than the reported data actually supports. FMP's structured datasets keep these inputs on the same company record and the same reporting period, which is what makes a consistent payout interpretation possible in the first place.
FMP Data Inputs Behind the System
Testing whether a dividend is durable only works if each part of the analysis is matched with the right financial evidence. Six FMP datasets together form that evidence base, each handling a specific part of the payout review.
The starting point is payout behavior itself. The Dividend History API establishes the distribution pattern, including payment consistency, payout growth, and how management has treated the dividend across periods. This is what shows the commitment side of the analysis, before any judgment about whether that commitment remains financially supportable.
The first durability test sits in cash flow. The Cash Flow Statement API provides operating cash flow, capital expenditure, free cash flow, and dividends paid, which is how Claude checks whether distributions are funded by internal cash generation. Operating cash flow shows whether the core business produces enough cash to cover the payout, and free cash flow shows what remains after capital needs. If dividends consume most of free cash flow, the coverage cushion is thin.
Cash flow coverage alone is not enough, because a payout can remain funded while balance sheet flexibility weakens. The Balance Sheet Statement API supplies cash, total debt, liabilities, and equity, which is what makes it possible to see whether the dividend is being supported by operating strength or by drawing down reserves and adding debt. Rising debt with stable coverage tells a different story than rising debt with declining coverage.
For payout, leverage, liquidity, and coverage reads to stay consistent across companies and quarters, those signals need a standardized reference. The Financial Ratios API provides payout ratios, leverage ratios, liquidity ratios, and coverage indicators in a consistent format. The Key Metrics API adds broader quality indicators such as free cash flow per share and debt-related metrics, which help frame the payout against the company's overall financial position. Together these two datasets are what let a leverage or coverage read from one company compare meaningfully against another.
The final input is direction of travel. The Financial Statement Growth API provides growth trends across the income statement, balance sheet, and cash flow statement, which is how Claude compares dividend growth with cash flow, earnings, and debt movement. A dividend growing faster than free cash flow or slower than debt is what often appears first when payout pressure starts building.
Together, these datasets are what let Claude move from looking at the dividend itself to testing whether the financial base supporting it is strengthening or weakening.
Accessing FMP Data via Claude MCP
To run this system inside Claude, we connect Financial Modeling Prep's data layer through its MCP server, which allows Claude to retrieve financial datasets directly without writing manual API requests.
You first need an active FMP API key, which can be generated from your Financial Modeling Prep dashboard. This key is used to authenticate all MCP-based data requests.
Once the API key is available, FMP can be connected in Claude using its remote MCP endpoint:
|
https://financialmodelingprep.com/mcp?apikey=YOUR_FMP_API_KEY |
In Claude, navigate to Settings → Connectors → Add custom connector, and paste this URL into the Remote MCP Server field. After saving, Claude will automatically discover the available FMP tools.
Once connected, MCP exposes the dividend, cash flow, balance sheet, ratio, and metrics datasets to Claude. From there, Claude selects tools based on the dividend sustainability question, retrieves the data, and sequences the analysis across payout history, free cash flow, debt, leverage, and coverage strength. In practice, that sequence runs:
- Pull dividend history and recent payout activity
- Retrieve operating cash flow, capital expenditure, free cash flow, and dividends paid
- Review cash, total debt, liabilities, and balance sheet flexibility
- Compare payout ratios, leverage metrics, and coverage indicators
- Identify whether the dividend is funded by free cash flow or by drawing down balance sheet capacity
- Classify the payout as sustainable, watchlist, stressed, or escalation risk
The value is orchestrated payout durability analysis. Instead of manually pulling dividend records, joining cash flow data, checking leverage movement, and stitching the evidence together, Claude coordinates the full review within one analytical pass and returns a classified output ready for analyst review.
Building the Dividend Sustainability Surveillance Framework
A dividend sustainability review should not treat a payout as safe only because the company has maintained it historically. The payout needs to be tested against cash flow coverage, leverage strain, debt movement, and balance sheet flexibility.
For this article, the review covers six areas of payout durability.
Payout Commitment Layer
The first area is the dividend itself: payment history, payout consistency, and dividend growth pattern. This shows what the company has committed to shareholders. A long payment record can indicate management's willingness to protect the dividend, but it does not prove future distributions remain financially supportable. Dividend history is useful, but it should be reviewed alongside cash flow durability, balance sheet flexibility, and management's broader capital allocation priorities.
Cash Flow Coverage Layer
The next test compares dividends paid with operating cash flow and free cash flow. A dividend covered by free cash flow has stronger support, because distributions are funded after operating needs and capital expenditure. If free cash flow weakens while dividends remain stable or rise, that is a coverage deterioration signal worth flagging.
Balance Sheet Flexibility Layer
A payout that is fundable today can still be drawing down balance sheet flexibility. This review checks cash balances, total debt, current liabilities, and debt movement across periods. If the payout continues while cash declines or debt rises, the question becomes whether distributions are starting to rely on balance sheet capacity rather than operating strength.
Leverage Strain Layer
Leverage adds its own check. A company can maintain dividends while debt expands, but the durability picture changes if debt grows faster than cash flow or interest coverage compresses. Rising leverage does not automatically mean the dividend is stressed. It means flexibility is narrowing, which makes the payout more exposed to operating shocks, refinancing pressure, or capital allocation changes. The interpretation depends on how cash flow, coverage, and refinancing needs move alongside the debt increase.
Deterioration Detection Layer
The early-warning piece looks for stress patterns before a dividend cut becomes obvious. The signals worth tracking are the ones tied directly to payout support: declining free cash flow against stable or rising dividends, expanding payout ratios, weaker operating cash flow, higher debt without matching cash generation, falling cash balances, lower interest coverage, and capital expenditure cycles that compete with shareholder distributions. Each of these matters because it points to where the financial base supporting the payout is thinning, not because it indicates general financial distress.
Escalation Classification Layer
The evidence is then organized into a payout durability read using four categories:
- Sustainable Payout: Dividends are supported by free cash flow, stable leverage, and adequate balance sheet flexibility.
- Watchlist Payout: The payout remains fundable, but one or two support indicators have started to weaken.
- Stressed Distribution: Dividend payments continue while free cash flow coverage, leverage, or liquidity trends deteriorate.
- High-Risk Payout: The payout appears dependent on debt, cash drawdowns, or weakening financial flexibility.
These categories are designed to support analyst review, not to act as automated verdicts. The classification narrows the question for the analyst, but the final read still depends on sector context, capital plans, and prior period trends that no single review captures fully.
Running the Claude MCP Prompt
For this article, Verizon provides a useful test case because dividend sustainability depends on more than the dividend payment itself. The company operates in a capital-intensive sector, carries meaningful debt, and needs steady operating cash flow to support both network investment and shareholder distributions.
A basic dividend review would stop at dividend yield or payout history. This prompt asks Claude to test the payout against cash flow coverage, free cash flow durability, leverage movement, debt trends, liquidity, and coverage strength.
To keep the analysis focused, the prompt asks Claude to produce a compact payout durability review rather than a broad company report. This helps the system concentrate on the evidence that matters most for dividend surveillance: whether distributions are funded by internal cash generation, supported by the balance sheet, and protected under changing leverage conditions.
|
Use Financial Modeling Prep through MCP to evaluate dividend sustainability risk for Verizon (VZ). Analyze the most recent annual or quarterly periods available through FMP. Use multi-period data where available. Retrieve and compare the following data through FMP: 1. Dividend history and recent dividend payments 2. Dividends paid from the cash flow statement 3. Operating cash flow 4. Capital expenditure 5. Free cash flow 6. Cash and short-term investments 7. Total debt and debt trends 8. Payout ratios 9. Leverage metrics 10. Coverage metrics where available Do not create a generic company summary. Do not rank the dividend or compare dividend yield against peers. Build a compact dividend sustainability review with the following sections: A. Financial Statement Scope - Company - Periods reviewed - FMP tools or datasets used - Financial statements retrieved B. Dividend Sustainability Findings For each key finding, provide: - Metric or review area - What changed - Why it matters - Whether it supports or weakens payout durability - Analyst interpretation C. Dividend Sustainability Stress Matrix Create a compact matrix with these columns: - Test area - Evidence - Interpretation - Payout durability impact - Review priority D. Final Dividend Sustainability Classification Classify the payout into one of the following: - Sustainable Payout - Watchlist Payout - Stressed Distribution - High-Risk Payout Escalation Explain the classification using cash flow coverage, balance sheet flexibility, leverage movement, and deterioration signals. Keep the full response under 800 words. Avoid long tables. Avoid a long research memo. Use compact bullets only where needed. |
After running the prompt, Claude retrieved Verizon's dividend history, annual cash flow statements, balance sheet data, and key metrics through FMP. The review covered FY2021 through FY2025 and included dividend declarations through Q2 2026.
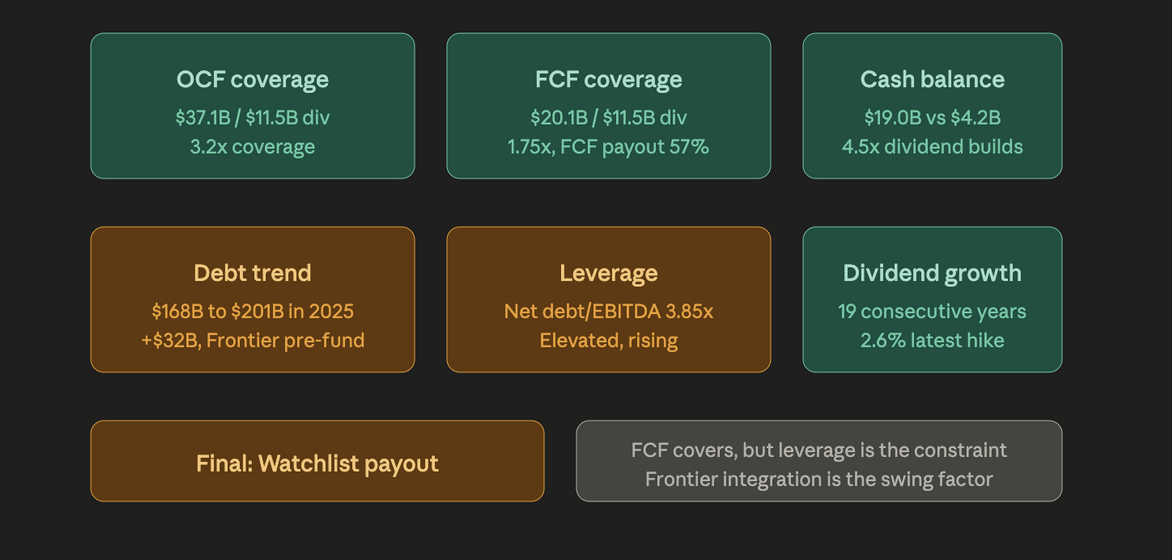
The output compared dividend payments with operating cash flow and free cash flow, then tested that coverage against debt movement, cash balance changes, leverage pressure, and payout growth. This gave the review a balance sheet stress lens rather than a simple dividend-history view.
The analysis classified Verizon's dividend as a Watchlist Payout. The payout remained covered by operating cash flow and free cash flow, but rising debt and elevated leverage reduced the company's balance sheet flexibility. The next section interprets those findings and explains why the payout is fundable today, but still requires closer monitoring.
Interpreting the Claude Output
In the run referenced here, Claude classified Verizon's dividend as a Watchlist Payout. The classification did not come from weak dividend coverage. It came from the gap between strong cash flow support and rising balance sheet pressure.
That distinction matters for payout durability review. A dividend can remain fundable today while still losing financial flexibility. In Verizon's case, Claude's output reported that the payout was covered by operating cash flow and free cash flow, but that the company's debt load and leverage profile required closer monitoring.
Cash Flow Coverage Still Supports the Dividend
The strongest support came from operating cash flow. Per Claude's retrieved output, Verizon generated approximately $37.1 billion in operating cash flow in FY2025 against roughly $11.5 billion in dividends paid, which works out to about 3.2x operating cash flow coverage.
That level of coverage does not point to an immediate payout problem. It shows that Verizon's core business still generates enough internal cash to fund dividends before considering debt pressure or balance sheet flexibility.
Free cash flow coverage was tighter but still adequate. Claude's output reported approximately $20.1 billion in free cash flow against the same $11.5 billion in dividends, implying roughly 1.75x coverage and a free cash flow payout ratio close to 57 percent.
This supports the payout, but it also shows why free cash flow matters more than operating cash flow alone. Verizon still needs to fund capital expenditure before dividends become truly distributable cash.
Leverage Creates the Watchlist Condition
The main concern came from debt and leverage. Per Claude's output, Verizon's total debt was reported in the range of $144 billion at the end of 2024 and around $158 billion at the end of 2025, drawing on the company's 2025 reporting.
That movement changes the payout interpretation. The dividend may be covered by cash flow, but balance sheet flexibility has weakened. If leverage keeps rising, management has less room to protect the payout during softer operating periods, higher refinancing costs, or integration-related spending.
Claude also flagged leverage as elevated under the metrics retrieved through FMP. The exact ratio should be interpreted carefully because telecom leverage can vary depending on whether the analyst uses total debt, net debt, unsecured debt, adjusted EBITDA, or reported EBITDA. This is why capital structure ratios matter in payout analysis: the same dividend can look durable or risky depending on how much financial leverage sits behind it.
This does not push Verizon into a high-risk classification. It creates a watchlist condition because the payout depends on continued cash flow stability and a clear deleveraging path.
Cash Balance Needs Careful Interpretation
At first glance, Verizon's cash balance looked stronger. Per Claude's output, cash and cash equivalents were reported to have risen materially at the end of 2025, well above the prior year-end level.
The review did not treat this as pure dividend support. The cash increase appeared to be tied partly to financing activity around the Frontier acquisition. Verizon's reporting indicated that the year-end 2025 cash balance included proceeds from notes issued to fund the acquisition, which closed in early 2026. In that context, the cash balance should not be viewed as a fully discretionary dividend buffer.
This is exactly why payout review needs balance sheet interpretation. A larger cash balance can look supportive, but the source and intended use of that cash determine whether it actually improves dividend flexibility. The same logic applies across payout analysis: reported strength needs to be tested against the source, timing, and intended use of the underlying cash.
Dividend Growth Remains Disciplined
Verizon's payout pattern remained supportive. Claude's output noted that the company continued its dividend increase streak, with recent annual increases staying modest.
That matters because disciplined dividend growth reduces pressure on free cash flow. A company raising payouts aggressively while leverage rises would move closer to a stressed distribution profile. Verizon's modest increases suggest management is still balancing shareholder returns with balance sheet repair, which is one of the reasons the payout fits a watchlist read rather than a stressed one.
Final Dividend Sustainability Classification
The Watchlist Payout classification fits the evidence Claude pulled. Verizon's dividend remains funded by operating cash flow and free cash flow, so the payout does not currently look stressed.
The concern sits in balance sheet flexibility. Rising debt, elevated leverage, and acquisition-related financing reduce the margin for error. If leverage continues rising without a visible deleveraging path, the payout could move from watchlist to stressed distribution. These are the kinds of balance sheet stress signals that matter when dividend coverage still looks acceptable but pressure starts building underneath.
That is the value of running dividends through a structured review. It does not treat the payout as safe only because it is covered today. It checks whether the company can keep funding the dividend while debt, leverage, cash needs, and operating conditions change.
Scaling Payout Durability Review Across Coverage
The same dividend sustainability logic can run across a defined dividend-paying coverage universe each quarter. Instead of reviewing payout risk company by company, analysts can apply the same stress checks across sectors, issuers, and reporting periods within the scope they actually cover.
The review follows a consistent sequence. First, dividend history and recent payout activity are pulled for each company in scope. Then dividends paid are compared with operating cash flow, free cash flow, capital expenditure, cash balances, total debt, leverage metrics, and coverage indicators. The output applies the same four classifications across the universe, so a company in telecom can be compared against one in utilities on the same durability questions.
That consistency is where the analytical value sits. Every company gets tested against the same core questions: Is the dividend covered by free cash flow? Is leverage rising? Is debt growth funding shareholder distributions? Is cash flexibility improving or weakening? Are coverage metrics moving toward an escalation threshold?
For enterprise teams, this reduces review gaps. Telecom, utility, consumer staple, and industrial issuers each require sector-specific judgment, but the first read on payout durability stays consistent. Analysts can then focus their time on companies where coverage is weakening, leverage strain is building, or balance sheet flexibility is starting to narrow.
The output also supports a payout monitoring list. Companies with adequate current coverage but rising debt or weaker free cash flow can move into monitoring. Companies with declining cash coverage and expanding leverage move into stressed distribution review. The watchlist is built from the same evidence that drives the classification, not from a separate process.
As coverage expands from one company to a broader watchlist, sector group, or dividend-paying universe, teams need access levels that match their dataset, usage, and refresh requirements. FMP's pricing plans can be reviewed in that context.
The main value is consistency. A repeatable approach to payout durability helps teams identify dividend risk earlier, compare deterioration patterns across companies, and route the right names for analyst review before payout stress becomes visible through yield alone.
Where Dividend Sustainability Signals Need Analyst Review
Dividend sustainability analysis can identify early stress, but it cannot treat any single metric as a final signal. A payout may look risky in one period and still remain fundable if cash flow normalizes, capital expenditure falls, or management reduces debt quickly.
Free cash flow is one example. A temporary capex cycle can make dividend coverage look weaker than the underlying business. This matters for capital-intensive sectors, where investment timing can distort free cash flow for a few quarters or even a full year.
Debt trends also need interpretation. Rising debt may signal balance sheet strain, but it may also reflect acquisition financing, spectrum purchases, infrastructure investment, or refinancing activity. Analysts need to separate debt used to support long-term business capacity from debt used to sustain shareholder distributions.
Coverage thresholds can also vary by industry. Telecom, utilities, REITs, banks, and industrial companies operate with different balance sheet structures. A leverage level that looks high for one sector may be normal for another.
Dividend policy adds another limitation. Boards may maintain a payout despite weaker ratios if they view the pressure as temporary. They may also cut or slow dividend growth even when current coverage looks acceptable, especially if debt reduction becomes a higher priority.
The system works best as a payout surveillance layer. It helps analysts detect weakening coverage, leverage strain, and balance sheet pressure earlier, but it should not predict dividend cuts with certainty. Its role is to identify which payouts remain durable, which need monitoring, and which require deeper review.
From Dividend Yield to Payout Durability Intelligence
Dividend yield becomes more useful when analysts can test the financial support behind it. The visible payout shows what the company distributes, but cash flow coverage, leverage movement, debt trends, and balance sheet flexibility show whether that distribution can remain durable.
Using FMP data through Claude MCP, analysts can connect these signals into one payout durability review. FMP provides the dividend, cash flow, balance sheet, and metric data. MCP coordinates access across those datasets. Claude organizes the evidence into a sustainability classification that can be reviewed across periods.
The Verizon example shows why this matters. The dividend remained covered by operating cash flow and free cash flow, but rising debt and elevated leverage shifted the classification to Watchlist Payout. That distinction helps analysts avoid two common reading errors: assuming a covered dividend is automatically safe, or treating leverage pressure as an immediate payout crisis.
A structured approach to dividend sustainability gives research and risk teams a repeatable way to monitor payout durability across companies. It identifies which distributions remain financially supported, which need closer tracking, and which need to be escalated for deeper review when cash flow weakens or balance sheet stress continues to build.







