Build a Dividend Coverage Stress Checker

Dividend-paying companies are often evaluated using yield, but yield alone does not indicate whether a payout is sustainable. A high yield may reflect strong cash generation, or it may signal that the company is distributing more than it can comfortably support. Without examining the underlying financial capacity, dividend signals can be misleading. For example, a company offering a 7% dividend yield may appear attractive at first glance, but if its free cash flow is declining, the payout may not be sustainable. In contrast, a company with a lower yield but consistently strong cash flow coverage may offer more reliable long-term returns. This contrast highlights why yield alone is not sufficient to evaluate dividend strength.
A more reliable approach is to evaluate dividend coverage using cash flow and earnings. This allows us to assess whether a company funds its dividends from internally generated cash or relies on balance sheet flexibility. In practice, analysts focus on operating cash flow, free cash flow, and net income to determine whether dividend commitments remain stable under different conditions.
In this article, we build a Dividend Coverage Stress Checker using Financial Modeling Prep APIs and Python. The framework uses cash flow data to construct coverage ratios and classify dividend sustainability into actionable categories such as healthy, watchlist, or stressed. We will apply this workflow to Microsoft as a case study to demonstrate how the signal behaves in a real-world setting.
Financial Modeling Prep APIs Used
To build the dividend coverage stress checker, we rely on cash flow data. This dataset provides both free cash flow and dividend payments, which are sufficient to evaluate dividend sustainability using actual cash movements.
Cash Flow Statement API: This endpoint returns detailed cash flow data, including operating cash flow, capital expenditures, free cash flow, and dividend payments. In this article, it is used to extract free cash flow and common dividends paid to build the dividend coverage ratio.
How to Get Your API Key
To access Financial Modeling Prep's APIs, you need a valid API key.
Create an account using the official registration page.
After registration, your API key will be available in your dashboard. Replace "YOUR_API_KEY" in the code examples below with your personal key to authenticate requests.
Defining the Dividend Coverage Stress Framework
The goal of this framework is to evaluate whether a company's dividend is supported by its cash generation rather than relying on payout ratios alone. While payout ratios provide a view based on earnings, they may not fully capture the company's ability to fund dividends under varying cash conditions.
To address this, we compare total dividends paid with free cash flow. Free cash flow represents the cash available after capital expenditures, making it the most relevant measure for assessing dividend sustainability, since capital expenditures are unavoidable cash obligations that directly reduce the funds available for dividend payments. By analyzing how much of this cash is consumed by dividends, the framework identifies whether payouts remain comfortably supported or begin to show signs of stress.
Building the Dividend Coverage Stress Checker
We now translate the framework into a practical workflow using cash flow data. The objective is to measure whether dividend payouts are supported by free cash flow and to identify periods where coverage begins to weaken.
The implementation follows a simple sequence. We first retrieve cash flow data, extract free cash flow and dividend payments, and then compute a coverage ratio that reflects how much cash remains after dividends. This step-by-step approach ensures that the final signal is directly grounded in actual cash movements rather than derived assumptions.
Step 1: Retrieve Cash Flow Data
We begin by retrieving cash flow data for the selected company. This dataset provides both free cash flow and dividend payments, which are required to evaluate dividend coverage using actual cash flows.
|
import requests import pandas as pd API_KEY = "YOUR_API_KEY" symbol = "MSFT" url = f"https://financialmodelingprep.com/stable/cash-flow-statement?symbol={symbol}&apikey={API_KEY}" data = requests.get(url).json() df = pd.DataFrame(data) # Select required columns df = df[['fiscalYear', 'freeCashFlow', 'commonDividendsPaid']] # Sort by year (latest first) df = df.sort_values(by='fiscalYear', ascending=False) df.head() |
This dataset contains the two key inputs required for the analysis: free cash flow and dividend payments, which will be used to construct the dividend coverage ratio.
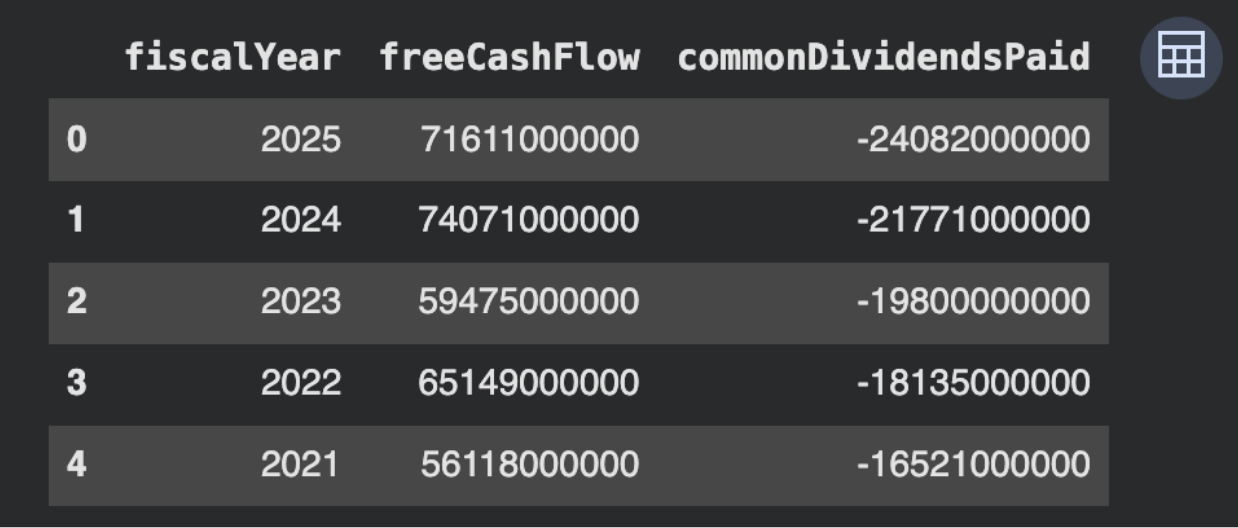
The dataset shows strong free cash flow across all years, with some fluctuations over time. Dividend payments are consistently lower in comparison, indicating that payouts remain supported by internal cash generation. Since commonDividendsPaid is recorded as a negative value—standard for cash flow statements where outflows are represented as negatives—it is converted to absolute terms for analysis. These fields provide the key inputs required to compute dividend coverage in the next step.
Step 2: Compute Dividend Coverage Ratio
With free cash flow and dividend payments available, we now compute the dividend coverage ratio. This ratio measures how many times free cash flow can cover dividend payouts, providing a direct view of sustainability.
|
# Convert dividends to positive values for calculation df['dividends_paid_abs'] = df['commonDividendsPaid'].abs() # Compute coverage ratio df['dividend_coverage_ratio'] = df['freeCashFlow'] / df['dividends_paid_abs'] # Select relevant columns coverage_df = df[['fiscalYear', 'freeCashFlow', 'dividends_paid_abs', 'dividend_coverage_ratio']] coverage_df.head() |
To interpret the dividend coverage ratio:
- Above 2 indicates a strong coverage buffer, where cash flow comfortably supports dividend payments
- Between 1 and 2 suggests moderate coverage and requires closer monitoring
- Below 1 indicates unsustainable payouts, where dividends exceed available cash flow
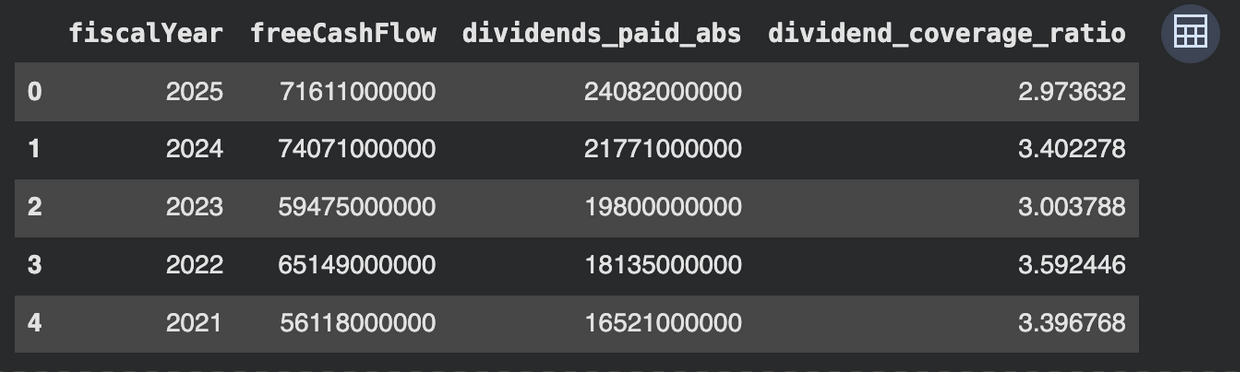
The dividend coverage ratio remains consistently above 2.9 across all years, indicating that free cash flow is nearly three times the dividend payout. This reflects strong coverage and suggests that dividends are well supported by internal cash generation.
There is no declining trend in coverage, and even in lower cash flow years, the ratio remains comfortably above critical levels. This indicates stability in both cash generation and payout policy.
These results confirm that the company has sufficient financial flexibility, and this ratio will now be used in the next step to classify dividend stress levels. However, even with strong coverage, capital allocation decisions such as share buybacks, reinvestment, or acquisitions can compete with dividends for available cash, which may influence future payout stability.
Step 3: Classify Dividend Stress Levels
We now convert the coverage ratio into a structured signal by assigning each year a stress category. This helps simplify interpretation and makes it easier to identify whether dividend payouts remain sustainable under different conditions.
We classify each period into three categories based on coverage levels: “Healthy” when cash flow comfortably supports dividends, “Watchlist” when coverage is moderate, and “Stressed” when payouts exceed available cash.
|
def classify_stress(row): if row['dividend_coverage_ratio'] > 2: return "Healthy" elif row['dividend_coverage_ratio'] > 1: return "Watchlist" else: return "Stressed" coverage_df['stress_status'] = coverage_df.apply(classify_stress, axis=1) coverage_df |
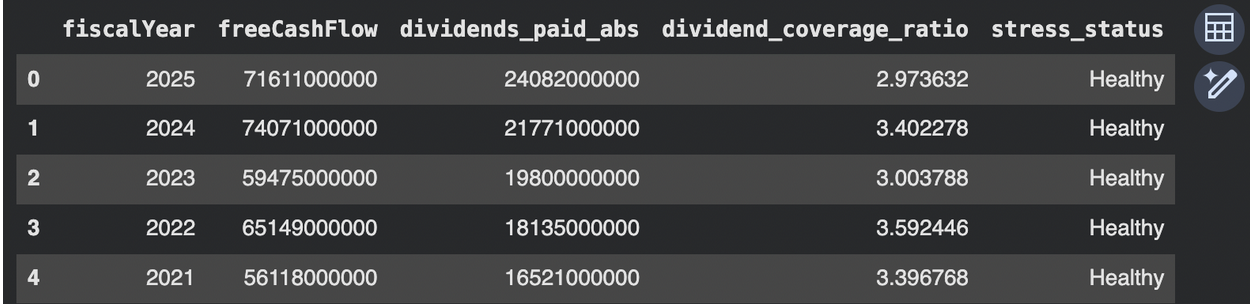
All years fall under the “Healthy” category, with no transitions observed across the time period, indicating consistently strong dividend coverage. The absence of any shift into Watchlist or Stressed categories suggests that the company maintains a stable payout buffer even across varying cash flow conditions.
The company consistently generates ~3x cash relative to dividends, suggesting a comfortable payout buffer. This output confirms stability across cycles and shows no immediate stress signals. It also validates the robustness of earlier ratio calculations and prepares us to evaluate edge cases or stress scenarios in the next section.
Mini Case Study: When High Dividends Mask Weak Coverage
A high dividend payout does not always indicate strength. In some cases, companies continue distributing dividends even when cash generation weakens. This creates a hidden risk that only becomes visible when coverage deteriorates.
To illustrate this, we simulate a stress scenario by reducing free cash flow and observing how coverage changes. To simulate a realistic stress condition, we apply a 50% reduction in free cash flow, representing a moderate downturn scenario where business performance weakens but does not collapse entirely.
|
# Simulate stress: reduce free cash flow by 50% stress_df = coverage_df.copy() stress_df['stressed_fcf'] = stress_df['freeCashFlow'] * 0.5 stress_df['stressed_coverage_ratio'] = ( stress_df['stressed_fcf'] / stress_df['dividends_paid_abs'] ) def classify_stress_scenario(row): if row['stressed_coverage_ratio'] > 2: return "Healthy" elif row['stressed_coverage_ratio'] > 1: return "Watchlist" else: return "Stressed" stress_df['stressed_status'] = stress_df.apply(classify_stress_scenario, axis=1) stress_df[['fiscalYear', 'stressed_fcf', 'stressed_coverage_ratio', 'stressed_status']] |
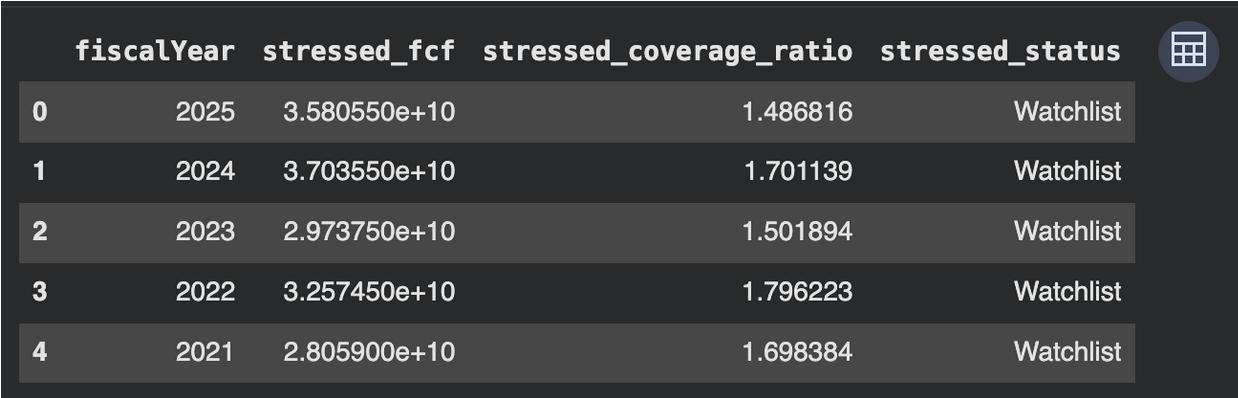
This result highlights a critical insight: strong dividend coverage under normal conditions does not guarantee resilience under stress.
Under the stressed scenario, all years shift from Healthy to Watchlist, showing how quickly dividend safety can deteriorate when cash flow weakens.. Coverage drops close to ~1.5x, reducing the safety buffer significantly. This reveals that while dividends appear stable in normal conditions, they are not deeply resilient under pressure. The output highlights why stress testing is critical before concluding dividend sustainability.
Limitations of the Dividend Coverage Stress Checker
The dividend coverage stress checker provides a cash flow-based view of dividend sustainability, but it has three key limitations.
First, it does not account for balance sheet strength or liquidity, which can temporarily support dividends even when free cash flow weakens.
Second, it is not forward-looking and does not capture changes in future earnings, capital expenditures, or business conditions.
Third, it does not incorporate capital allocation priorities, where buybacks, reinvestment, or acquisitions may compete with dividends for available cash.
As a result, this signal should be used as a screening tool alongside broader financial analysis.
Conclusion
Dividend safety cannot be judged from payout ratios alone. Cash flow coverage provides a more realistic view of whether distributions are sustainable across different conditions.
In this analysis, the company appeared stable under normal conditions, with strong coverage ratios. However, a simple stress scenario revealed how quickly that safety buffer can shrink when cash generation weakens.
Because this approach relies on structured cash flow and dividend data, having consistent access to financial datasets—such as those provided by Financial Modeling Prep—makes it easier to build repeatable and scalable analysis.
By combining free cash flow with payout data, investors can move beyond surface-level signals, identify risks earlier, and make more informed decisions.
In practice, this framework can be used to screen dividend stocks, identify fragile payout policies, and stress test income-focused portfolios under different cash flow scenarios.
Frequently Asked Questions
1. What is a good dividend coverage ratio?
A dividend coverage ratio above 2 generally indicates strong coverage, meaning the company generates at least twice the cash required to fund dividends. Ratios closer to 1 suggest tighter coverage and require closer monitoring.
2. Why is free cash flow used instead of net income?
Free cash flow reflects actual cash available after capital expenditures, making it a more reliable measure for funding dividends. Net income may include non-cash items and does not directly indicate cash availability.
3. Can a company pay dividends with low coverage?
Yes, companies may continue paying dividends using cash reserves or debt. However, this is not sustainable over the long term and may signal potential risk.
4. What does a coverage ratio below 1 mean?
A ratio below 1 indicates that free cash flow is insufficient to cover dividend payments. This suggests that the company is funding dividends through external means, which may not be sustainable.
5. How often should dividend coverage be evaluated?
Dividend coverage should be evaluated periodically, typically on an annual basis, or more frequently during periods of financial stress or declining cash flow.
6. Does this framework work for all industries?
The framework is broadly applicable, but capital-intensive industries may show more variability in free cash flow. In such cases, multi-year trends should be considered rather than relying on a single period.

Financial APIs, Claude MCP, and AI-driven research workflows
Pranjal Saxena writes technical content focused on financial data APIs, Claude MCP workflows, AI-driven research systems, and Python-based market analysis. For FMP, his work centers on turning structured financial data into practical, workflow-driven content for developers, analysts, and fintech teams. He combines experience in data science, NLP, generative AI, and financial API workflows to show how APIs, automation, and AI-assisted systems can support modern financial research and analysis.
Related




Financial data for every need
Real-time quotes and 30+ years of historical data, including prices, fundamentals, and insider transactions — all accessible via API.
Create Free Account