Build a Buyback Reality Check Using Share Count vs Cash Flow

Stock buybacks are often interpreted as a direct signal of shareholder returns. When companies announce large repurchase programs, the narrative typically suggests confidence, capital discipline, and long-term value creation. However, the headline number alone does not reveal whether these buybacks are actually reducing share count or simply offsetting dilution from stock-based compensation.
In practice, a company can spend billions on buybacks while total shares outstanding remain flat or even increase, highlighting the gap between repurchase activity and actual shareholder impact.
This distinction becomes more important in high-growth companies like NVIDIA (NVDA), where equity compensation and rapid expansion can influence share count dynamics. In such cases, companies may report significant buyback activity while total shares outstanding show limited reduction, raising questions about the true impact of these programs.
In this article, we build a Buyback Reality Check by combining structured financial data from Financial Modeling Prep APIs with Python to compare changes in share count, free cash flow, and repurchase activity. Using NVIDIA as a case study, we construct a practical framework to evaluate whether buybacks are genuinely reducing dilution and whether they are supported by sustainable cash generation.
Financial Modeling Prep APIs Used
- Income Statement API: Provides historical income statement data for each reporting period, including fields such as revenue, net income, EPS, and weighted average share count.
- Cash Flow Statement API: Provides detailed cash flow data, including free cash flow, operating cash flow, and capital allocation activities such as stock repurchases.
How to Get Your API Key
To access Financial Modeling Prep's APIs, you need a valid API key.
Create an account using the official registration page.
After registration, your API key will be available in your dashboard. Replace "YOUR_API_KEY" in the code examples below with your personal key to authenticate requests.
Defining the Buyback Reality Check
Stock buybacks are often discussed as a sign of shareholder-friendly capital allocation. However, repurchase activity becomes meaningful only when it produces a visible reduction in shares outstanding and remains supported by internally generated cash flow. Looking at buyback spending alone does not answer either of these questions.
This workflow is designed to test that gap directly. Instead of relying on repurchase headlines, we compare the company's historical share count with its free cash flow and reported stock repurchase activity. This creates a more practical view of whether buybacks are genuinely reducing dilution or simply absorbing newly issued shares.
Using NVIDIA as the case study, the framework focuses on two financial realities. First, are total shares outstanding actually declining over time. Second, is the company generating enough free cash flow to support those repurchases without stretching its capital base.
What This Workflow Evaluates
This article builds a simple buyback validation framework around three questions:
- Is the company's share count decreasing over time
- Is buyback activity supported by free cash flow
- Does the overall pattern suggest a real, mixed, or weak buyback program
These checks matter because buybacks can look impressive in absolute dollar terms while having little impact on actual dilution. A company may spend billions on repurchases, but if stock-based compensation or fresh issuance offsets that activity, the share base may not fall in a meaningful way.
Signals We Will Build
To answer these questions, we will calculate three linked signals.
1. Share Count Change (%)
This measures how shares outstanding change across reporting periods. A declining share count suggests that repurchases are reducing the equity base. A flat or rising count suggests that buybacks may be offsetting dilution rather than creating real concentration for existing shareholders.
2. Buyback Spend Relative to Free Cash Flow
This compares stock repurchase activity with free cash flow. The goal is to test whether the company is funding buybacks through internally generated cash. Lower ratios indicate stronger funding support, while very high ratios can signal that repurchases are becoming financially aggressive.
3. Final Buyback Reality Classification
The final signal combines share count behavior with buyback funding strength.
- A strong result means shares are declining and buybacks are reasonably covered by free cash flow.
- A mixed result means buybacks are present, but the reduction in share count is limited.
- A weak result means buybacks are not translating into lower share count or are consuming an unusually high share of free cash flow.
This framework gives us a practical way to move from repurchase headlines to measurable verification. The final output of this framework is a classification of buyback quality (Strong, Mixed, or Weak) based on share count behavior and funding sustainability.
In the next section, we will start building the dataset by retrieving NVIDIA's historical share count data from the Income Statement API.
Building the Dataset in Python
To implement the Buyback Reality Check, we now construct a structured dataset that combines share count data with cash flow data. This dataset will allow us to evaluate both the effectiveness and funding of buyback activity.
We begin by retrieving historical share count information, followed by cash flow data, and then combine both into a unified analytical table.
Step 1: Retrieve Share Count Data
To evaluate whether NVIDIA's buybacks are actually reducing dilution, we first need to track how the company's share count evolves over time. This cannot be inferred from buyback spending alone and must be directly observed using reported financial data.
We retrieve this information using the Income Statement API, which provides weighted average shares outstanding for each reporting period.
Python: Fetch and Prepare Share Count Data
|
import requests import pandas as pd API_KEY = "YOUR_API_KEY" symbol = "NVDA" url = f"https://financialmodelingprep.com/stable/income-statement?symbol={symbol}&period=annual&limit=10&apikey={API_KEY}" response = requests.get(url) data = response.json() df_shares = pd.DataFrame(data) # Keep only required columns (remove calendarYear) df_shares = df_shares[ ['date', 'fiscalYear', 'weightedAverageShsOut', 'weightedAverageShsOutDil'] ].copy() # Convert date and sort df_shares['date'] = pd.to_datetime(df_shares['date']) df_shares = df_shares.sort_values('date').reset_index(drop=True) df_shares |
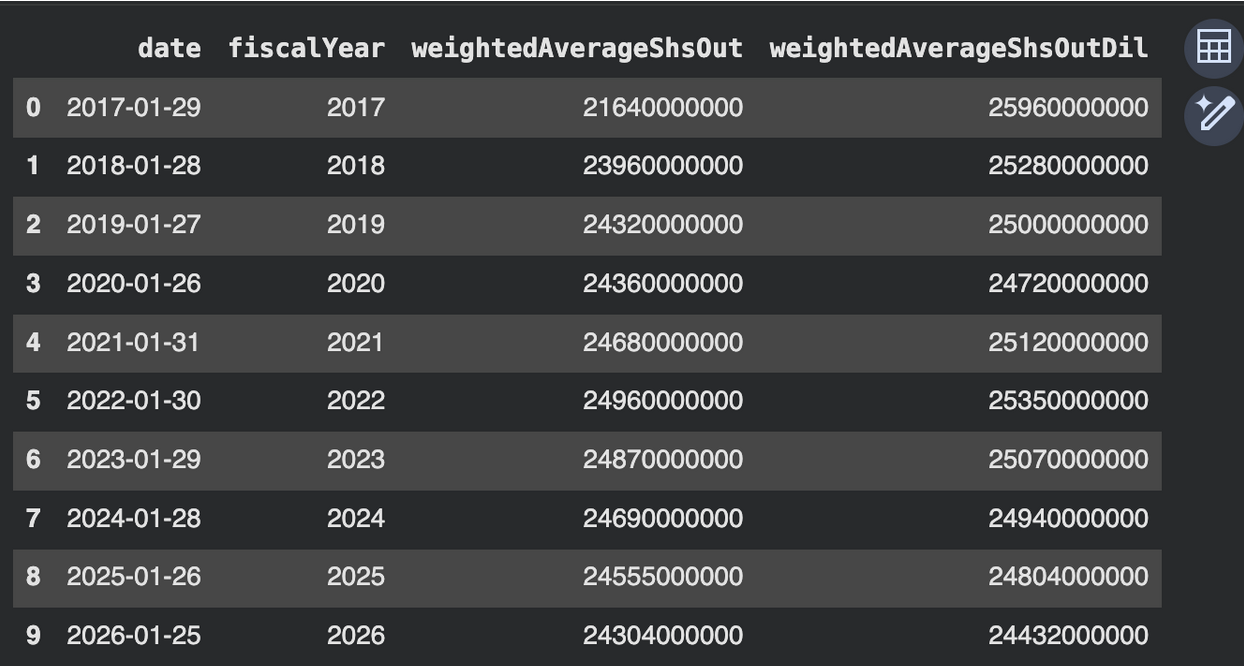
The weighted average shares outstanding is used here as a proxy for dilution and buyback effectiveness, as it reflects how the company's equity base changes over time.
Interpretation: Share Count Trend
The dataset shows NVIDIA's weighted average share count across fiscal years from 2017 to 2026. This provides a direct view of whether buybacks have translated into a meaningful reduction in the company's equity base.
A few clear patterns emerge:
- From 2017 to 2022, the share count increased steadily (from ~2.16B to ~2.49B).
This indicates that dilution—likely from stock-based compensation or issuance—was dominating during this period. - Starting 2023 onward, the trend begins to reverse.
Shares decline from ~2.487B in 2023 to ~2.430B in 2026, suggesting that recent buyback activity has started to offset dilution more effectively. - However, when viewed across the full period, the reduction is not consistent or long-term. The earlier years of expansion still outweigh the recent decline.
What This Means for Buyback Effectiveness
At this stage, we can draw one important conclusion:
NVIDIA's buybacks have not consistently reduced share count over the long term, although there are signs of improvement in recent years.
This suggests a mixed outcome:
- Earlier buybacks (if present) were likely absorbing dilution rather than reducing shares
- More recent activity may be more effective, but needs validation
Step 2: Retrieve Cash Flow Data
After evaluating how NVIDIA's share count has evolved, the next step is to understand how buybacks are being funded. A reduction in share count becomes meaningful only when it is supported by sustainable cash generation.
We retrieve this information using the Cash Flow Statement API, which provides both free cash flow and stock repurchase activity for each reporting period.
Note that weighted average shares may differ from end-of-period shares outstanding, which can slightly blur the exact timing of buyback impact within a given reporting period.
In this workflow, we use the commonStockRepurchased field as the measure of reported buyback activity. Because financial statement schemas can vary slightly across responses, the code first checks whether the repurchase field is present before selecting it.
|
import requests import pandas as pd API_KEY = "YOUR_API_KEY" symbol = "NVDA" url = f"https://financialmodelingprep.com/stable/cash-flow-statement?symbol={symbol}&period=annual&limit=10&apikey={API_KEY}" response = requests.get(url) data = response.json() df_cf = pd.DataFrame(data) # Check available columns first (important for robustness) print(df_cf.columns) # Keep relevant fields (adjust if naming differs slightly) cols_to_keep = ['date', 'fiscalYear', 'freeCashFlow'] # Add repurchase column if present if 'commonStockRepurchased' in df_cf.columns: cols_to_keep.append('commonStockRepurchased') df_cf = df_cf[cols_to_keep].copy() # Convert date and sort df_cf['date'] = pd.to_datetime(df_cf['date']) df_cf = df_cf.sort_values('date').reset_index(drop=True) df_cf |
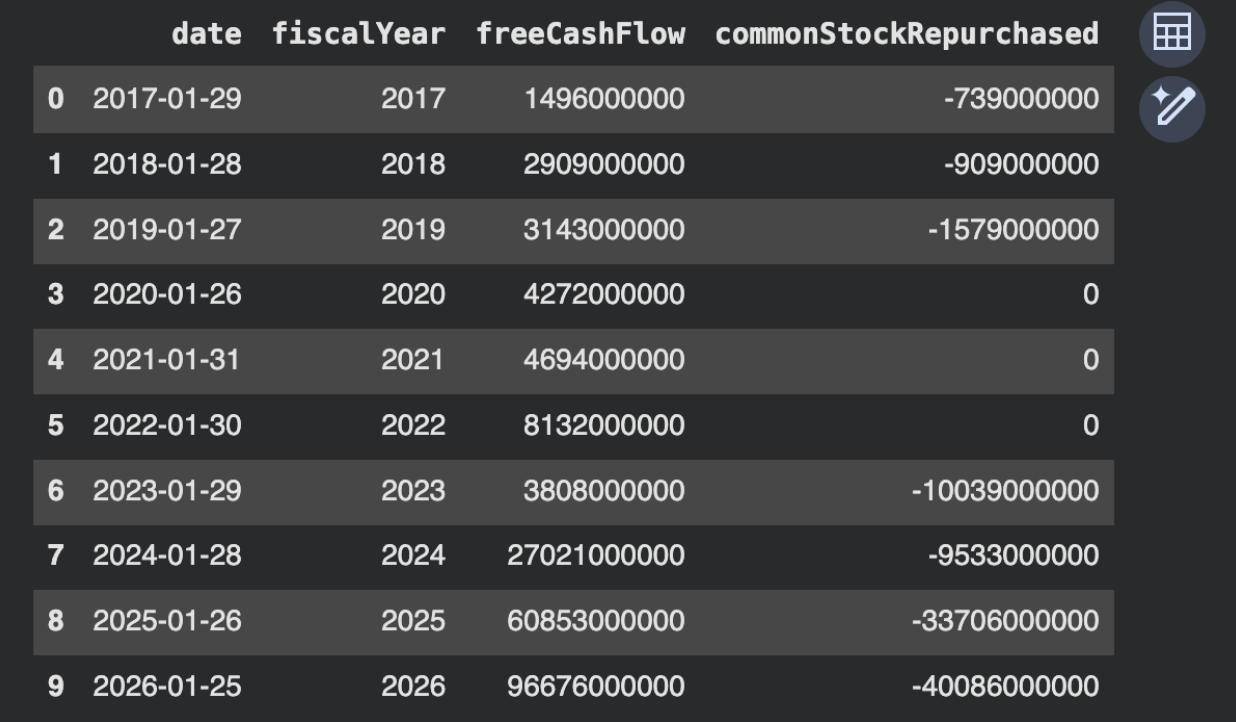
Interpretation: Buyback Funding Behavior
The dataset shows NVIDIA's free cash flow alongside stock repurchase activity across years. Buybacks appear sporadic, with no activity between 2020-2022, followed by large repurchases from 2023 onward. At the same time, free cash flow varies significantly, with strong growth in recent years.
This indicates that recent buybacks are timed alongside improving cash generation, rather than being consistent year-over-year.
Overall, buyback activity appears episodic rather than consistent, with repurchases increasing primarily during periods of strong free cash flow rather than following a steady capital return strategy.
Next, we combine this with share count data to evaluate whether these repurchases are both effective and financially supported.
Step 3: Merge Share Count and Cash Flow Data
So far, we have:
- Share count trend from the income statement
- Buyback activity and free cash flow from the cash flow statement
To evaluate buyback effectiveness properly, we need both in one unified dataset. This allows us to directly compare:
- Share count changes
- Buyback spending
- Cash generation
Python: Merge Datasets
|
# Merge on date and fiscalYear for better alignment df_merged = pd.merge( df_shares, df_cf, on=['date', 'fiscalYear'], how='inner' ) # Sort again to ensure chronological order df_merged = df_merged.sort_values('date').reset_index(drop=True) df_merged |
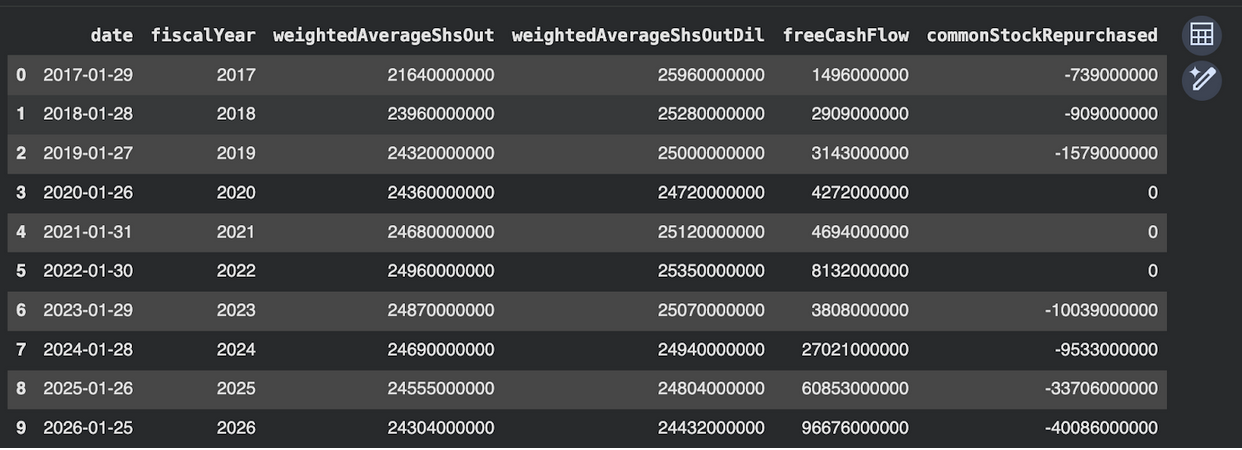
This merged dataset enables direct comparison of share count movement, buyback intensity, and funding capacity within the same time frame.
Interpretation: Alignment Between Capital and Actions
The merged dataset aligns share count, free cash flow, and buyback activity across the same periods. Early years show rising share count despite buybacks, indicating dilution dominance. From 2023 onward, share count declines while buybacks increase, suggesting improved effectiveness.
Free cash flow also strengthens in recent years, supporting higher repurchase activity.
This combined view enables direct evaluation of whether buybacks are both effective (reducing shares) and financially supported, which we will quantify next through signal construction.
Constructing the Buyback Reality Check
At this stage, we have a unified dataset containing:
- Share count
- Free cash flow
- Buyback activity
We now convert this into structured signals that quantify whether buybacks are effective and financially supported.
With the unified dataset ready, we can now convert raw financial data into measurable buyback signals.
Step 4.1: Share Count Reduction Signal
We measure how shares outstanding change over time.
Python: Calculate Share Count Change (%)
|
# Calculate YoY % change in share count df_merged['share_change_pct'] = df_merged['weightedAverageShsOut'].pct_change() * 100 df_merged[['date', 'weightedAverageShsOut', 'share_change_pct']] |
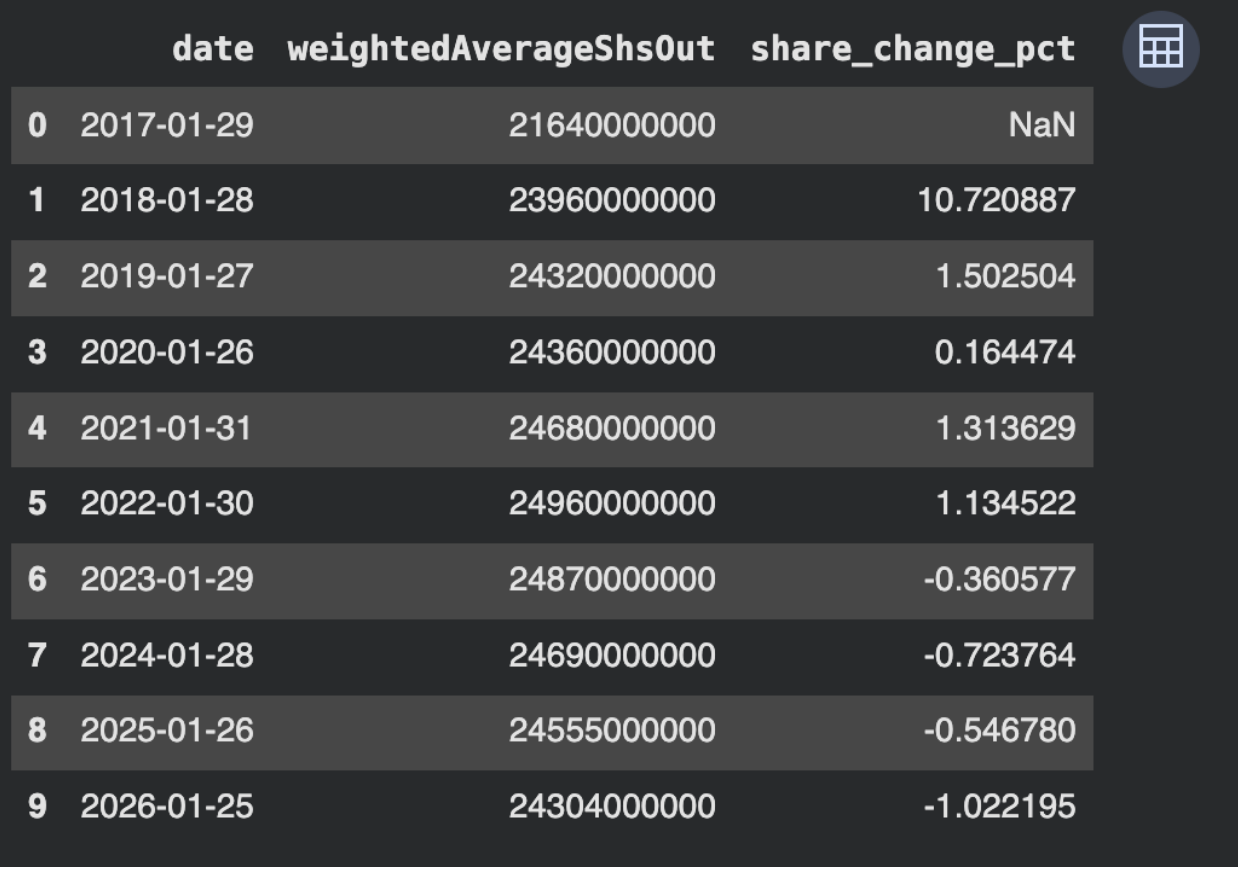
In general, small percentage changes may reflect normal fluctuations, while consistent declines over multiple periods indicate meaningful reduction in share count.
Interpretation: Share Count Reduction Signal
The share change signal shows a clear shift over time. From 2018 to 2022, share count consistently increased, with a sharp jump of ~10.7% in 2018 and smaller increases thereafter, confirming sustained dilution.
From 2023 onward, the trend reverses, with negative changes each year, indicating gradual share reduction. However, the decline is moderate and recent, not sustained over the full period.
This suggests NVIDIA's buybacks have only recently started reducing dilution, making the overall signal mixed rather than consistently strong.
Step 4.2: Buyback Funding Signal
We compare buyback spending with free cash flow to understand whether repurchases are funded by internal cash generation.
Python: Calculate Buybacks as % of Free Cash Flow
|
# Convert buybacks to positive values for analysis df_merged['buybacks'] = df_merged['commonStockRepurchased'].abs() # Calculate buyback to FCF ratio df_merged['buyback_to_fcf'] = df_merged['buybacks'] / df_merged['freeCashFlow'] df_merged[['date', 'buybacks', 'freeCashFlow', 'buyback_to_fcf']] |
As a general guideline, values below 1 indicate buybacks are fully funded by free cash flow, values above 1 suggest partial external funding, and values significantly above 1.5 reflect more aggressive or stretched repurchase activity.
Interpretation: Buyback Funding Signal
The buyback-to-FCF ratio shows how sustainably NVIDIA is funding repurchases. Between 2017-2019, buybacks consumed ~30-50% of free cash flow, indicating moderate and sustainable allocation. There was no buyback activity from 2020-2022, despite strong cash generation.
In 2023, the ratio spikes above 2.6, meaning buybacks significantly exceeded free cash flow, suggesting aggressive or externally supported repurchases. From 2024 onward, the ratio stabilizes below 1, indicating improved alignment with cash generation.
Step 4.3: Final Buyback Reality Classification
We now combine:
- Share count trend
- Buyback funding strength
to classify buyback quality into Strong, Mixed, or Weak.
Python: Build Buyback Reality Classification
Conceptually, the classification combines two conditions: declining share count indicates effective buybacks, while buyback-to-FCF ratios within sustainable limits indicate strong funding support. When both conditions are met, the signal is classified as Strong; otherwise, it shifts to Mixed or Weak depending on the degree of dilution and funding pressure.
|
def classify_buyback(row): share_change = row['share_change_pct'] buyback_ratio = row['buyback_to_fcf']
# Strong: shares decreasing and buybacks funded by FCF if share_change < 0 and buyback_ratio <= 1: return "Strong"
# Weak: shares increasing OR buybacks exceed FCF significantly elif share_change > 0 or buyback_ratio > 1.5: return "Weak"
# Mixed: everything in between else: return "Mixed" df_merged['buyback_signal'] = df_merged.apply(classify_buyback, axis=1) df_merged[['date', 'share_change_pct', 'buyback_to_fcf', 'buyback_signal']] |
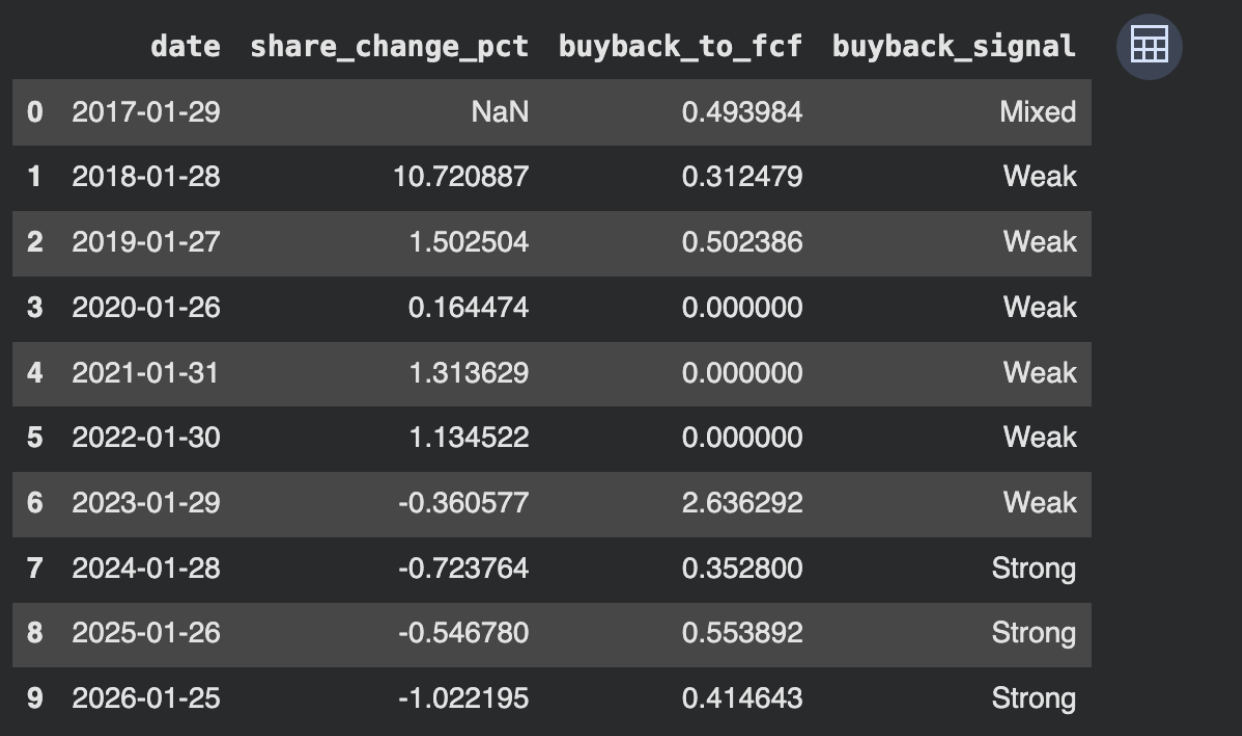
Interpretation: Buyback Reality Classification
The classification combines two conditions:
- Effectiveness → share count must decline
- Sustainability → buybacks should not exceed free cash flow
Based on this logic:
- 2018-2023 are mostly classified as Weak, as share count increased or buybacks exceeded cash flow (notably 2023).
- 2024-2026 shift to Strong, where shares decline and buybacks remain within cash generation.
This shows a clear transition from dilution-dominated years to financially supported buybacks.
Across the full timeline, the majority of earlier years fall into the Weak category, with a clear inflection beginning around 2023, after which the classification shifts toward Strong, indicating that improvement in buyback quality is recent rather than sustained over the full period.
Visualizing Buyback Effectiveness
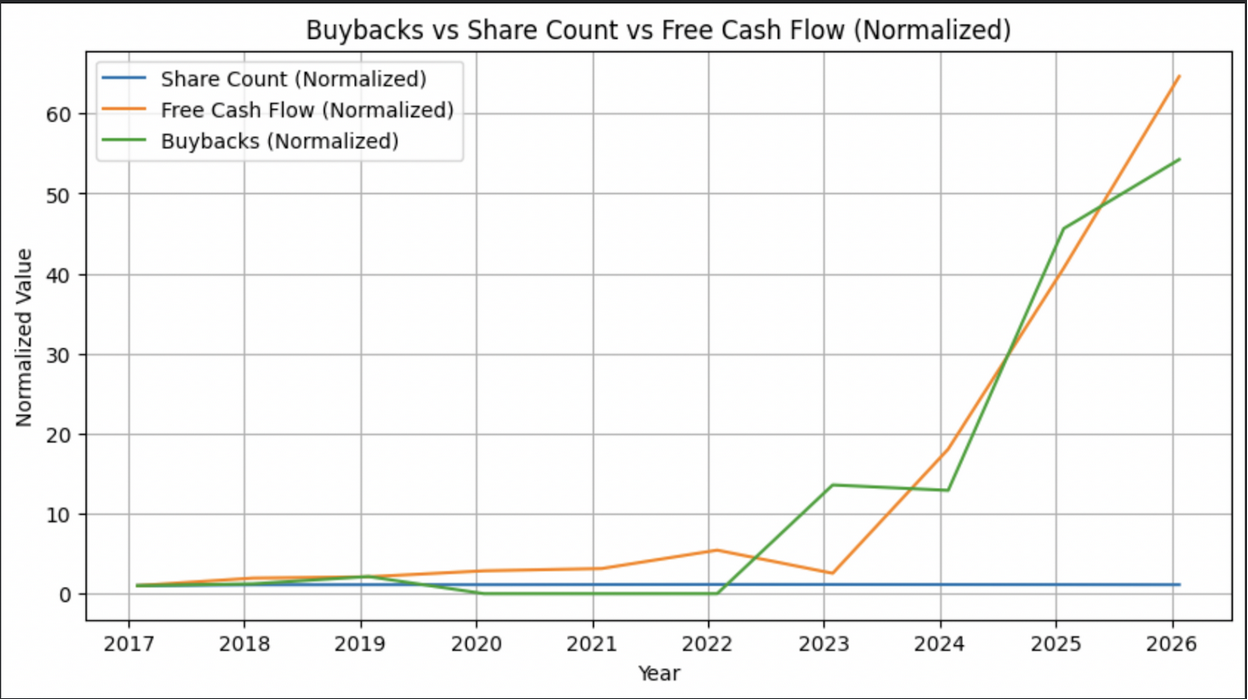
To better understand how buybacks, share count, and cash generation evolve together, we can visualize these variables over time. This helps identify trend shifts that may not be immediately obvious from tabular data.
In this chart, focus on the alignment between rising buyback activity, declining share count, and increasing free cash flow, as this combination indicates improving buyback effectiveness.
Interpretation: Visual Trend Analysis
The chart highlights a structural shift in NVIDIA's capital allocation. Share count increases steadily until 2022, confirming persistent dilution, while buyback activity remains limited or absent. From 2023 onward, buybacks rise sharply and coincide with a gradual decline in share count.
At the same time, free cash flow expands significantly, especially in recent years, supporting higher repurchase activity. This visual alignment confirms that earlier buybacks were ineffective, whereas recent periods show stronger coordination between buybacks, share reduction, and cash generation, reinforcing the signal-based classification.
Why This Classification Makes Sense
This framework reflects how analysts evaluate capital allocation:
- Buybacks are only effective if they reduce the share base
- They are only sustainable if funded by internal cash
A threshold of 1 means buybacks are fully covered by free cash flow, while ratios meaningfully above 1 indicate that repurchases are exceeding internally generated cash. In this framework, values above 1.5 are treated as weak because they reflect materially stretched funding relative to cash generation.
For example, in 2023 the buyback-to-FCF ratio exceeds 2.6, indicating that repurchases significantly outpaced internally generated cash, which aligns with its classification as Weak.
A company can spend heavily on repurchases, but if:
- Shares do not decline → impact is limited
- Or buybacks exceed FCF → financial quality weakens
By combining both dimensions, the signal avoids misleading conclusions based on buyback size alone.
Mini Case Study: NVIDIA (NVDA)
Using NVIDIA's historical data, we evaluated buyback activity across three dimensions:
- Share count trend
- Buyback spending
- Free cash flow support
The combined dataset and signals provide a clear view of how buybacks evolved over time.
Key Observations
- 2017-2022: Dilution-Dominated Phase
Share count increased consistently, even in years with buyback activity. This indicates that repurchases were largely offsetting dilution rather than reducing the equity base. - 2023: Aggressive but Stretched Buybacks
Buyback activity surged, but the buyback-to-FCF ratio exceeded 2.6. This suggests that repurchases were not fully supported by internal cash generation, weakening financial quality. - 2024-2026: Improved Buyback Quality
Share count declines consistently, and buybacks remain within free cash flow. This marks a transition toward effective and financially supported capital return.
What the Signal Reveals
The Buyback Reality Check shows that NVIDIA's buyback program has improved over time, but this strength is relatively recent.
- Earlier years reflect ineffective buybacks due to dilution
- Recent years indicate stronger capital discipline
This highlights an important insight:
Buyback programs should be evaluated over time, not based on isolated announcements or single-year activity.
In NVIDIA's case, the classification aligns with the underlying data, confirming that the signal reflects observed capital allocation behavior rather than headline buyback figures alone.
When Buyback Signals Can Mislead
This framework is useful, but it should not be treated as a standalone conclusion. A few situations can distort the signal.
- Stock-based compensation can absorb part of the repurchase activity, making buybacks look weaker even when the company is returning capital.
- Debt-funded buybacks can make repurchases appear stronger in the short term, even though free cash flow does not fully support them.
- Timing effects can also matter. A single year of unusually high or low free cash flow can temporarily distort the buyback-to-FCF ratio.
Because of these factors, the signal works best as a validation tool rather than a complete measure of capital allocation quality.
Final Summary
The Buyback Reality Check demonstrates that evaluating repurchase programs requires more than headline buyback figures. By combining share count trends with free cash flow coverage using data from Financial Modeling Prep APIs, the framework distinguishes between buybacks that reduce dilution and those that merely offset issuance.
Using datasets from the Financial Modeling Prep — specifically the Income Statement and Cash Flow Statement APIs — we identified that NVIDIA's earlier buybacks were largely ineffective, while recent years show improving alignment between share reduction and cash generation.
This approach provides a practical way to validate capital allocation decisions using structured financial data. Analysts can extend this workflow across companies to identify sustainable buyback programs, while combining it with broader context such as compensation and capital strategy. This framework can also be scaled across multiple companies or used as a screening tool to identify high-quality buyback programs with consistent share reduction and sustainable funding.

Financial APIs, Claude MCP, and AI-driven research workflows
Pranjal Saxena writes technical content focused on financial data APIs, Claude MCP workflows, AI-driven research systems, and Python-based market analysis. For FMP, his work centers on turning structured financial data into practical, workflow-driven content for developers, analysts, and fintech teams. He combines experience in data science, NLP, generative AI, and financial API workflows to show how APIs, automation, and AI-assisted systems can support modern financial research and analysis.
Related




Financial data for every need
Real-time quotes and 30+ years of historical data, including prices, fundamentals, and insider transactions — all accessible via API.
Create Free Account