FMP
How to Calculate Book Value per Share (BVPS)
Jan 08, 2026
At its core, equity analysis is an attempt to determine what a business is worth versus what the market is charging for it. One of the most fundamental baselines for this valuation is Book Value per Share (BVPS). It serves as an accounting-based measure of net equity per share—not a literal liquidation value, but a standardized baseline for assessing historical capital accumulation.
For analysts, calculating BVPS is a critical input for the Price-to-Book (P/B) ratio, a metric used extensively to identify undervalued stocks, particularly in asset-heavy sectors like banking and insurance. While the market price reflects future growth expectations, BVPS reflects the historical accumulation of equity. When these two diverge significantly, it signals either massive intangible value or a potential mispricing. However, it is important to note that book value reflects accounting conventions and may differ materially from realizable asset values, especially for intangible-heavy companies.
This analysis outlines the precise methodology for calculating BVPS using standardized financial data, demonstrating how to automate this process across thousands of tickers to build consistent valuation models.
The Math Behind the Metric
The formula for Book Value per Share is deceptively simple. It measures the amount of common equity available to each share of common stock. However, ensuring you have the correct inputs—specifically stripping out non-controlling interests or preferred equity is where errors often occur.
The Core Formula
BVPS = (Total Stockholders' Equity - Preferred Equity) / Total Shares Outstanding
For many companies, Preferred Equity is zero, simplifying the calculation to Total Shareholders' Equity divided by the weighted average of shares outstanding. Before simplifying the equation to just "Equity divided by Shares," analysts must verify that preferred equity or non-controlling interests are negligible. If these items are material, failing to subtract them will artificially inflate the BVPS figure, leading to an incorrect valuation baseline.
- Total Stockholders' Equity: This is found on the balance sheet and represents Assets minus Liabilities. It includes retained earnings, paid-in capital, and other comprehensive income.
- Total Shares Outstanding: This is the count of shares currently held by all shareholders, including insiders and institutional investors.
Why Trends Matter More Than Absolutes
The trend of BVPS is often more important than the absolute number. A consistently rising BVPS suggests the company is increasing its net worth over time, either through retained earnings or efficient capital allocation. A declining BVPS often points to losses or aggressive share buybacks executed at prices above book value. Because buybacks can skew short-term data depending on execution price and timing, it is crucial to evaluate BVPS trends over multi-year periods rather than reacting to single-year fluctuations.
Sourcing Standardized Balance Sheet Data
To perform this calculation at scale, analysts cannot rely on manual data entry from PDFs. You need a structured feed from a provider like Financial Modeling Prep that standardizes line items like "Stockholders' Equity" across different reporting formats. This standardization is what allows for accurate cross-company comparability when running sector-wide screens.
Automating with APIs
We utilize the As Reported Balance Sheet API to retrieve this data. This endpoint provides the raw, as-reported line items directly from SEC filings, ensuring that the input data matches the company's official documentation.
By calling the API with the following structure, you can access the historical balance sheet data required for the calculation. This endpoint can be looped across symbols for large-scale screening workflows, provided your data plan supports the necessary request volume for broad market coverage.
This method is repeatable for thousands of tickers, allowing for sector-wide screening without manual adjustments.
Case Study: Apple (AAPL) Calculation
Apple (AAPL) offers a textbook example of how capital allocation specifically aggressive share repurchases can distort and drive book value trends. With a fortress balance sheet and a massive capital return program, Apple's financials allow us to isolate the mechanics of the BVPS formula in a real-world context.
Using standardized data from recent fiscal periods, we can trace how these levers interact:
Fiscal Year 2023 Breakdown
According to the As Reported Balance Sheet API data:
- Total Stockholders' Equity: 62.146 billion dollars
- Common Stock Shares Outstanding: 15.550 billion shares
- Calculation: 62.146 / 15.550 = 4.00 dollars per share
Fiscal Year 2024 Breakdown
- Total Stockholders' Equity: 56.950 billion dollars
- Common Stock Shares Outstanding: 15.117 billion shares
- Calculation: 56.950 / 15.117 = 3.77 dollars per share
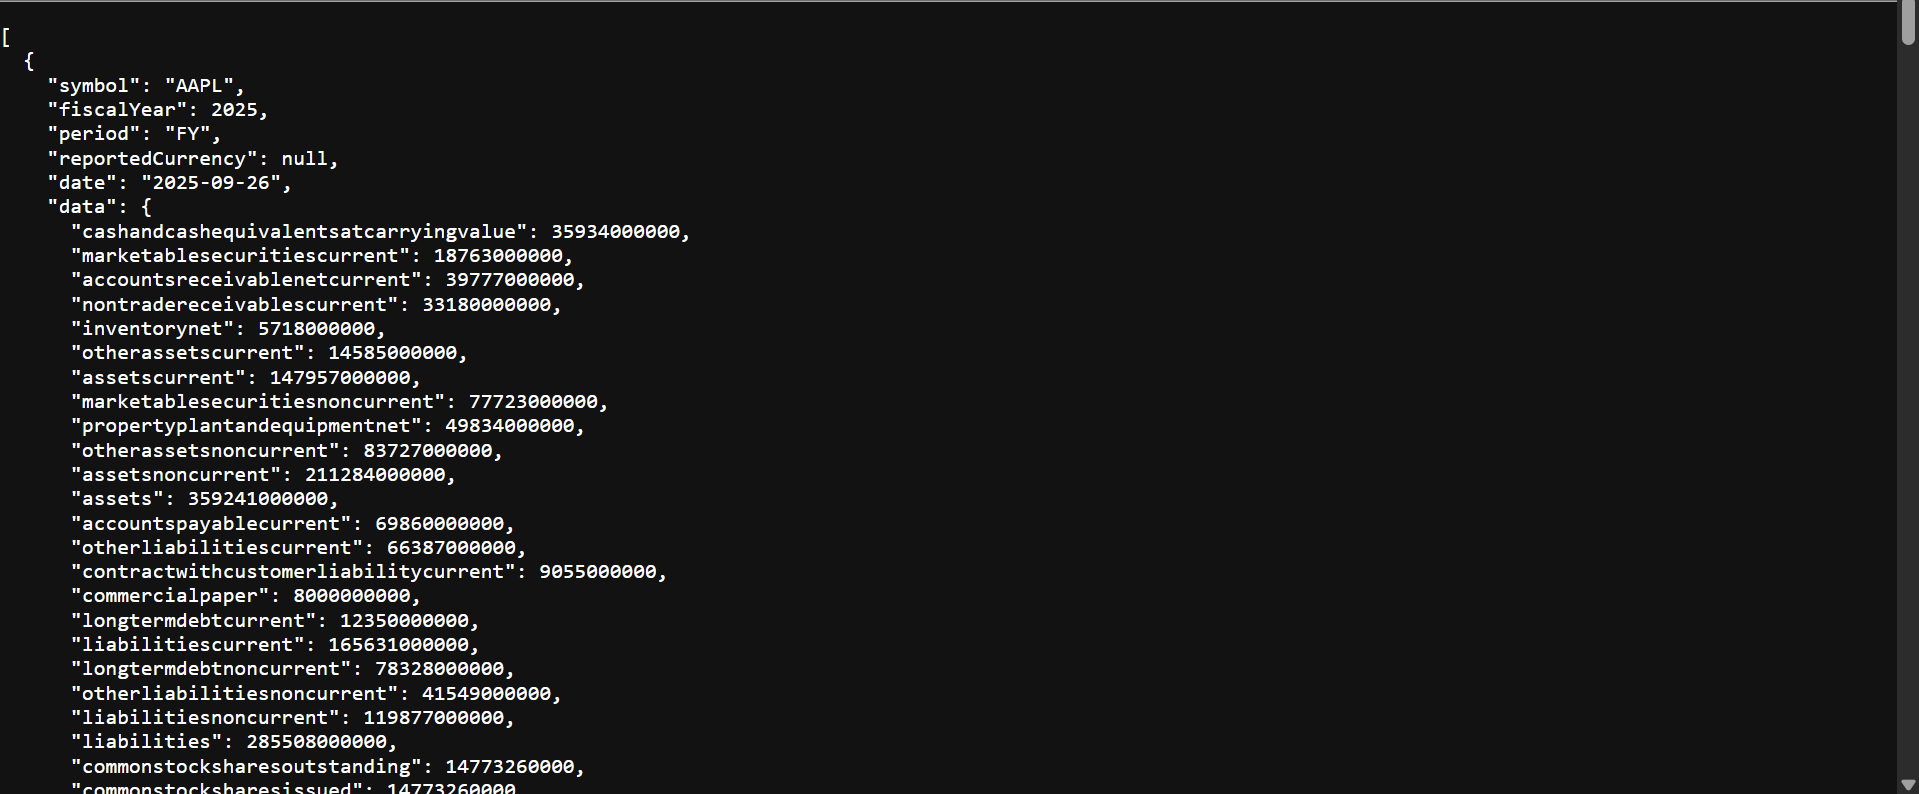
Fiscal Year 2025 Breakdown
- Total Stockholders' Equity: 73.733 billion dollars
- Common Stock Shares Outstanding: 14.773 billion shares
- Calculation: 73.733 / 14.773 = 4.99 dollars per share
Analyzing the Equity Trend
Between 2023 and 2024, Apple's BVPS dipped from 4.00 dollars to 3.77 dollars. This decline reflects a period where the cash outflow for buybacks reduced total equity faster than the share count could drop. However, by 2025, the trend reversed sharply, with BVPS climbing to 4.99 dollars.
This reversal highlights a key signal: the company successfully grew its net asset base while simultaneously shrinking the denominator (shares), creating a compounding effect on shareholder value. To validate this signal, analysts should cross-reference this rise with profitability metrics like ROIC to ensure the growth is driven by earnings power, not just financial engineering.
Interpreting the Signal: BVPS vs. Market Price
Once you have calculated BVPS, the next step is context. You must compare the accounting reality (Book Value) against the market sentiment (Stock Price). To do this, we pull the daily market data using the Historical Price API.
Integrating Market Data
Using the market data endpoint, we can see the recent pricing for Apple.
- Symbol: AAPL
- Reference Date: December 22, 2025
- Closing Price: 270.97 dollars
The Price-to-Book Reality Check
With a market price of 270.97 dollars and a calculated Book Value per Share of 4.99 dollars, we can calculate the Price-to-Book (P/B) ratio:
P/B Ratio = 270.97 / 4.99 = 54.3x
What this signals: A P/B ratio of 54x indicates that the market is assigning immense value to Apple's intangibles its brand, ecosystem, software, and future cash flows—rather than its physical assets (factories, inventory, cash). In technology, this is standard; investors buy the IP, not the liquidation value.
However, if you saw a P/B ratio of 54x in a capital-intensive industry like banking or utilities, it could signal elevated valuation risk. Conversely, if a bank trades at 0.5x P/B (Price is half of Book Value), it implies the market believes the assets on the balance sheet are impaired or "bad loans." Because P/B ratios are highly industry-dependent, they should not be compared directly across sectors. P/B is best used as one signal among many, rather than a standalone conclusion.
By deconstructing the income statement alongside these balance sheet signals, you can determine if a divergence like this is justified by high margins or if it represents a valuation risk.
Beyond the Liquidity Floor: A Scorecard for Capital Allocation
Many analysts treat BVPS as a static "liquidation floor," assuming it only matters if a company goes bankrupt. This is a dangerous oversimplification. In modern analysis, BVPS is a useful lens for assessing management's capital allocation efficiency, rather than the ultimate scorecard.
It reveals the truth about shareholder value creation that earnings per share (EPS) can sometimes hide. If a company is reporting record EPS but its BVPS is stagnant or declining over a multi-year period, management may be overpaying for dividends or buybacks, effectively hollowing out the balance sheet to prop up the stock price. To get the full picture, evaluate BVPS alongside ROIC, margins, and cash flow trends.
By automating this calculation via the FMP APIs, you move beyond the simple "cheap vs. expensive" debate. You gain a lens into the historical efficiency of the management team—a signal that remains relevant even in the intangible-heavy tech sector where "book value" is often dismissed.
Frequently Asked Questions
What is the formula for Book Value per Share?
The formula is Total Stockholders' Equity minus Preferred Equity, divided by the Total Number of Shares Outstanding. It represents the per-share value of the company's net assets.
Why is BVPS lower than the stock price for tech companies?
Tech companies often have significant intangible assets (brand, IP, software) that do not appear fully on the balance sheet. The stock price reflects future earnings potential from these intangibles, whereas BVPS only reflects historical accounting value.
Can BVPS be negative?
Yes. If a company has accumulated liabilities that exceed its assets, often due to sustained losses or high debt levels, Total Stockholders' Equity can be negative, resulting in a negative BVPS.
How do share buybacks affect BVPS?
Share buybacks reduce the number of shares outstanding (the denominator). If shares are bought back below the current book value, BVPS increases. If they are bought back above book value, BVPS decreases immediately, though the long-term impact depends on future earnings accretion.
Where can I find the data to calculate BVPS?
You can find Total Stockholders' Equity and Shares Outstanding in a company's 10-K or 10-Q filings. For automated analysis, you can use the FMP As Reported Balance Sheet API.

WACC vs ROIC: Evaluating Capital Efficiency and Value Creation
Introduction In corporate finance, assessing how effectively a company utilizes its capital is crucial. Two key metri...

BofA Sees AI Capex Boom in 2025, Backs Nvidia and Broadcom
Bank of America analysts reiterated a bullish outlook on data center and artificial intelligence capital expenditures fo...

Pinduoduo Inc. (PDD) Q1 2025 Earnings Report Analysis
Pinduoduo Inc., listed on the NASDAQ as PDD, is a prominent e-commerce platform in China, also operating internationally...

