


Revenue growth can look strong on the income statement, but reported sales alone do not prove that growth is durable. A company may grow revenue while receivables rise faster than sales, cash conversion weakens, margins compress, or working capital absorbs more capital than expected.
That gap creates a revenue quality problem. Analysts need to understand whether growth is supported by real customer collections, operational efficiency, and stable profitability, or whether the company is relying on looser payment terms, aggressive recognition patterns, or balance sheet pressure to sustain the headline number.
This article shows how revenue quality interpretation can use Financial Modeling Prep data through Claude MCP to connect revenue growth with receivables, deferred revenue, operating cash flow, margin trends, working capital movement, and profitability metrics.
The goal is not to create a simple growth score. It is to support a structured accounting-quality review that helps analysts evaluate whether reported growth is collectible, operationally supported, and financially durable.
Why Reported Revenue Growth Can Mislead
Revenue is usually the first number investors notice, but it is rarely enough to judge business quality. A company can report strong growth while the supporting financial signals move in the opposite direction.
The first warning sign often appears when receivables grow faster than revenue. If accounts receivable expands faster than sales, the company may be booking growth before cash collection catches up. That does not automatically mean aggressive accounting, but it does raise a quality question: is growth being collected at the same pace it is being reported?
Operating cash flow adds another check. Durable revenue should usually show some connection to cash conversion over time. When revenue expands but operating cash flow weakens, analysts need to review whether working capital, collection timing, customer terms, or cost structure is absorbing the benefit of growth.
Margins also matter. Revenue growth supported by discounting, higher fulfillment costs, or unfavorable product mix may not translate into stronger operating performance. A company can grow the top line while gross margin or operating margin reveals pressure underneath.
Deferred revenue and working capital movement help complete the picture. Deferred revenue can show whether future contracted revenue visibility is improving, while working capital movement can show whether growth requires more balance sheet support than expected.
That is why revenue quality needs integrated financial statement analysis. Reported growth has to be compared with cash collection, receivable behavior, margin durability, and operating efficiency before it can be treated as financially durable.
For that comparison to hold up, the underlying data has to be aligned. When income statement, balance sheet, and cash flow data are reviewed separately, the relationship between reported sales, collection timing, margin durability, and cash conversion can get lost. Mismatched periods, incomplete statement coverage, or inconsistent metric definitions can make growth look stronger or weaker than the reported data actually supports. FMP's structured datasets keep these inputs on the same company record and the same reporting period, which is what makes a consistent revenue quality read possible across companies and quarters.
The Data Foundation Behind Revenue Quality Interpretation
Testing whether reported revenue is durable only works if each part of the analysis is matched with the right financial evidence. Six FMP datasets together form that evidence base, each handling a specific part of the review.
The starting point is the top line itself. The Income Statement API establishes reported revenue growth and the margin context around it, including gross profit, operating income, and net income. This is what shows how growth is unfolding before any test of whether the rest of the statements support it.
The first quality check sits on the balance sheet. The Balance Sheet Statement API supplies accounts receivable, cash, current assets, current liabilities, and working capital items, which is how Claude tests whether growth is creating collection pressure or absorbing more balance sheet capacity than expected. Faster receivable growth, expanding working capital, or weaker liquidity all read differently when seen against reported revenue movement.
Cash conversion is the next test. The Cash Flow Statement API provides operating cash flow, capital expenditure, and free cash flow, which is how reported revenue gets compared against what actually converts into cash. Strong revenue growth that does not show up in operating cash flow is one of the clearer signals that growth and collection are moving out of sync.
For interpretation to stay consistent across companies and quarters, the cross-statement reads need a standardized reference. The Financial Statement Growth API provides growth rates across the income statement, balance sheet, and cash flow statement, which is how Claude compares revenue growth directly with receivable growth, cash flow growth, and profit growth. The Financial Ratios API supplies profitability, efficiency, liquidity, and financial health ratios in a consistent format, so a margin or efficiency read on one company compares meaningfully against another. The Key Metrics API adds broader quality indicators that frame revenue quality, working capital movement, and profitability trends in context.
Together, these datasets are what let Claude move from reading the revenue line to testing whether the rest of the financial statements support it.
Accessing FMP Data via Claude MCP
To run this system inside Claude, we connect Financial Modeling Prep's data layer through its MCP server, which allows Claude to retrieve financial datasets directly without writing manual API requests.
You first need an active FMP API key, which can be generated from your Financial Modeling Prep dashboard. This key is used to authenticate all MCP-based data requests.
Once the API key is available, FMP can be connected in Claude using its remote MCP endpoint:
|
https://financialmodelingprep.com/mcp?apikey=YOUR_FMP_API_KEY |
In Claude, navigate to Settings → Connectors → Add custom connector, and paste this URL into the Remote MCP Server field. After saving, Claude will automatically discover the available FMP tools.
For this system, Claude uses MCP to coordinate cross-statement analysis instead of treating each financial statement as a separate data pull. A typical reasoning flow can look like this:
- Pull multi-period revenue, gross profit, and operating income from the income statement
- Retrieve accounts receivable, deferred revenue where available, and working capital items from the balance sheet
- Compare revenue growth with operating cash flow and free cash flow
- Review profitability, efficiency, liquidity, and growth metrics
- Classify revenue quality based on cash realization, collection behavior, margin support, and working capital discipline
This is where MCP differs from a traditional API workflow. Instead of manually retrieving financial statements, calculating growth rates, comparing receivables, checking cash flow, and interpreting margin behavior across separate steps, Claude can coordinate the full review within one integrated accounting-quality loop.
For this article, that orchestration becomes the foundation for a revenue quality interpretation system. It helps analysts move beyond headline growth and evaluate whether reported revenue is collectible, operationally supported, and durable across periods.
Revenue Quality Interpretation Framework
A revenue quality review should not treat growth as durable simply because the top line increased. Reported revenue needs to be tested against cash realization, receivable behavior, margins, working capital movement, and operating efficiency.
For this article, the review covers five areas of revenue quality, followed by a final classification.
Reported Growth
The first step measures how revenue has changed across periods, including whether growth is accelerating, slowing, or becoming more volatile. This sets the baseline. Strong growth only becomes meaningful when the rest of the financial statements support it.
Cash Realization
The next test compares revenue growth with operating cash flow and free cash flow. If revenue rises while operating cash flow weakens, that is a cash realization gap. The gap may come from slower collections, higher working capital needs, cost pressure, or timing differences between recognized revenue and collected cash. This is what separates reported growth from realized growth.
Collection Quality
The third area compares revenue movement with accounts receivable growth. When receivables grow faster than revenue, the company may be extending looser payment terms, collecting more slowly, or recognizing revenue before cash conversion catches up. That does not automatically signal aggressive accounting, but it does require closer review.
For subscription or contract-heavy businesses, deferred revenue adds useful context. Rising deferred revenue can support future visibility, while weaker deferred revenue growth may suggest less forward coverage behind reported sales.
Margin Support
The fourth check tests whether growth protects profitability. Revenue growth with stable or improving gross margin usually signals stronger operating support. Revenue growth with margin compression may point to discounting, higher delivery costs, unfavorable mix, or weaker operating leverage. A company growing with margin discipline usually carries a different revenue quality profile than one growing while profitability deteriorates.
Working Capital Discipline
The fifth area reviews whether growth requires more balance sheet support than expected. If working capital movement expands faster than revenue, the business may need more capital to support each dollar of growth, which reduces cash conversion and weakens the durability of reported sales. This check matters most when revenue growth looks strong but cash flow does not follow.
Final Revenue Quality Classification
The evidence is then organized into a revenue quality read using four categories:
- Supported Revenue Quality: Revenue growth is supported by cash flow, stable collections, margin discipline, and controlled working capital movement.
- Watchlist Revenue Quality: Growth remains acceptable, but one or two supporting indicators have started to weaken.
- Deteriorating Revenue Quality: Revenue growth is increasingly disconnected from cash collection, margin support, or working capital discipline.
- High-Risk Revenue Profile: Reported growth depends on weak collection quality, aggressive working capital expansion, margin deterioration, or poor cash realization.
These categories are designed to support analyst review, not act as automated verdicts. The classification narrows the question for the analyst, but the final read still depends on sector context, business model, and prior trends that no single review captures fully.
Running the Claude MCP Prompt
For this article, Salesforce provides a useful test case because its revenue model depends heavily on subscription contracts, deferred revenue, receivables, cash flow conversion, and margin discipline. That makes it a strong example for testing whether reported growth has accounting and operational support.
A basic revenue review would stop at year-over-year sales growth. This prompt asks Claude to go deeper by comparing revenue against cash collection, receivable expansion, deferred revenue movement, operating cash flow, margin behavior, and working capital discipline.
To keep the output useful for the article, the prompt also limits the response length. The goal is not to produce a long research report. The goal is to generate a compact revenue-quality interpretation and a simple visual summary that can be added directly to the article.
|
Use Financial Modeling Prep through MCP to evaluate revenue quality for Salesforce (CRM). Analyze the most recent annual or quarterly periods available through FMP. Use multi-period data where available. Retrieve and compare the following data through FMP: 1. Revenue growth 2. Accounts receivable movement 3. Deferred revenue or contract liability movement where available 4. Operating cash flow 5. Free cash flow 6. Gross margin and operating margin trends 7. Working capital movement 8. Profitability and efficiency metrics Do not create a generic company summary. Build a compact revenue quality review with the following sections: A. Financial Statement Scope - Company - Periods reviewed - FMP tools or datasets used - Financial statements retrieved B. Revenue Quality Findings For each key finding, provide: - Metric or disclosure area - What changed - Why it matters - Whether it supports or weakens reported revenue quality - Analyst interpretation C. Revenue Quality Matrix Create a compact article-ready visual matrix with these columns: - Test area - Evidence - Interpretation - Revenue quality impact - Review priority D. Article-Ready Visual Summary Create one simple visual representation that can be used in a Medium article. Preferred format: - a compact 2x2 matrix, or - a revenue quality dashboard-style summary, or - a simple classification grid The visual should summarize the main revenue quality checks such as: - Revenue growth - Cash realization - Receivable behavior - Deferred revenue support - Margin support - Working capital discipline Keep labels short, clear, and suitable for a screenshot. Do not make the visual too large or text-heavy. E. Final Revenue Quality Classification Classify the company into one of the following: - Supported Revenue Quality - Watchlist Revenue Quality - Deteriorating Revenue Quality - High-Risk Revenue Quality Explain the classification using cross-statement evidence. Keep the full response under 900 words. Focus only on article-useful findings. Avoid long tables. Avoid a long research memo. Use compact bullets only where needed. |
After running the prompt, Claude used FMP's financial statement tools to retrieve Salesforce's recent income statement, balance sheet, and cash flow statement data. The output reviewed six recent quarters and compared FY26 performance against FY25 to evaluate revenue growth, receivables, deferred revenue, operating cash flow, free cash flow, margins, and working capital behavior.
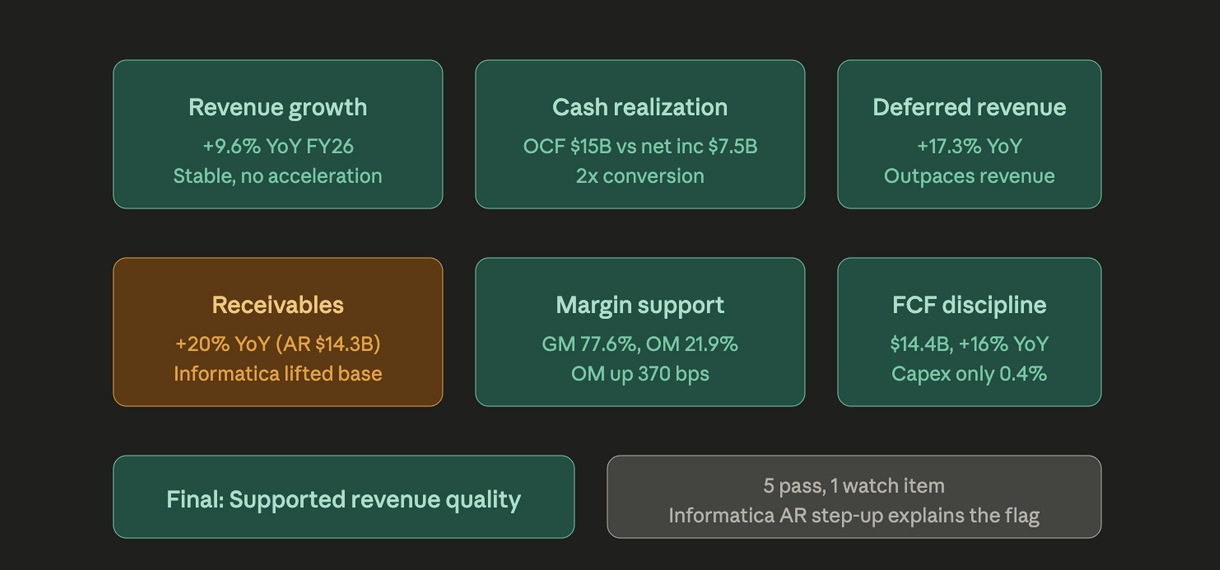
Claude also produced a compact revenue quality matrix and an article-ready visual summary. That visual layer helps convert cross-statement analysis into a format analysts can review quickly, without turning the article into a long financial statement walkthrough.
Interpreting the Claude Output
Claude classified Salesforce as Supported Revenue Quality because the cross-statement evidence mostly aligned. Revenue increased, cash conversion remained strong, deferred revenue grew faster than reported revenue, and margins improved without signs of operating stress.
That classification matters because it does not rely on revenue growth alone. The output tested whether Salesforce's reported growth was supported by cash flow, customer billings, receivables, margins, and working capital behavior. This creates a stronger accounting-quality view than a simple top-line growth review.
Cash Conversion Supports the Revenue Story
The strongest signal came from cash realization. Claude found that Salesforce generated about $15.0 billion in operating cash flow against roughly $7.5 billion in net income, creating a cash conversion ratio of about 2.0x. Free cash flow also exceeded net income, which shows that reported earnings converted into cash at a strong rate.
For revenue quality analysis, this is a major support point. When revenue growth comes with strong operating cash flow and free cash flow, the growth looks less dependent on accounting timing and more connected to real collections.
Deferred Revenue Adds Forward Support
Deferred revenue also strengthened the quality picture. Claude found that deferred revenue grew from $20.7 billion to $24.3 billion, or about 17.3% year over year, which outpaced Salesforce's revenue growth of about 9.6%.
That matters because deferred revenue gives analysts a view into contracted revenue visibility. When deferred revenue grows faster than recognized revenue, it suggests the business is not only reporting current-period growth but also building future revenue coverage.
For a subscription-heavy company like Salesforce, this is an important durability signal.
Receivables Remain the Main Watch Item
The one area that required monitoring was receivables. Claude found that accounts receivable increased by about 20% year over year, while revenue grew about 9.6%. DSO also moved from roughly 108 days to 115 days.
That would normally raise a collection-quality concern. If receivables consistently grow faster than revenue, analysts need to check whether customers are taking longer to pay or whether sales terms are becoming more flexible. This is where the cash conversion cycle becomes useful because it helps analysts connect collections, inventory, payables, and operating cash flow efficiency.
However, Claude did not classify this as a major deterioration signal. The output noted that Salesforce's Q4 billing cycle usually creates a receivables step-up, and the Informatica acquisition also added receivables to the consolidated balance sheet. That makes the receivable increase a monitoring item, not enough evidence for a weak revenue-quality classification.
Margins Confirm Operational Support
Margin behavior supported the final classification. Claude found that gross margin remained stable around 77.6%, while operating margin improved from 18.2% to 21.9%.
This helps validate the revenue story. If Salesforce were growing through heavy discounting, weak mix, or higher delivery costs, margin pressure would likely appear in the analysis. Instead, operating margin expansion suggests that growth came with operating leverage, which makes margin and efficiency trends an important part of revenue quality review.
That is why the output treated margins as supportive rather than a source of concern.
Final Revenue Quality Classification
The final classification of Supported Revenue Quality fits the evidence. Salesforce's revenue growth was not isolated from the rest of the financial statements. It came with strong cash conversion, deferred revenue growth, stable gross margin, expanding operating margin, and capital-light free cash flow generation.
The only watch item was receivables. Since the receivable increase had plausible explanations through Q4 billing seasonality and the Informatica acquisition, the output did not treat it as a deterioration signal.
This is the value of an integrated revenue quality system. It does not label growth as strong only because revenue increased. It checks whether the rest of the financial statements support that growth, then separates durable growth evidence from items that still need analyst monitoring.
Scaling Revenue Quality Review Across Coverage
The same revenue quality logic can run across a defined coverage universe each quarter. Instead of reviewing growth durability company by company, analysts can apply the same cross-statement checks across the issuers they actually cover, within the scope they have defined.
The review follows a consistent sequence. First, income statement data is pulled to measure reported growth. That growth is then compared with receivables, deferred revenue, operating cash flow, free cash flow, margins, working capital movement, and profitability metrics. The output applies the same four classifications across the coverage list, so a company in software can be compared against one in industrials on the same set of durability questions.
That consistency is where the analytical value sits. Every company gets tested against the same core questions: Is growth being collected? Is cash flow keeping pace? Are margins holding? Is working capital under control? Are future revenue indicators strengthening or weakening?
For enterprise teams, this reduces interpretation variability. One analyst may focus on margin trends while another focuses on cash flow. A consistent first review keeps that variability in check before analysts apply sector knowledge or company-specific judgment.
The output also supports a revenue quality watchlist. Companies with strong growth but weaker cash realization, faster receivable expansion, or margin compression can move into closer review. Companies with supported growth can remain under normal monitoring.
As coverage expands from one company to a broader watchlist, sector group, or defined coverage universe, teams need access levels that match their dataset, usage, and refresh requirements. FMP's pricing plans can be reviewed in that context.
The main value is consistency. A repeatable approach to revenue quality helps teams compare accounting durability across companies, periods, and sectors without rebuilding the analysis from scratch each quarter.
Where Revenue Quality Interpretation Needs Analyst Review
Revenue quality analysis can create a stronger first-review layer, but it still needs context. A single metric rarely proves that revenue quality is improving or deteriorating.
Receivables are a good example. Faster receivable growth can suggest slower collections or more flexible payment terms. But it can also reflect seasonality, large enterprise renewals, acquisitions, or normal billing cycles. Analysts should review the pattern across multiple periods before treating it as a quality concern.
Deferred revenue also depends on the business model. For subscription companies, rising deferred revenue can support future revenue visibility. For other companies, the same metric may carry less meaning or may not appear clearly in the balance sheet.
Cash flow can also move for reasons unrelated to revenue quality. One-time working capital changes, tax payments, acquisition costs, restructuring activity, or timing differences can distort operating cash flow in a single period.
Margins need similar caution. Margin compression may signal discounting or weaker operational support, but it may also reflect planned investment, product mix changes, or acquisition integration costs.
The system works best as an accounting-quality interpretation layer, not as a final verdict. It helps analysts identify where reported growth deserves trust, where it needs monitoring, and where financial statement evidence points to deeper review.
From Reported Growth to Revenue Quality Intelligence
Revenue growth becomes more useful when analysts can test what sits behind it. The reported number shows scale, but cash realization, receivable behavior, deferred revenue, margins, and working capital movement show whether that growth has financial quality.
Using FMP data through Claude MCP, analysts can connect these signals into one structured review. FMP provides the financial statement and metric data. MCP coordinates access across those datasets. Claude organizes the evidence into a revenue quality classification that can be reviewed across periods.
The Salesforce example shows how this works in practice. Reported growth looked stronger because cash flow, deferred revenue, margins, and free cash flow supported the revenue trend. At the same time, the receivable increase stayed visible as a monitoring item rather than disappearing inside a positive summary.
That balance is where the value sits. The review does not treat growth as good or bad in isolation. It tests whether growth is collectible, operationally supported, and financially durable, and gives analysts a consistent reference for that judgment.
For research teams, this creates a repeatable accounting-quality review. Instead of rebuilding the same checks each quarter, analysts can apply the same framework across companies, sectors, and reporting periods, and focus their time on the names where revenue quality needs closer attention.







