How to Detect Earnings Quality Erosion via Cash Flow Statement
Sep 03, 2025
Have you ever wondered why a company's stock plummets despite it reporting stellar earnings? In a volatile market, a company's reported profit can be a mirage.
The risk of earnings manipulation is higher than ever, and a savvy finance executive knows that the income statement doesn't always tell the full story. The cash flow statement is the ultimate lie detector, revealing where reported earnings diverge from economic reality—a critical insight for CFOs, CIOs, and strategy heads who need to protect capital and mitigate risk.
Why Earnings Quality is More Than Just EPS
The concept of “earnings quality” extends beyond the bottom-line accounting profit. It is a measure of how well a company's reported earnings reflect its actual cash-generating ability.
While a high net income might look impressive, it can be misleading if it relies on accrual-based accounting assumptions rather than real cash inflows. Common pitfalls include aggressive revenue recognition, which records future sales as current income, or the use of share buybacks to artificially inflate EPS (Earnings Per Share).
As markets become more discerning, investors are quick to penalize companies with low-quality earnings. This is why it is critical to know how to deconstruct a financial statement to reveal hidden risks.
The Cash Flow Statement's Role in Detecting Earnings Risk
The cash flow statement is the most reliable financial document for discerning a company's true economic health. It tracks the real movement of cash through operations, investing, and financing. Unlike accrual accounting, which records revenue and expenses when they are incurred, the cash flow statement deals in hard numbers.
This is why a company with strong net income but weak operating cash flow (OCF) often signals earnings quality erosion. This disconnect suggests that reported profits are not converting into actual cash, indicating a business is struggling to sustain its growth with organic cash generation.
Red Flags of Earnings Quality Erosion in Cash Flows
Detecting earnings quality issues requires a deeper analysis beyond superficial headlines. While a company's financial statements may not always present a perfect picture, a careful review of key metrics can reveal a lot. It is crucial to look for specific warning signs and to interpret them within the context of a company's overall strategy and market environment. To move from theory into practice, we'll use the FMP Cash Flow Statement API to show how these red flags surface in real company data. By pulling operating cash flow, net income, and capital expenditures directly, investors can systematically track signals of earnings quality erosion instead of relying on surface-level headlines.
Declining Operating Cash Flow Despite Rising Net Income
A significant warning sign is a persistent widening of the gap between a company's net income and its operating cash flow. This often suggests that management is using creative accounting practices to boost reported profits without a corresponding increase in real cash.
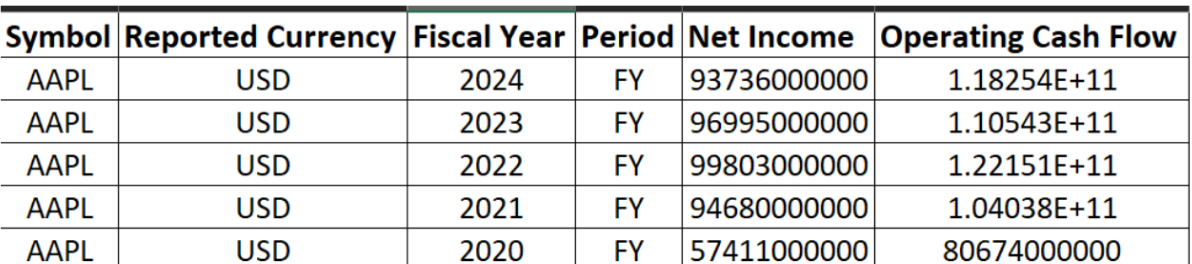
A quick call to the FMP Cash Flow Statement API to check a company like Apple (AAPL) reveals the opposite. The FMP data shows that Apple's operating cash flow consistently exceeds its net income, a powerful signal of high-quality earnings.
For example, in 2023, Apple's OCF was over $110 billion, while its net income was approximately $97 billion. This consistent outperformance demonstrates that Apple's earnings are not just theoretical profits but are backed by a robust and efficient cash-generating business model.
Declining Operating Cash Flow Despite Rising Net Income
When operating cash flow (OCF) consistently lags behind net income, it's a warning that reported earnings may not be backed by real cash generation. This often points to aggressive accounting tactics or unsustainable earnings quality.
What to watch for
Focus on the relationship between OCF and net income over time. A persistent gap suggests earnings inflation, while steady alignment signals strength. Tracking these trends across multiple quarters is more reliable than a single-period snapshot.
Apple example
A quick check with the FMP Cash Flow Statement API shows the opposite case for Apple (AAPL). In 2023, Apple's OCF exceeded $110B, compared to net income of ~$97B. That consistent outperformance demonstrates earnings quality: Apple's profits are not just accounting entries but are strongly supported by cash from operations.
Unsustainable Financing Activities
A heavy dependence on external financing whether through issuing new debt or equity to fund core activities like operations, dividends, or share buybacks is a major red flag. When these activities aren't supported by operating cash flow, it suggests a company is propping up shareholder returns at the cost of long-term stability.
If financing inflows are consistently required to maintain dividends or buybacks, the business model may be unsustainable. It often points to weak internal cash generation or a growing debt burden.
What to watch for
Look at trends in net debt issuance relative to operating cash flow. A persistent increase in debt paired with large shareholder distributions is a warning sign. Healthy companies tend to reduce debt over time while funding returns to shareholders directly from operations.
Apple example
FMP's Cash Flow Statement API shows that Apple spent ~$77B on share repurchases in 2023. Yet, instead of raising debt to cover this, the company reported negative net debt issuance over the last five years. This means Apple is simultaneously buying back stock and paying down debt—clear evidence of financial strength rather than desperation.
Capex Manipulation
Some companies cut back on capital expenditures (Capex) to inflate free cash flow in the short term. While this may boost near-term numbers, underinvestment in infrastructure, R&D, or technology erodes long-term competitiveness and signals management is prioritizing optics over strategy.
Unusually low Capex relative to industry peers or a company's historical averages is often a red flag. It can mean leadership is sacrificing future growth to meet short-term earnings or cash flow targets.
What to watch for
Track Capex trends over multiple years, not just one. A sudden drop in Capex without a strategic reason (e.g., completed major project) should raise concern. Compare Capex as a percentage of revenue or operating cash flow to assess whether investment levels are sustainable.
Apple example
According to FMP's Cash Flow Statement API, Apple has consistently invested between $9B and $11B annually in Capex. This steady spending signals a commitment to innovation and infrastructure. Rather than slashing Capex to artificially boost free cash flow, Apple's management demonstrates long-term focus and reinvestment discipline.
How to Track Earnings Quality Trends Over Time
The real value of cash flow analysis emerges when you track trends over multiple periods. By analyzing how a company's cash flow metrics change from quarter to quarter and year to year, you can identify patterns that indicate whether its financial health is improving or deteriorating. Professionals can monitor the consistency of Free Cash Flow and analyze reinvestment trends.
Using the FMP Cash Flow Statement Growth API, a quant lead can quickly assess a company's cash flow growth rates over the last five years. For instance, if a company's operating cash flow growth has slowed or turned negative, but its net income continues to climb, this stark divergence serves as a powerful predictive signal for future performance issues. This kind of systematic, data-driven analysis is crucial for building robust predictive models and proactive risk management systems.
Strategic Applications for Finance Leaders
The ability to analyze cash flow data is a powerful asset for any finance executive. Here is how strategic thinkers can apply these insights:
- For CFOs: By monitoring operating cash flow, a CFO can spot inefficiencies early on, enabling them to improve margin defense and ensure that reported profits are a true reflection of the company's operational health. Proactive analysis helps in making better capital allocation decisions, ensuring funds are directed to projects with the highest potential for cash-based ROI (Return on Investment).
- For CIOs & Portfolio Managers: For those managing large portfolios, avoiding “earnings traps” is paramount. Integrating cash flow metrics into your due diligence process allows you to de-risk your investments by focusing on companies with sustainable, cash-backed earnings.
- For Strategy Heads: Cash flow data provides a powerful tool for competitive intelligence. By analyzing a competitor's Capex trends, a head of strategy can predict where they are investing for the future. Are they aggressively investing in new technology? Are they holding back on R&D? These insights can help you anticipate market share shifts and develop a more robust competitive strategy.
- For Quant Teams: For quantitative analysts, cash flow-based metrics can be powerful new signals. Building models that incorporate the OCF-to-Net Income ratio, free cash flow consistency, or capital expenditure trends can yield predictive insights into a stock's future performance.
Transforming Cash Flow Analysis into a Strategic Edge
The real value of cash flow analysis isn't in a one-off insight it's in making the process systematic. By embedding cash flow checks into your regular workflow, you create a durable framework for separating real earnings strength from accounting smoke and mirrors.
Think of it as a financial lie detector you can run on repeat:
- Track OCF-to-Net Income every quarter. A widening gap flags aggressive accounting, while consistent alignment signals true earnings power.
- Monitor Financing Activities to see whether dividends, buybacks, or debt reduction are powered by internal cash or external borrowing.
- Review Capex Commitments as a forward-looking gauge. Stable investment signals long-term competitiveness, while sudden drops may suggest management is propping up free cash flow at the expense of future growth.
That repeatability is what turns raw financials into a durable signal: not just knowing when to react, but building a proactive system that keeps you ahead of the curve.
To gain a significant edge in your analysis, we encourage you to leverage robust, real-time data platforms. For consistent, high-fidelity monitoring, leverage APIs like the FMP Cash Flow Statement endpoints. By automating your data retrieval and analysis, you can move from reactive due diligence to proactive, insight-driven strategy. For more on this, consider exploring our article on how to deconstruct an income statement to reveal hidden risks.
FAQs
What is the best ratio for measuring earnings quality?
The Operating Cash Flow-to-Net Income ratio is a widely used and highly effective metric for measuring earnings quality. A ratio consistently above 1.0 indicates that a company's reported profits are well-supported by cash from core business activities, signaling strong earnings quality. A ratio consistently below 1.0, on the other hand, is a warning sign.
Can companies manipulate operating cash flows?
While it is significantly harder to manipulate operating cash flow (OCF) than net income, it is not impossible. Companies can distort OCF by aggressively managing the timing of payments to suppliers (delaying payments) or accelerating collections from customers. However, these are typically short-term maneuvers and are difficult to sustain over multiple periods without detection.
Why is free cash flow important for detecting earnings risk?
Free Cash Flow (FCF) provides a clearer picture of the cash truly available to a company after covering all of its operating expenses and the capital expenditures (Capex) needed to maintain or expand its asset base. It reveals the money a company has left over for reinvesting in growth, paying dividends, or reducing debt without having to resort to external financing. A declining or volatile FCF is a strong indicator of earnings risk.
How can a CFO use cash flow data to improve margin optimization?
By analyzing the cash flow from operations, a CFO can identify and address cash inefficiencies early on. For example, a decline in OCF might highlight issues with supply chain management, inventory buildup, or accounts receivable all of which directly impact a company's operating margins. Addressing these issues can help improve the company's true cash-based profitability.
What does a high level of share buybacks indicate for a company's cash flow?
A high level of share buybacks funded by cash from operations can be a positive signal, indicating that the company is confident in its future cash flow and sees its stock as undervalued. However, if the buybacks are funded by taking on new debt, it can be a significant red flag, suggesting management is using financial engineering to artificially inflate EPS without a corresponding increase in true cash generation.
How does this fit into an existing due diligence or quant workflow?
The framework isn't designed to replace your current process, it's built to strengthen it. For fundamental teams, OCF-to-Net Income alignment, Capex consistency, and Free Cash Flow trends can be layered in as checkpoints alongside traditional ratio analysis, management guidance, and industry comps. For quant teams, these same signals can be codified into factor models, screens, or backtests turning qualitative red flags into measurable, repeatable inputs. By embedding cash flow analysis directly into your due diligence or quant workflows, you build a systematic layer of protection against earnings traps, transforming what is often a one-off red flag into a durable, repeatable signal.
How do quant teams use cash flow data in their models?
Quant teams use cash flow data to build a variety of predictive signals. They might use metrics like the OCF-to-Net Income ratio, free cash flow consistency, or cash flow growth as factors in their models. These signals are often seen as less susceptible to accounting manipulation than traditional earnings metrics, providing a more reliable foundation for algorithmic trading strategies.

Top 5 Defense Stocks to Watch during a Geopolitical Tension
In times of rising geopolitical tension or outright conflict, defense stocks often outperform the broader market as gove...

Circle-Coinbase Partnership in Focus as USDC Drives Revenue Surge
As Circle Internet (NYSE:CRCL) gains attention following its recent public listing, investors are increasingly scrutiniz...

LVMH Moët Hennessy Louis Vuitton (OTC:LVMUY) Financial Performance Analysis
LVMH Moët Hennessy Louis Vuitton (OTC:LVMUY) is a global leader in luxury goods, offering high-quality products across f...

