FMP
The Hidden Balance Sheet Signals That Predict Credit Stress Six Months Early
Dec 23, 2025
Credit ratings are lagging indicators. By the time a major agency downgrades a capital-intensive issuer, the smart money has often already widened spreads or exited the position entirely. The real alpha in credit risk management and the necessary protection for corporate treasuries lies in identifying the deterioration of fundamentals before it becomes a headline.
We typically observe a six-to-nine-month lag between the onset of quantitative decay in the balance sheet and the resulting market repricing. This window is where analysts must operate. We are not looking for obvious insolvency; we are looking for the subtle decoupling of cash flow from reported earnings, the quiet extension of payables, and the erosion of fixed charge coverage that persists despite "adjusted" EBITDA growth.
This analysis details the specific, often overlooked, structural signals within financial statements that precede a credit event. We will examine how to isolate these metrics using direct financial data and how to distinguish temporary working capital friction from structural liquidity failure.
The Divergence Between Operating Cash Flow and EBITDA
The most reliable early warning signal of credit stress is a sustained divergence between EBITDA and Operating Cash Flow (OCF). Market participants often fixate on EBITDA as a proxy for debt service capability, but EBITDA is an accounting construct that ignores working capital intensity. When a company reports stable earnings but contracting OCF, the quality of earnings is degrading.
Tracking the Cash Flow Trajectory
We can clearly observe this deterioration in the 2024 fiscal data for Boeing (BA). Boeing serves as an instructive example for this framework given its high capital intensity, long production cycles, and complex supplier dependence. Used here as an illustrative case study regarding structural mechanics rather than a predictive credit call, the data highlights how liquidity strain can bypass the P&L.
While the company remains a dominant industrial player, the cash flow statement reveals a severe liquidity strain that bypasses the P&L. According to the Cash Flow Statement API, the company reported Net Cash Provided by Operating Activities of negative 12.08 billion dollars for the period.
This was not an isolated event but the culmination of a trajectory. Analyzing the "Change in Working Capital" line item reveals a massive outflow of 8.76 billion dollars in a single year.
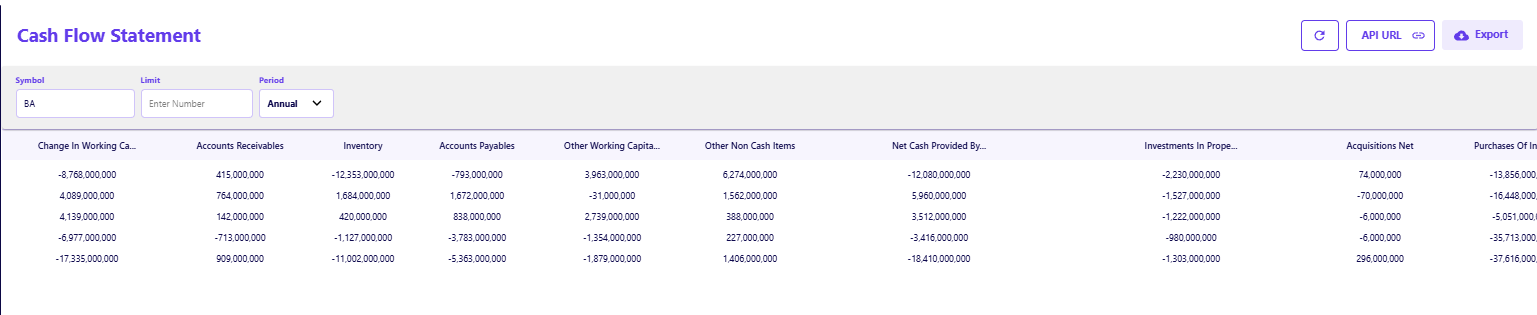
- When working capital consumes cash at this magnitude while Net Income is also negative (-11.8 billion), the business is effectively funding operations through external capital, not revenue.
- Analysts must programmatically monitor the spread between EBITDA and OCF. A divergence widening beyond 20 percent for two consecutive quarters is a distinct sell signal.For CFOs and risk teams, operationalizing this metric involves flagging sustained EBITDA-to-OCF divergence in dashboards to trigger early covenant monitoring or revised scenario planning models.
Analyzing the Quality of Working Capital
Liquidity stress rarely appears as a sudden cash shortage; it usually manifests first as a distortion in the cash conversion cycle. By analyzing the balance sheet structure, we can spot when a company begins to have trouble collecting cash or is forced to delay payments to suppliers.
The Payables-to-Receivables Spread
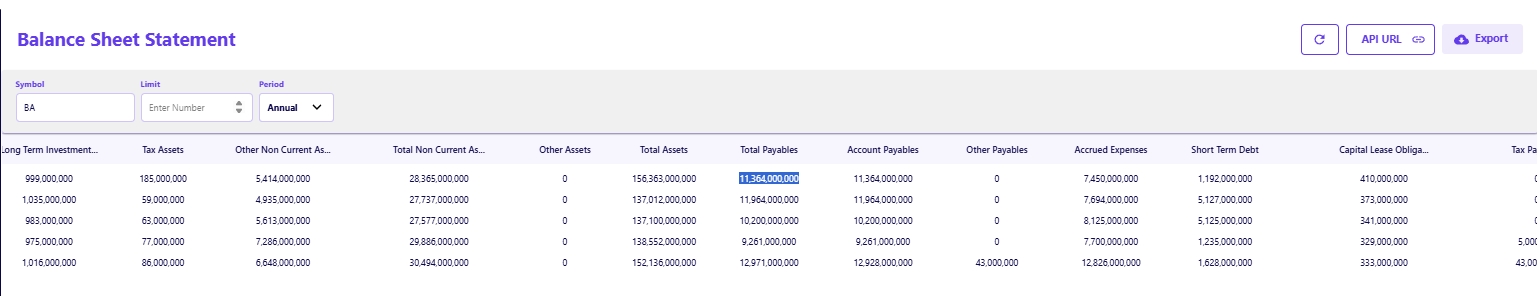
To detect these distortions, we rely on the Balance Sheet Statement API to track the raw components of current liabilities and assets. For Boeing in 2024, the data shows Total Payables of 11.36 billion dollars. When compared against Net Receivables of 11.2 billion dollars, we see a tight liquidity band.
In a distressed profile, we often see a "stretching" phenomenon:
- Payables Extension: If payables rise significantly while revenue is flat, the company is using suppliers as a line of credit.
- Receivables Aging: If receivables swell without a corresponding sales increase, it indicates collections are failing.
By monitoring the ratio of Payables to Receivables through the Balance Sheet Statement API, analysts can identify when a company is artificially supporting its cash balance by withholding payments. A ratio that deviates more than 15 percent from the three-year historical mean is a reliable indicator of internal liquidity stress.Treasury teams can incorporate these deviations into automated alerts for short-term liquidity forecasting, ensuring that internal stress tests reflect the reality of working capital friction.
Interest Coverage and the Refinancing Wall
Standard interest coverage ratios (EBIT/Interest Expense) are insufficient in a high-rate environment because they look backward. The true stress test involves monitoring the Interest Burden and the Capex Coverage simultaneously.
Calculating the True Interest Burden
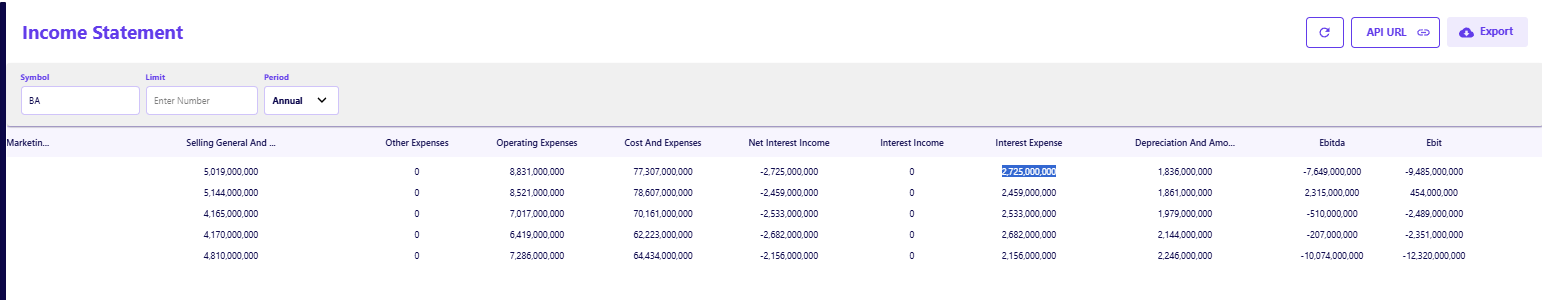
We utilized the Income Statement API to analyze the debt service capacity. In 2024, the data shows an Interest Expense of 2.72 billion dollars against an EBIT of negative 9.48 billion dollars. This results in a negative interest coverage ratio.
However, the "Refinancing Wall" signal often appears before the coverage turns negative. By tracking the Interest Burden (Interest Expense / Revenue), we can see the creeping cost of capital.
- In 2021, Interest Expense was $2.68B against Revenue of $62.2B (4.3% burden).
- In 2024, Interest Expense hit $2.72B against Revenue of $66.5B.
- While the burden percentage seems stable, the absolute inability to cover it with operating cash flow creates a solvency gap.
Finance leaders must run pro-forma stress tests: if the 2025 maturities are refinanced at current rates, does the interest coverage ratio breach covenant levels? For this issuer,the data suggests the breach has already occurred on a fundamental basis.To strengthen enterprise usability, finance leaders should apply this insight operationally by running pro-forma refinancing scenarios, monitoring covenant thresholds, and stress-testing interest burden assumptions within internal planning models.
Access accurate financial modeling data through the FMP API suite to automate your risk dashboards.
The Role of Capex in Masking Solvency
In capital-intensive sectors, companies facing liquidity stress will often underinvest in their asset base to preserve cash. This creates a "zombie" profile where Free Cash Flow looks artificially supported because the company is effectively liquidating its future.
Identifying Underinvestment Signals
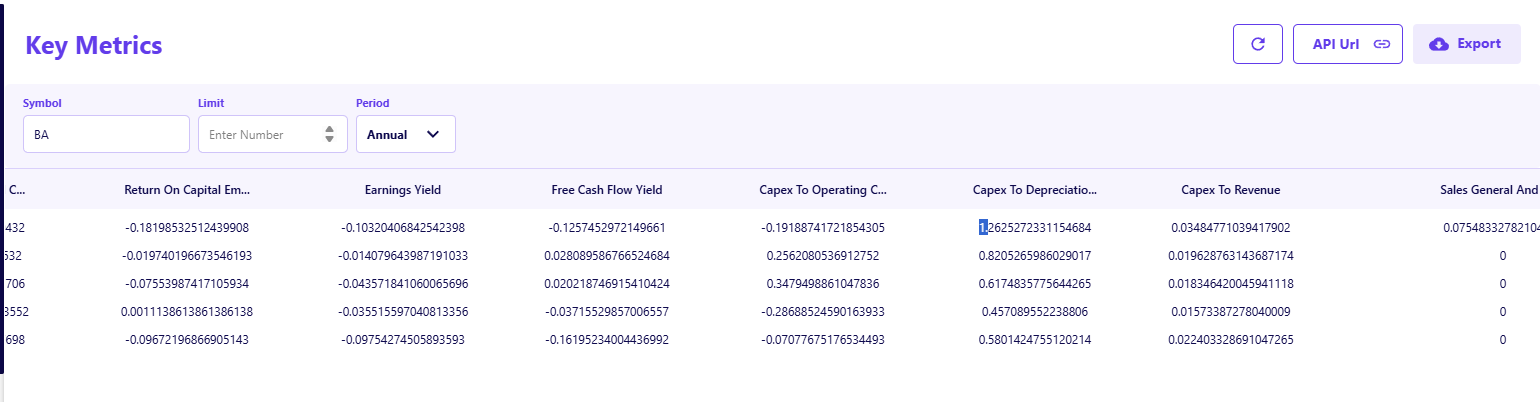
Using the Key Metrics API, we analyzed the Capex to Depreciation ratio for Boeing over a multi-year period to identify this pattern.
- 2021: 0.45
- 2022: 0.61
- 2023: 0.82
- 2024: 1.26
The years 2021 and 2022 show a ratio deeply below 1.0 (0.45 and 0.61). This was the early warning signal. For two years, the company invested roughly half of what was required just to replace depreciating assets. This "savings" inflated the cash balance temporarily but eroded the operational base. A robust risk model would have flagged the 0.45 ratio in 2021 as a harbinger of future operational stress.
Macro-Economic Sensitivity and Rate Transmission
Finally, internal balance sheet signals must be contextualized against the macro environment. The transmission mechanism of monetary policy implies that companies with floating-rate debt or imminent maturities are immediately sensitive to changes in the Federal Funds Rate.
Overlaying Macro Indicators
To execute this overlay, analysts can use the Economics API to retrieve real-time data on key indicators like FederalFunds, CPI, and UnemploymentRate.
For a detailed guide on building these stress tests, refer to Scenario Planning Dashboards with FMP Macro Data. This guide explains how to integrate macro data into your dashboards to stress-test internal KPIs against external shocks, ensuring your planning models reflect the reality of a "higher-for-longer" rate environment.
By correlating these external datasets with internal company fundamentals, we can model sensitivity:
- Interest Rate Sensitivity: By pulling the FederalFunds rate from the Economics API and applying it to the floating-rate portion of the debt found in the balance sheet, we can project the incremental interest expense for the coming quarter.
- Input Cost Pressure: Tracking CPI allows analysts to forecast margin compression for issuers with low pricing power.
A robust risk model incorporates this external economic data to adjust internal forecasts. If the macro indicators suggest a "higher-for-longer" rate environment, the refinancing walls identified in previous sections become immediate solvency threats rather than distant risks.
Operationalizing Fundamental Data for Risk Strategy
The value of fundamental data is not in confirming what the market already knows, but in revealing the stress fractures that have not yet triggered a repricing event. As demonstrated, the path to a credit event is rarely sudden; it is paved with specific, observable deviations: the divergence of cash flow from earnings, the quiet extension of payables, and the strategic deferral of maintenance capital.
For finance leaders and risk strategists, the imperative is to shift from reactive monitoring to predictive modeling. By integrating direct API feeds into credit dashboards, teams can automate the detection of these "hidden" signals flagging a rising DPO or a falling Capex ratio six months before a ratings outlook changes.
This approach transforms the balance sheet from a static report into a dynamic early-warning system. In a market environment defined by cost-of-capital volatility, the ability to anticipate liquidity stress through structured fundamentals is the definitive edge in preserving capital and avoiding default risk.
Frequently Asked Questions
What is the most critical early warning signal for credit stress?
The divergence between EBITDA and Operating Cash Flow (OCF). If EBITDA is stable but OCF is declining or negative, it indicates that earnings quality is poor and the company is struggling to convert revenue into actual cash.
Why is Capex to Depreciation a solvency signal?
A ratio consistently below 1.0 means a company is underinvesting in its business. While this saves cash in the short term, it leads to long-term operational decay. We saw this with ratios of 0.45 and 0.61 in the years preceding the current liquidity strain.
How does a spike in DSO predict liquidity failure?
A sharp increase in Days Sales Outstanding (like the jump from 51.9 to 61.5 days observed in the data) means the company is failing to collect cash from customers efficiently. This creates a working capital hole that must be plugged with expensive external debt.
What is the "Interest Burden" and why does it matter?
Interest Burden measures interest expense as a percentage of revenue or EBITDA. It matters because even if a company has cash, a rising burden (due to refinancing at higher rates) eats into the margins required to fund operations and growth.
Can a company have positive Net Income but still be high risk?
Yes. Net Income includes non-cash items and accruals. A company can show profit on paper while bleeding cash due to inventory build-ups (like the $5B increase observed here) or uncollected receivables, eventually leading to insolvency.
How do I automate the detection of these signals?
You can use APIs like the Key Metrics API to programmatically pull ratios like DPO, DSO, and Capex/Depreciation across your coverage universe and set alerts for standard deviations outside the historical mean.

WACC vs ROIC: Evaluating Capital Efficiency and Value Creation
Introduction In corporate finance, assessing how effectively a company utilizes its capital is crucial. Two key metri...

BofA Sees AI Capex Boom in 2025, Backs Nvidia and Broadcom
Bank of America analysts reiterated a bullish outlook on data center and artificial intelligence capital expenditures fo...

Pinduoduo Inc. (PDD) Q1 2025 Earnings Report Analysis
Pinduoduo Inc., listed on the NASDAQ as PDD, is a prominent e-commerce platform in China, also operating internationally...

