
FMP
Pulmonx Corporation
LUNG
NASDAQ
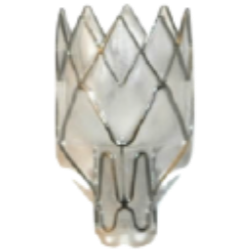
Pulmonx Corporation, a medical technology company, provides minimally invasive devices for the treatment of chronic obstructive pulmonary diseases. It offers Zephyr Endobronchial Valve, a solution for the treatment of bronchoscopic in adult patients with hyperinflation associated with severe emphysema; and Chartis Pulmonary Assessment System, a balloon catheter and console system with flow and pressure sensors that are used to assess the presence of collateral ventilation. The company also provides StratX Lung Analysis Platform, a cloud-based quantitative computed tomography analysis service that offers information on emphysema destruction, fissure completeness, and lobar volume to help identify target lobes for the treatment with Zephyr Valves. It serves emphysema patients in the United States, Europe, the Middle East, Africa, the Asia-Pacific, and internationally. The company was formerly known as Pulmonx and changed its name to Pulmonx Corporation in December 2013. Pulmonx Corporation was incorporated in 1995 and is headquartered in Redwood City, California.
7.61 USD
0.11 (1.45%)
DuPont Analysis
The DuPont analysis, pioneered by the DuPont Corporation, offers a structured approach to assessing fundamental performance. It involves breaking down the return on equity (ROE) into various components, aiding investors in comprehending the factors influencing a company's returns.
ROE = Net Income / Average Total Equity
ROE = (Net Income / Sales) * (Revenue / Average Total Assets) * (Average Total Assets / Average Total Equity)
The company's tax burden is (Net income ÷ Pretax profit). This is the proportion of the company's profits retained after paying income taxes. [NI/EBT] The company's interest burden is (Pretax income ÷ EBIT). This will be 1.00 for a firm with no debt or financial leverage. [EBT/EBIT] The company's operating income margin or return on sales (ROS) is (EBIT ÷ Revenue). This is the operating income per dollar of sales. [EBIT/Revenue] The company's asset turnover (ATO) is (Revenue ÷ Average Total Assets). The company's equity multiplier is (Average Total Assets ÷ Average Total Equity). This is a measure of financial leverage. Profitability (measured by profit margin) Asset efficiency (measured by asset turnover) Financial leverage (measured by equity multiplier)


