FMP
Unlocking Financial Clarity: Introducing the Open-Source Finance Toolkit Powered by FMP
Sep 17, 2025(Last modified: Oct 20, 2025)
While browsing a variety of websites, I repeatedly observed significant fluctuations in the same financial metric among different sources. Similarly, the reported financial statements often didn't line up, and there was limited information on the methodology used to calculate each metric.
Take Microsoft's Price-to-Earnings (PE) ratio on May 6, 2023, for example. Depending on where you look, you'll see numbers like:
- 28.93 (Stockopedia)
- 32.05 (Morningstar)
- 32.66 (Macrotrends)
- 33.09 (Finance Charts)
- 33.66 (Y Charts)
- 33.67 (Wall Street Journal)
- 33.80 (Yahoo Finance)
- 34.4 (Companies Market Cap).
They're all technically correct, but each site uses its own way of calculating the ratio, which explains the differences. If you just grab numbers from different places, you might end up confused or misled, especially since many sites don't explain how they get their results (and sometimes you need to pay to see their methods).
That's why I created the Finance Toolkit. It's open-source and lays out over 150 financial ratios, indicators, and performance measures in a clear, straightforward way. You can see exactly how everything is calculated, so you don't have to rely on mysterious numbers from other providers. With access to any company's financial statements, you can run your own calculations and stick to consistent, easy-to-understand formulas.
A key part of the Finance Toolkit's power is its data source: FinancialModelingPrep. This platform provides over 30 years of annual and quarterly financial statements for thousands of companies, with especially strong coverage of US-listed stocks. Whether you're just starting out or need data for advanced analysis, FinancialModelingPrep offers a generous free plan and affordable paid options.
Want to try it out? You can get an API key here with a 15% discount-plus, you'll be supporting the Finance Toolkit project!
Getting Started
To install the Finance Toolkit, simply run:

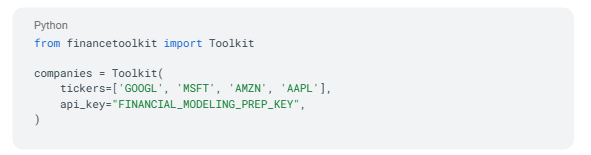
Then, initialize it in Python:
Below, I'll discuss the core features of the Finance Toolkit. If you wish to see more examples, visit the Finance Toolkit GitHub repository, where you'll find detailed examples and visualizations.
What Can You Do With the Finance Toolkit?
The Finance Toolkit is designed to make financial analysis transparent, consistent, and accessible for everyone—from individual investors to professional analysts. Whether you're looking to dive deep into a company's fundamentals, compare performance across sectors, or build your own custom dashboards, the Toolkit provides all the tools you need in one place.
Below, I'll walk you through just a handful of the Finance Toolkit's standout features—complete with real data, interactive tables, and eye-catching visualizations to help you get the most out of your analysis. This is only a small sample of what's possible! The Toolkit includes dozens more capabilities and metrics than I can show here. For the full rundown of everything it offers, check out the complete list here.
Historical Data
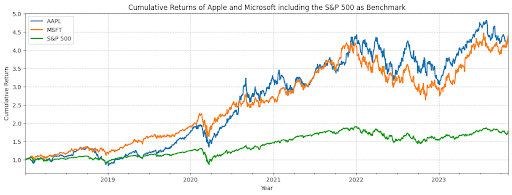
Tracking historical market data is essential for understanding trends, volatility, and performance over time. With the Finance Toolkit, you can easily pull daily, weekly, monthly, or yearly data for any listed company. This includes OHLC prices, trading volumes, dividends, returns, cumulative returns, and volatility calculations—all with a single line of code.

For example, here's a snapshot of Apple's historical data:
|
date |
Open |
High |
Low |
Close |
Adj Close |
Volume |
Dividends |
Return |
Volatility |
Excess Return |
Excess Volatility |
Cumulative Return |
|---|---|---|---|---|---|---|---|---|---|---|---|---|
|
2018-01-02 |
42.54 |
43.075 |
42.315 |
43.065 |
40.78 |
1.02224e+08 |
0 |
0 |
0.0202 |
-0.0067 |
0.0233 |
1 |
|
2018-01-03 |
43.1325 |
43.6375 |
42.99 |
43.0575 |
40.77 |
1.17982e+08 |
0 |
-0.0002 |
0.0202 |
-0.0247 |
0.0233 |
0.9998 |
|
2018-01-04 |
43.135 |
43.3675 |
43.02 |
43.2575 |
40.96 |
8.97384e+07 |
0 |
0.0047 |
0.0202 |
-0.0198 |
0.0233 |
1.0044 |
|
2018-01-05 |
43.36 |
43.8425 |
43.2625 |
43.75 |
41.43 |
9.46401e+07 |
0 |
0.0115 |
0.0202 |
-0.0133 |
0.0233 |
1.0159 |
|
2018-01-08 |
43.5875 |
43.9025 |
43.4825 |
43.5875 |
41.27 |
8.22711e+07 |
0 |
-0.0039 |
0.0202 |
-0.0287 |
0.0233 |
1.012 |
Cumulative returns can be visualized alongside benchmarks like the S&P 500, helping you see how your investments stack up against the market:
Financial Statements
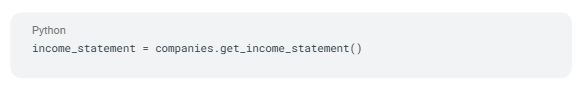
Digging into financial statements is the foundation of any serious analysis. The Toolkit lets you access annual or quarterly income statements, balance sheets, and cash flow statements for thousands of companies. This means you can track revenue growth, profitability, R&D spending, and much more—without relying on third-party aggregators.
|
2017 |
2018 |
2019 |
2020 |
2021 |
2022 |
2023 |
|
|---|---|---|---|---|---|---|---|
|
Revenue |
2.29234e+11 |
2.65595e+11 |
2.60174e+11 |
2.74515e+11 |
3.65817e+11 |
3.94328e+11 |
3.83285e+11 |
|
Cost of Goods Sold |
1.41048e+11 |
1.63756e+11 |
1.61782e+11 |
1.69559e+11 |
2.12981e+11 |
2.23546e+11 |
2.14137e+11 |
|
Gross Profit |
8.8186e+10 |
1.01839e+11 |
9.8392e+10 |
1.04956e+11 |
1.52836e+11 |
1.70782e+11 |
1.69148e+11 |
|
Gross Profit Ratio |
0.3847 |
0.3834 |
0.3782 |
0.3823 |
0.4178 |
0.4331 |
0.4413 |
|
Research and Development Expenses |
1.1581e+10 |
1.4236e+10 |
1.6217e+10 |
1.8752e+10 |
2.1914e+10 |
2.6251e+10 |
2.9915e+10 |
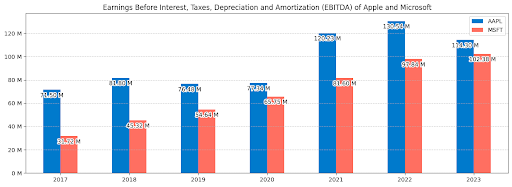
You can also visualize trends like EBITDA for Apple and Microsoft, making it easy to spot patterns and outliers:
Financial Ratios
Ratios are the backbone of comparative analysis. The Finance Toolkit calculates over 50 profitability ratios using your own financial statements, so you can benchmark companies on metrics like gross margin, operating margin, net profit margin, and more.
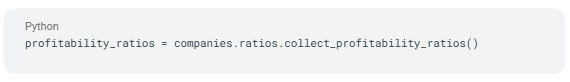
For example, here are some of Microsoft's ratios:
|
2017 |
2018 |
2019 |
2020 |
2021 |
2022 |
2023 |
|
|---|---|---|---|---|---|---|---|
|
Gross Margin |
0.6191 |
0.6525 |
0.659 |
0.6778 |
0.6893 |
0.684 |
0.6892 |
|
Operating Margin |
0.2482 |
0.3177 |
0.3414 |
0.3703 |
0.4159 |
0.4206 |
0.4177 |
|
Net Profit Margin |
0.2357 |
0.1502 |
0.3118 |
0.3096 |
0.3645 |
0.3669 |
0.3415 |
|
Interest Coverage Ratio |
13.9982 |
16.5821 |
20.3429 |
25.3782 |
34.7835 |
47.4275 |
52.0244 |
|
Income Before Tax Profit Margin |
0.2574 |
0.3305 |
0.3472 |
0.3708 |
0.423 |
0.4222 |
0.4214 |
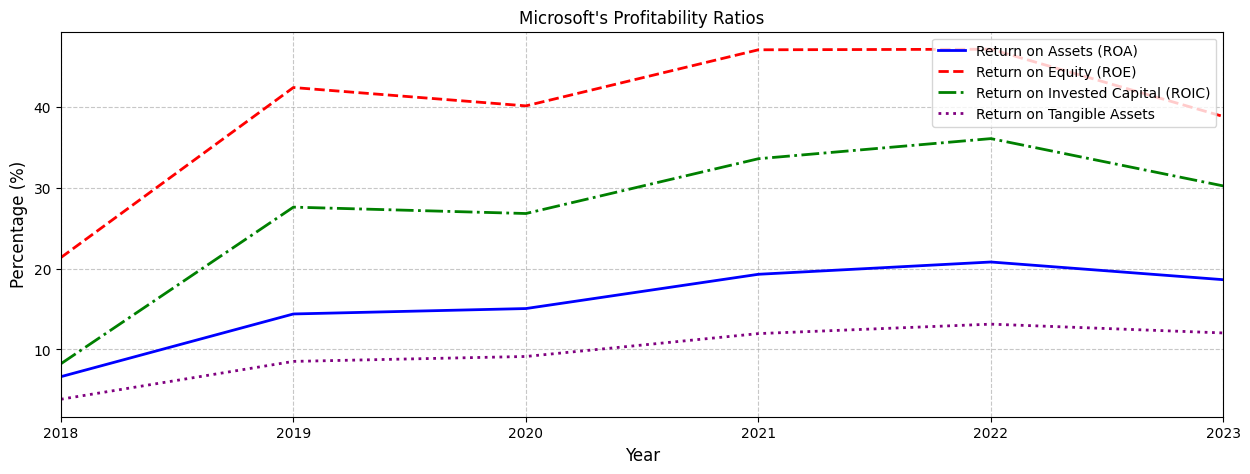
Visualize profitability ratios over time to see how companies improve or struggle:
Financial Models
Go beyond basic ratios with advanced models like Extended DuPont Analysis, Enterprise Value Breakdown, WACC, Altman Z-Score, and more. These models help you understand the drivers behind returns and risk, and are invaluable for deeper research or investment decision-making.
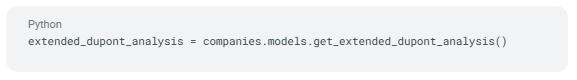
Here's Apple's Extended DuPont Analysis:
|
2017 |
2018 |
2019 |
2020 |
2021 |
2022 |
2023 |
|
|---|---|---|---|---|---|---|---|
|
Interest Burden Ratio |
0.9572 |
0.9725 |
0.9725 |
0.988 |
0.9976 |
1.0028 |
1.005 |
|
Tax Burden Ratio |
0.7882 |
0.8397 |
0.8643 |
0.8661 |
0.869 |
0.8356 |
0.8486 |
|
Operating Profit Margin |
0.2796 |
0.2745 |
0.2527 |
0.2444 |
0.2985 |
0.302 |
0.2967 |
|
Asset Turnover |
nan |
0.7168 |
0.7389 |
0.8288 |
1.0841 |
1.1206 |
1.0868 |
|
Equity Multiplier |
nan |
3.0724 |
3.5633 |
4.2509 |
5.255 |
6.1862 |
6.252 |
|
Return on Equity |
nan |
0.4936 |
0.5592 |
0.7369 |
1.4744 |
1.7546 |
1.7195 |
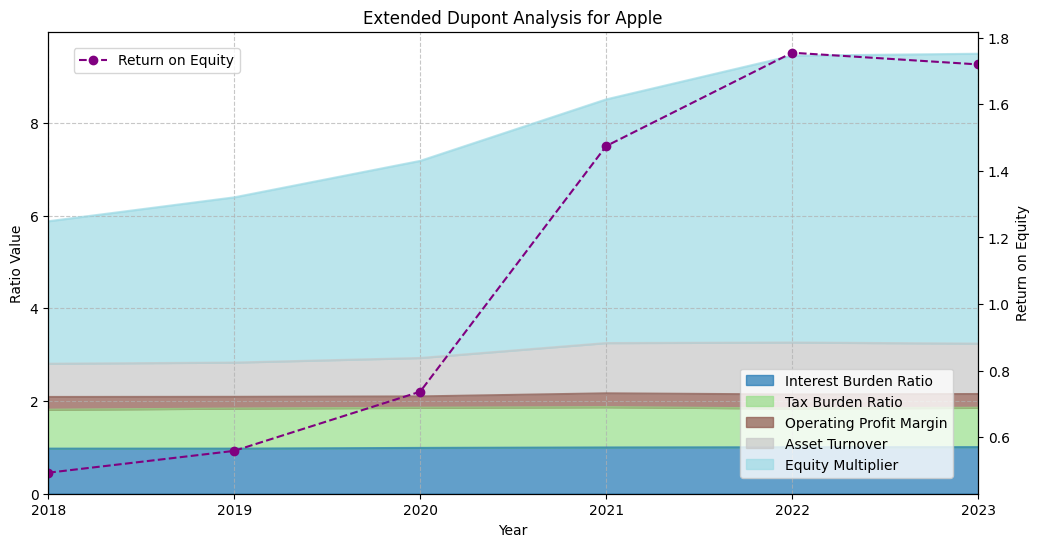
Each component and the resulting ROE can be visualized, making it easy to see what's driving shareholder returns:
Options and Greeks
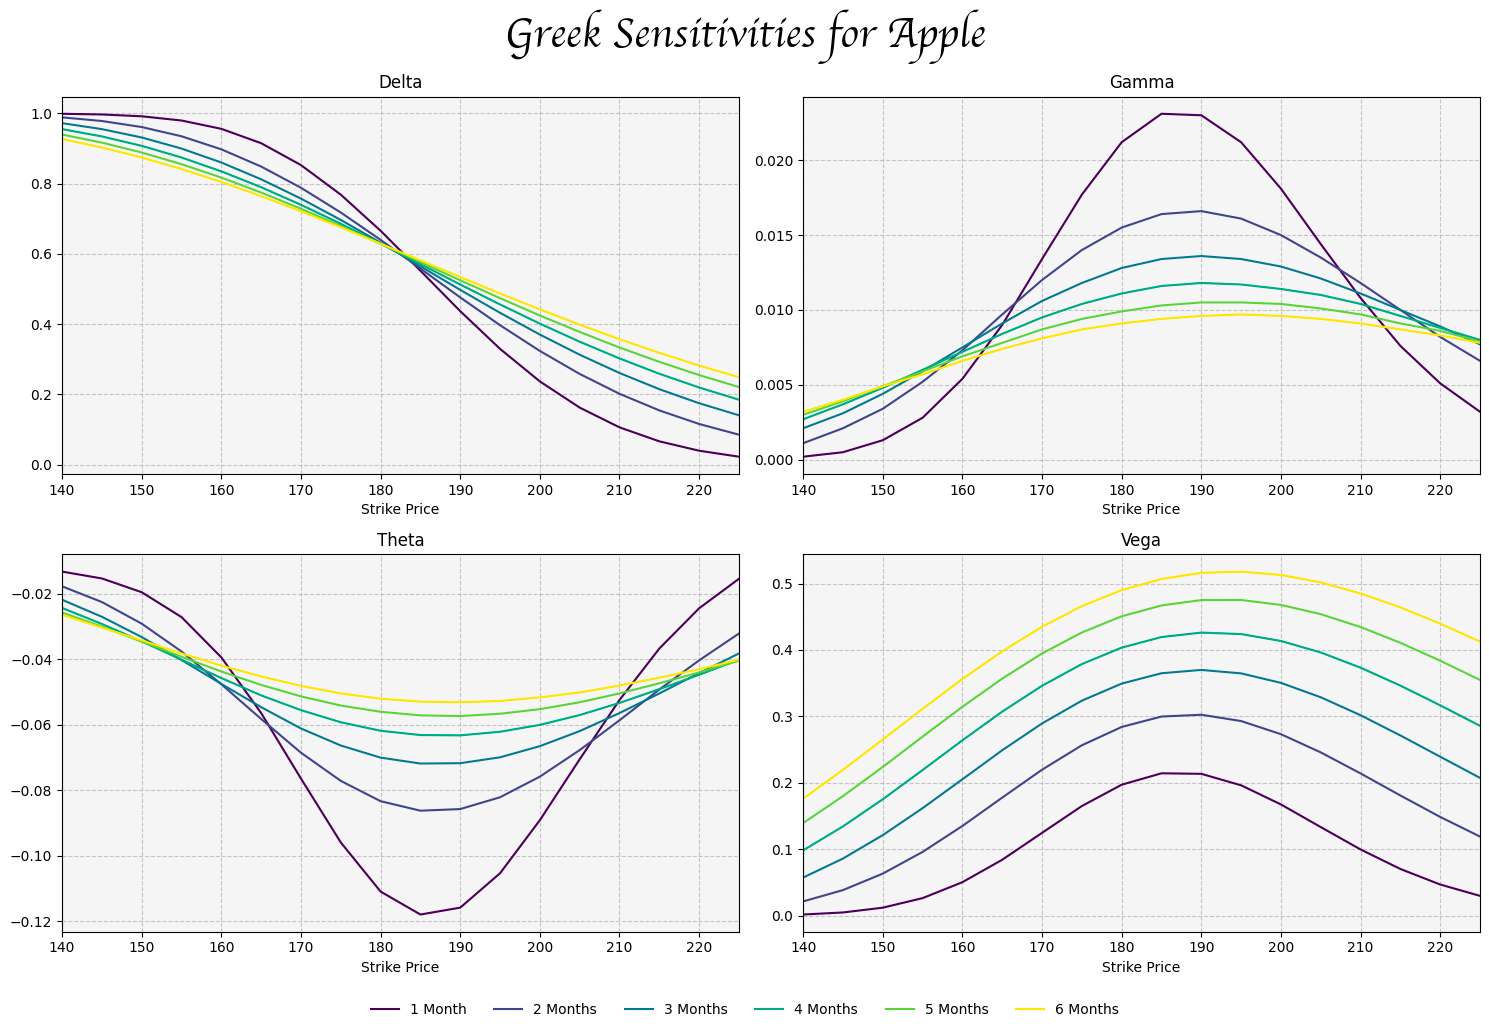
Options analysis is often reserved for advanced users, but the Finance Toolkit makes it accessible to everyone. You can analyze options using the Black-Scholes model and calculate Greeks (Delta, Gamma, Theta, Vega, and more) to understand risk and reward for different strategies.
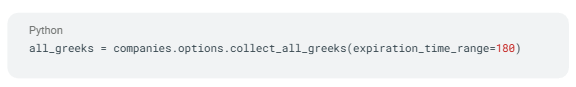
Here's the Delta for Apple call options across various expirations and strikes:
|
1 Month |
2 Months |
3 Months |
4 Months |
5 Months |
6 Months |
|
|---|---|---|---|---|---|---|
|
175 |
0.7686 |
0.7178 |
0.6967 |
0.6857 |
0.6794 |
0.6759 |
|
180 |
0.6659 |
0.64 |
0.6318 |
0.629 |
0.6285 |
0.6291 |
|
185 |
0.5522 |
0.5583 |
0.5648 |
0.571 |
0.5767 |
0.5816 |
|
190 |
0.4371 |
0.4762 |
0.4977 |
0.513 |
0.5249 |
0.5342 |
|
195 |
0.3298 |
0.3971 |
0.4324 |
0.4562 |
0.474 |
0.4875 |
Visualize the Greeks for deeper insight into how options behave as market conditions change:
Performance Metrics
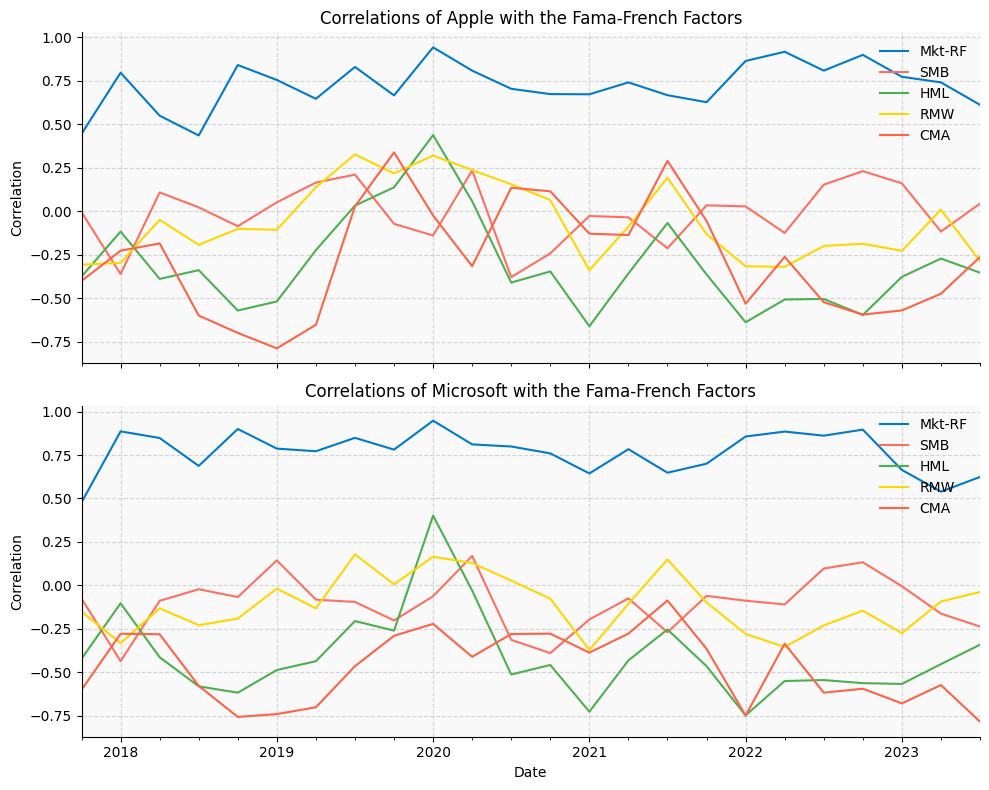
Understanding how your investments correlate with broader market factors is key to managing risk and building robust portfolios. The Toolkit lets you measure correlations with Fama-French factors (market, size, value, profitability, investment) for any period, so you can see what's really driving returns.
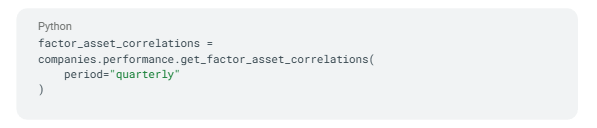
Here are Apple's quarterly correlations:
|
Mkt-RF |
SMB |
HML |
RMW |
CMA |
|
|---|---|---|---|---|---|
|
2022Q2 |
0.9177 |
-0.1248 |
-0.5077 |
-0.3202 |
-0.2624 |
|
2022Q3 |
0.8092 |
0.1528 |
-0.5046 |
-0.1997 |
-0.5231 |
|
2022Q4 |
0.8998 |
0.2309 |
-0.5968 |
-0.1868 |
-0.5946 |
|
2023Q1 |
0.7737 |
0.1606 |
-0.3775 |
-0.228 |
-0.5707 |
|
2023Q2 |
0.7416 |
-0.1166 |
-0.2722 |
0.0093 |
-0.4745 |
Track factor correlations over time to see how your portfolio's risk profile evolves:
Risk Metrics
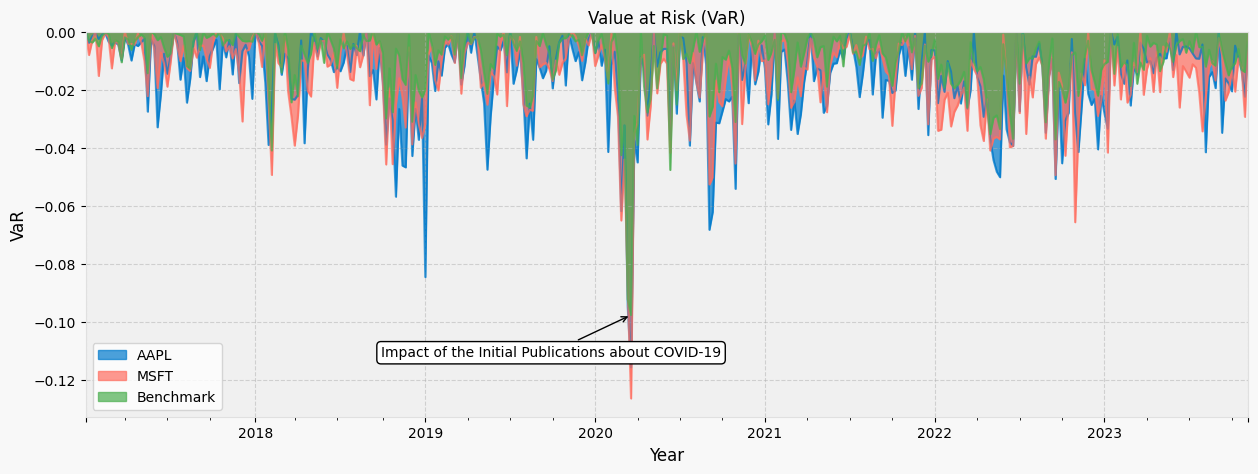
Risk management is crucial for any investor. The Finance Toolkit calculates Value at Risk (VaR) for any period using multiple distributions (Historical, Gaussian, Student-t, Cornish-Fisher), helping you quantify potential losses and prepare for market shocks.
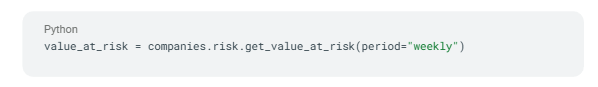
Here's weekly VaR for Apple, Microsoft, and the S&P 500:
|
AAPL |
MSFT |
Benchmark |
|
|---|---|---|---|
|
2023-09-25/2023-10-01 |
-0.0205 |
-0.0133 |
-0.0122 |
|
2023-10-02/2023-10-08 |
-0.0048 |
-0.0206 |
-0.0108 |
|
2023-10-09/2023-10-15 |
-0.0089 |
-0.0092 |
-0.0059 |
|
2023-10-16/2023-10-22 |
-0.0135 |
-0.0124 |
-0.0131 |
|
2023-10-23/2023-10-29 |
-0.0224 |
-0.0293 |
-0.0139 |
Visualize VaR and see the impact of market events, so you can make informed decisions about your exposure:
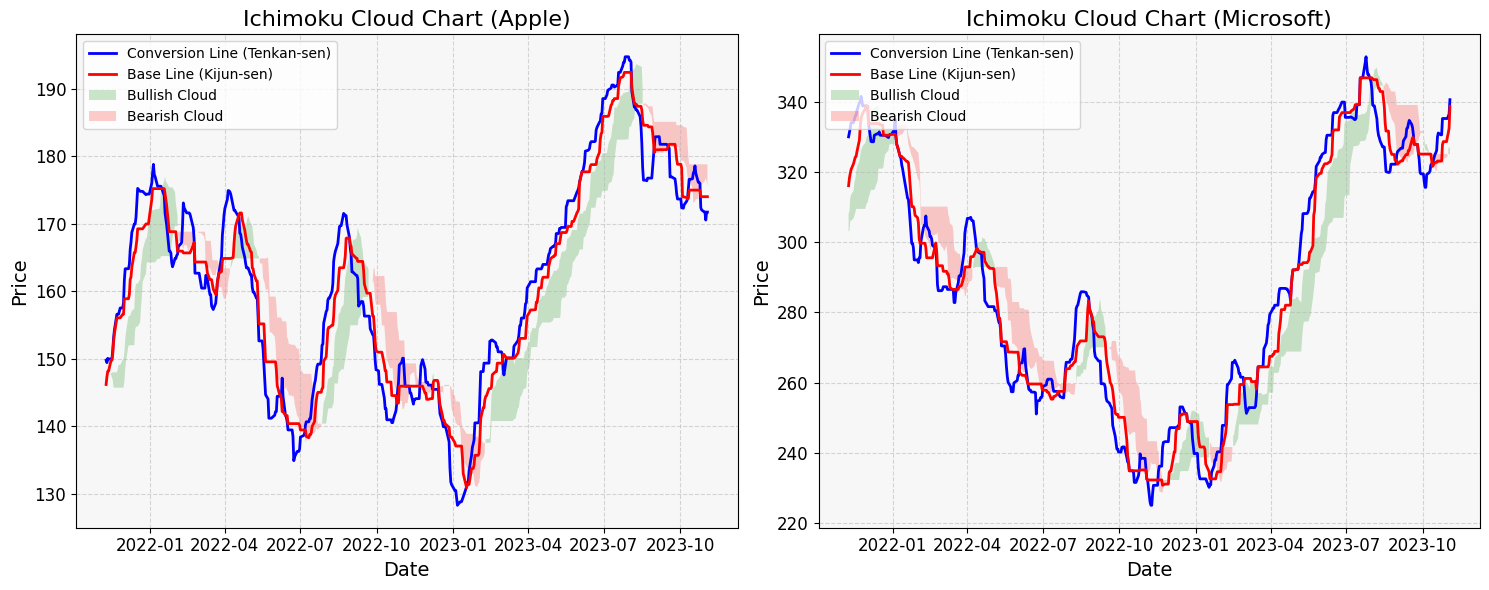
Technical Indicators
Technical analysis is a powerful way to spot trends and trading opportunities. The Toolkit provides over 30 technical indicators, including Ichimoku Cloud parameters, so you can analyze price action and momentum for any stock.

Here's a sample for Apple:
|
Date |
Base Line |
Conversion Line |
Leading Span A |
Leading Span B |
|---|---|---|---|---|
|
2023-10-30 |
174.005 |
171.755 |
176.245 |
178.8 |
|
2023-10-31 |
174.005 |
171.755 |
176.37 |
178.8 |
|
2023-11-01 |
174.005 |
170.545 |
176.775 |
178.8 |
|
2023-11-02 |
174.005 |
171.725 |
176.235 |
178.8 |
|
2023-11-03 |
174.005 |
171.725 |
175.558 |
178.8 |
Visualize technical indicators for multiple stocks to identify entry and exit points:
Curious to dive even deeper? The Finance Toolkit is powered by FinancialModelingPrep, which offers a rich set of features and data beyond what's covered here. If you want to explore more possibilities, check out their developer documentation for a full overview of available endpoints and data types.
And here's a bonus: If you've purchased an API key, you're ofcourse not limited to just the Toolkit's built-in features. You can tap directly into FinancialModelingPrep's API from your own code, unlocking even more flexibility and control for custom projects or advanced analysis. So whether you're building something unique or just want to experiment, you have the freedom to access all the data you need—your way.

Top 5 Defense Stocks to Watch during a Geopolitical Tension
In times of rising geopolitical tension or outright conflict, defense stocks often outperform the broader market as gove...

Circle-Coinbase Partnership in Focus as USDC Drives Revenue Surge
As Circle Internet (NYSE:CRCL) gains attention following its recent public listing, investors are increasingly scrutiniz...

LVMH Moët Hennessy Louis Vuitton (OTC:LVMUY) Financial Performance Analysis
LVMH Moët Hennessy Louis Vuitton (OTC:LVMUY) is a global leader in luxury goods, offering high-quality products across f...

