FMP
Benchmarking Future Growth: How to Compare Forward KPIs Using Financial Estimates & Price Target APIs
Dec 13, 2025
Capital markets function as a perpetual discounting mechanism, consistently prioritizing future growth expectations over realized results. This dynamic exposes the lag inherent in traditional fundamental analysis, which often relies too heavily on trailing twelve-month metrics. To capture competitive divergence before it is fully reflected in the stock price, analysts must shift their focus from auditing historical performance to benchmarking forward-looking indicators.
This article outlines a repeatable three-step workflow for benchmarking future performance: measuring growth durability, calibrating valuation drift, and validating with factor ratings. We use Alphabet (GOOGL) and Meta Platforms (META) as case studies to illustrate this methodology, utilizing the Financial Estimates API, Price Target Summary API, and Historical Ratings API.
Quantifying Growth Durability and Relative Efficiency
The core of forward-looking analysis rests on the sustainability of the consensus growth curve beyond the near-term. Analysts can retrieve multi-year revenue and EBITDA forecasts programmatically using the Financial Estimates API to dissect expected growth durability out to 2029 and the crucial factor of margin expansion across peers. An analyst would explore this endpoint by mentioning the company ticker and setting the period to annual; this provides forward estimates through 2029.
Expected Revenue Slope and Growth Durability (2027-2029)
We extend the benchmarking horizon to 2029 to measure the true durability and long-term momentum of each firm. Comparing the annualized growth rate (CAGR) of forward revenue estimates neutralizes the noise of short-term quarterly beats.
- Alphabet (GOOGL): Consensus estimate values retrieved via the Financial Estimates API project revenue hitting approximately $511 billion in 2027 and $625 billion by 2029. The annualized growth rate for this period averages roughly 10.5 percent, signaling a mature, stable compounding profile.
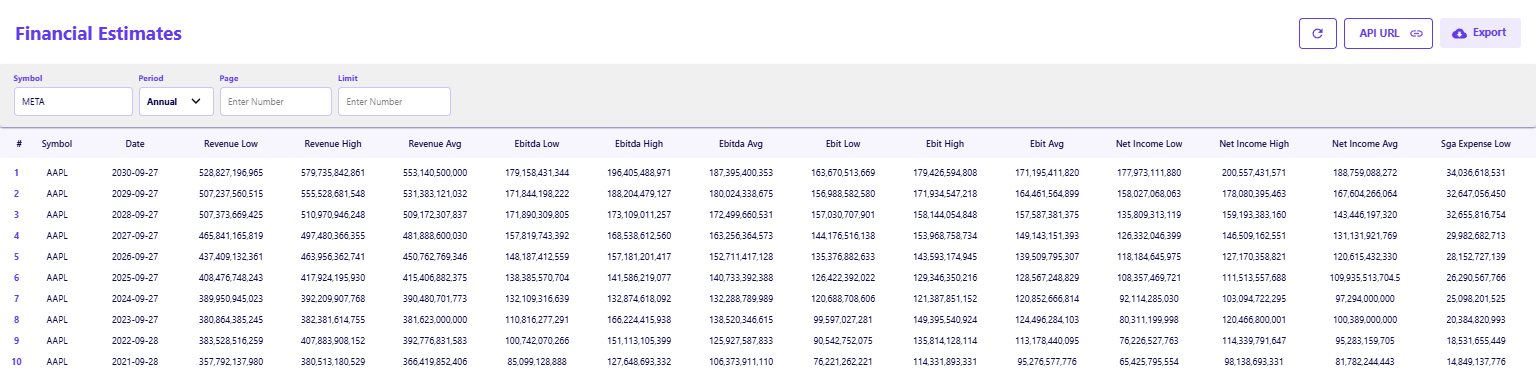
- Meta Platforms (META): Consensus estimate values retrieved via the Financial Estimates API show revenue reaching approximately $271 billion in 2027 and $356 billion by 2029. The annualized growth rate averages approximately 14.8 percent.
The slope comparison reveals a vital divergence: Meta is projected to retain a superior growth velocity, pacing over 400 basis points (bps) above Alphabet through the end of the decade. This measures secular growth persistence versus temporary acceleration.
Benchmarking Operating Leverage and Margin Expansion
Growth without superior profitability leverage is often punished in tightening rate environments. Analysts leverage the Financial Estimates API to pull forward EBITDA or margin expectations, which allows for direct comparison of expected operating efficiency. We benchmark the expected ability to translate top-line growth into margin expansion by comparing forward EBITDA estimates.
|
Peer |
2025 EBITDA Est. |
2026 EBITDA Est. |
Implied $ Change |
|
GOOGL |
$140 billion |
$159 billion |
+$19 billion |
|
META |
$104 billion |
$120 billion |
+$16 billion |
This table is illustrative of how analysts evaluate forward operating leverage gaps between peers. While the absolute dollar expansion favors the larger firm, the relative efficiency is key. The estimates imply Meta will realize a $16 billion gain on a significantly smaller revenue base. This superior implied operating leverage suggests consensus models are pricing in Meta's ability to control operating expenses while revenue scales.
Calibrating Valuation Drift and Analyst Conviction
Analyst price targets reveal how the street values differential growth and margin expectations. We utilize data from the Price Target Summary API to calibrate the momentum of institutional conviction, or valuation drift.
Benchmarking Price Target Momentum
The true signal is often the recent directional change in the consensus target rather than the absolute upside. We compare the "Last Month Avg Price Target" against the "Last Quarter Avg Price Target" fields to identify shifts in sentiment.
- GOOGL (Positive Drift): The average price target has risen significantly from a Last Quarter average of roughly $305.00 to a Last Month average of $365.00. These estimates imply that analysts may be incorporating higher conviction in the predictability and stability of Alphabet's cash flows.
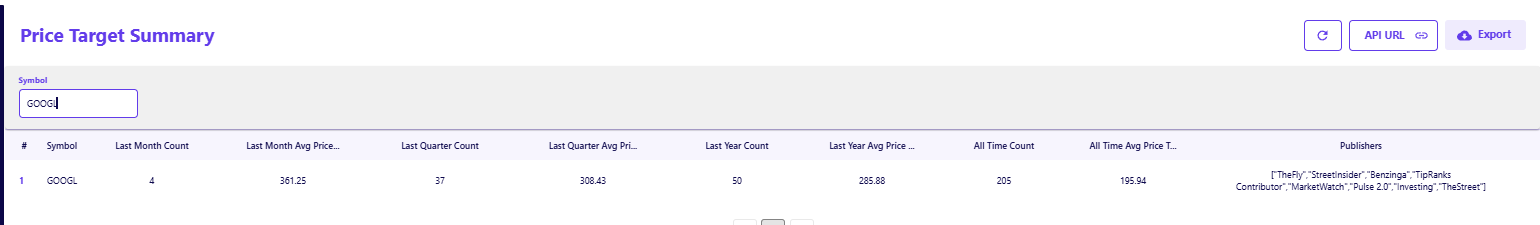
- META (Negative Drift): Despite superior projected revenue growth, the consensus target has contracted, falling from roughly $860.50 to $759.00 over the quarter. This signal suggests analysts may be factoring in non-financial risks, such as regulatory hurdles or sustained CapEx, into the valuation multiple.
This discrepancy demonstrates how price target drift serves as an early indicator of valuation sentiment divergence between peers. Understanding this valuation drift is crucial, as detailed in our guide on Understanding Valuation Drift.
Factor-Based Quality Assessment and Strategic Implications
To filter the conflict between growth rates and price targets, we apply factor analysis using the Historical Ratings API. This data provides an objective, non-consensus view of fundamental quality and systematic risk exposure.
Risk Profile and DCF Divergence
- Overall Risk Profile: Alphabet carries a strong "A-" rating compared to Meta's lower "B+" rating. These ratings align with the market's perception of Alphabet as the lower-risk, higher-quality enterprise, consistent with the rising price target trend.
- DCF Divergence: Critically, Meta carries a superior Discounted Cash Flow (DCF) score of 4 versus Alphabet's score of 3. The metric indicates that, relative to consensus future cash flow projections, Meta's stock is trading at a statistically larger discount.
This structural rating difference helps guide the risk-return model. Alphabet's lower DCF score but higher stability rating suggests a "quality" premium, while Meta's higher DCF score implies a "value" discount due to perceived risk.
Implications for FP&A Benchmarking
This forward benchmarking methodology is essential for corporate strategy and financial planning and analysis (FP&A) leaders. The divergence in consensus estimates directly informs competitive resource allocation.
- Benchmarking Margin Expectations: Comparing forward EBITDA estimates reveals operating leverage gaps. If the street expects a peer to realize superior leverage on a smaller base, it suggests a potential competitive weakness in cost structure or pricing power that requires strategic review.
- Competitive Growth Mandates: The disparity in long-term revenue slopes (e.g., 14.8% vs. 10.5%) provides a quantitative mandate. Strategy teams use these gaps to identify initiatives needed to close the growth differential and satisfy market expectations.
Validating Thesis with Market Flow and Price Action
The final step in forward benchmarking is verifying if institutional money flow confirms the fundamental thesis. Using the full chart data and the Quote API provides the necessary technical context on liquidity.
Technical Confirmation and Liquidity Signals
Analysts overlay forward estimates with price-volume data to use as a confirmation layer, not a diagnostic tool.
- GOOGL Stability: In early December 2025, Alphabet displayed price stability that aligns with rising price targets. This observable signal supports the thesis of stable institutional accumulation.
- META Volatility: Conversely, Meta has experienced periods of higher volatility and volume spikes accompanying price drops. This liquidity signal aligns with the contraction observed in the price targets and the lower B+ risk rating.
Successful forward benchmarking requires integrating these liquidity signals rather than fighting them based purely on spreadsheet forecasts. Analysts should look for how volume confirms or denies the consensus price targets, a topic further explored in our guide on Three Ways to Build Momentum Signals Using Forecast APIs.
Implications for Analyst Modeling
Forward-looking benchmarking is an active triangulation of growth velocity, valuation sentiment, and factor-based risk. This framework enables analysts to move beyond reporting history to modeling the future.
By rigorously comparing forward revenue slopes, calibrating price target drift, and validating with factor ratings, analysts can construct a superior forward thesis. The ultimate analytical output is a set of objective, data-driven inputs that align a model with anticipated market realities, providing the necessary edge in competitive markets.
FAQs
How far into the future should I benchmark revenue estimates?
You should benchmark revenue estimates across the full available forecast horizon, which extends to 2029 for these peers. Focusing on the annualized growth rate over the 2027-2029 period reveals whether the growth is secular or merely a short-term cyclical bump.
Why would price targets fall if revenue growth estimates are high?
Price targets may fall despite high revenue growth if analysts compress the valuation multiple due to perceived risks. This can happen if interest rates rise, margins are expected to compress, or regulatory threats increase, offsetting the positive revenue trend.
What does a higher DCF score indicate in the FMP Historical Ratings API?
A higher DCF score indicates that the stock is trading at a larger discount to its theoretical intrinsic value based on projected cash flows. This suggests the stock is statistically undervalued relative to its expected future earnings power.
How do forward KPIs help in assessing competitive positioning?
Forward KPIs measure expected operational strength relative to peers before it is reported. For example, comparing projected operating leverage reveals which company is expected to gain profitable market share velocity, indicating superior competitive strength.
What is the advantage of comparing revenue slopes over absolute numbers?
Comparing revenue slopes (the rate of change) neutralizes the effect of company size. It allows for a direct comparison of the growth momentum between a smaller peer and a larger incumbent to isolate the rate of market share dynamics.

Top 5 Defense Stocks to Watch during a Geopolitical Tension
In times of rising geopolitical tension or outright conflict, defense stocks often outperform the broader market as gove...

Circle-Coinbase Partnership in Focus as USDC Drives Revenue Surge
As Circle Internet (NYSE:CRCL) gains attention following its recent public listing, investors are increasingly scrutiniz...

LVMH Moët Hennessy Louis Vuitton (OTC:LVMUY) Financial Performance Analysis
LVMH Moët Hennessy Louis Vuitton (OTC:LVMUY) is a global leader in luxury goods, offering high-quality products across f...

