FMP
Use Forward Guidance to Build Sector-Level Forecasts
Aug 20, 2025(Last modified: Sep 25, 2025)
Analyst estimates and press releases only tell part of the story. To truly understand where markets are heading, institutional investors need to look deeper—into the forward guidance companies provide and how that guidance shifts across sectors over time.
What is Forward Guidance?
Forward guidance often comes in the form of earnings ranges, margin expectations, or capex plans—sometimes precise, sometimes qualitative. Extracting structure from that ambiguity is where the strategic edge lies. Whether management is signaling expansion in AI infrastructure or cautioning about FX headwinds in consumer goods, the cumulative sentiment tells a story about where capital and conviction are heading.
By synthesizing revisions and commentary across an industry, it becomes possible to quantify conviction, identify inflections, and reallocate capital proactively. This post explores how to do exactly that using Financial Modeling Prep (FMP) data—layering management sentiment, analyst revisions, and signal breadth into a decision-making framework.
Why Forward Guidance Is a Strategic Signal
At the company level, guidance provides insight into internal expectations and risk. But in aggregate, it becomes something more powerful—a leading indicator for sector health and positioning.
When multiple companies revise guidance upward or strike a more confident tone, they're signaling more than growth—they're issuing public commitments. These signals often predate the fundamentals that get priced into models. For example, a sector-wide shift in margin outlooks or language around hiring plans may surface rotation themes long before earnings are reported.
Forward guidance also acts as a canary in the coal mine. When guidance is pulled, ranges widen, or commentary grows negative across peer groups, it can foreshadow volatility. Watching these shifts systematically allows allocators to position early—either to capture upside or mitigate exposure.
The Role of FMP Data in Sector-Level Forecasting
To act on guidance signals at scale, you need data infrastructure that captures both the quantitative and qualitative sides of management commentary. Financial Modeling Prep (FMP) offers exactly that.
FMP provides several key datasets that enable this type of guidance-driven, cross-sectional analysis:
- Market Calendar: Capture which companies are scheduled to report, filter by sector, and build expectation screens.
- Company Profile & Fundamentals: Surface sector, industry, and cap-level metadata to group peers effectively.
- Analyst Estimates & Price Target APIs: Pull revision trends, consensus numbers, and estimate dispersion across sectors.
- Earnings Call Transcript API: Use NLP or keyword parsing to detect tone shifts, guidance commentary, and emerging language patterns.
Together, these endpoints give teams the tools to combine structured and unstructured data into repeatable, quantitative signals. This structured intelligence enables both discretionary and systematic teams to incorporate forward guidance into high-frequency dashboards, thematic screens, and strategic memos.
Four Signal Types You Can Build with FMP's Guidance Data
FMP's datasets provide structured access to the four main layers of guidance intelligence:
1. Analyst Estimate Revisions
Track changes in revenue, EPS, and margin expectations. A trend of upward revisions in industrials and simultaneous downgrades in healthcare can drive overweight/underweight decisions.
Recommended Datasets:
- Analyst Estimates & Price Target - Core data source for EPS, revenue, and margin revisions.
- Company Profile - Provides sector and industry context to group revisions.
- Market Calendar - Helps time revisions relative to earnings announcements.
2. Management Commentary
Earnings call transcripts are rich in qualitative guidance. Parsing tone, sentiment, and theme frequency can reveal insights on hiring plans, FX risk, pricing power, and macro sentiment—even when numbers stay flat.
Recommended Datasets:
- Earnings Call Transcripts - Primary source for qualitative guidance, tone, and sentiment.
- Company Profile - Useful for filtering by sector or market cap to analyze tone within peer groups.
3. Guidance Dispersion
Wide guidance ranges often signal elevated macro or idiosyncratic risk. Tight ranges may indicate confidence and visibility. Tracking this at the industry level helps risk teams gauge clarity versus uncertainty.
Recommended Datasets:
- Analyst Estimates & Price Target - Includes ranges for revenue and EPS forecasts; useful for calculating dispersion.
- Company Profile - Enables sector-level aggregation of dispersion signals.
4. Breadth and Directionality
One positive revision is noise. A wave of ten is a signal. Breadth indicators help surface momentum, while directionality reveals whether sentiment is strengthening or weakening across the board.
Recommended Datasets:
- Analyst Estimates & Price Target - Needed to measure revision counts and direction across many tickers.
- Index Market Data - Use sector or industry indexes to compare analyst sentiment vs. actual sector price movement.
- Company Profile - Helps categorize revisions by sector or cap size.
- Market Calendar - Useful to track revision waves around earnings season.
Allocation and Risk Strategy: Use Cases That Matter
Forward guidance is a tradable signal, not background noise. It shapes allocation, flags sector shifts, and exposes risk before the tape does. The sections below break down how to use guidance trends directly in portfolio strategy—whether reallocating capital, positioning thematically, or hedging against downside.
Sector Rotation and Thematic Positioning
Guidance trends can lead price action. If enterprise SaaS names consistently outperform consensus and sentiment scores rise, allocators may shift their exposure before backward-looking metrics confirm the move.
Similarly, if consumer cyclicals begin cutting capex or referencing weak demand, it's often a signal to reweight before the drawdown accelerates.
Risk Management and Hedging
Guidance isn't just about upside—it's a vital tool for managing downside risk.
- A sharp rise in dispersion within a sector can flag growing uncertainty.
- A tone shift toward “volatility,” “headwinds,” or “margin pressure” across calls may indicate deteriorating conditions.
These signals enable proactive hedging—using options, ETFs, or capital reallocation—rather than reactive damage control.
Dashboards and Visualization Ideas
To make forward guidance data actionable, consider integrating it into internal dashboards. Below is a mockup of four key views that translate raw signals into strategic insights:
- Sector Revision Heatmap - Weekly net upgrades and downgrades across sectors
- Management Sentiment Index - Scores based on tone and keyword analysis in earnings transcripts
- EPS Dispersion Tracker - Measures the spread of guidance ranges to highlight volatility and uncertainty
- Rolling Breadth Count - Tracks the percentage of companies in each sector revising guidance upward
These views help teams monitor conviction, risk, and momentum in real time.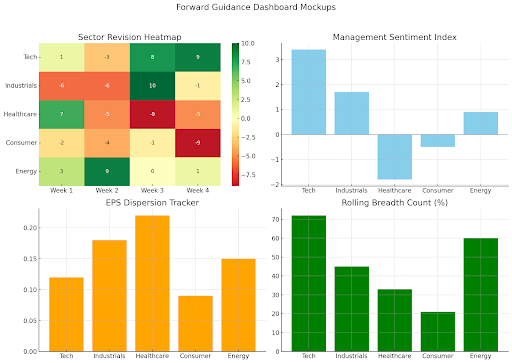
Each panel reflects a different signal you can build using FMP's Analyst Estimates API, Earnings Call Transcript API, and metadata endpoints.
Linking Guidance to Macro Signals
Forward guidance doesn't operate in isolation. Connecting it to macro trends strengthens forecasting logic.
- If semiconductor firms are guiding capex higher, that may confirm improving PMIs or industrial production.
- If retail names revise earnings downward while wage inflation rises, it may validate a bearish consumer outlook.
These crosswalks between micro and macro can reinforce—or challenge—your core investment theses.
Internal Strategy and Communication Value
Structured guidance analysis isn't just useful for positioning—it enhances internal strategy as well.
- Investment Committee: Use sector-level guidance to justify rotation decisions.
- PM Communication: Align sub-portfolio moves with firm-wide themes (e.g., energy transition, automation).
- Investor Relations: Add conviction and context to LP reporting by citing sector guidance momentum.
These dashboards don't just surface ideas—they build institutional memory around why allocation calls were made.
Structuring the Signal Before It's Priced In
Forward guidance is one of the few forward-looking signals delivered with strategic intent. CEOs and CFOs use it to shape expectations, manage perceptions of risk, and set the tone for the quarters ahead. When tracked systematically across companies and industries—and structured with the right tools—it can reveal market signals before they're priced in.
This isn't about cherry-picking soundbites from earnings calls. It's about building repeatable, scalable frameworks to gauge conviction, surface rotation themes, and manage risk proactively.
Ask yourself: how many of your investment decisions rely on backward-looking data—and what could forward guidance help you see first?
Putting It Into Practice: A Hypothetical Q3 Forecasting Workflow
In this section, we'll walk through a real-world example of using Financial Modeling Prep (FMP) data to model Q3 sector forecasts based on recent guidance trends and estimate revisions. This workflow synthesizes forward-looking commentary, analyst sentiment, and dispersion indicators into a repeatable, sector-level view.
Step 1: Identify Relevant Earnings Call Transcripts
Using the Earnings Call Transcript API, we pulled transcripts from companies that reported between June 30 and August 15, 2025.
We focused on three sectors showing notable commentary shifts:
- Technology (36 companies)
- Consumer Discretionary (29 companies)
- Industrials (24 companies)
Step 2: Extract and Score Management Sentiment
We applied a keyword-based NLP model to parse tone and theme frequency.
Top bullish phrases (Tech):
“AI investment” (22 mentions), “cloud expansion” (18), “record backlog” (11)
Top bearish phrases (Consumer):
“inventory headwinds” (16), “FX pressure” (9), “soft Q3 outlook” (14)
Aggregate sentiment scores (scale: -5 to +5):
- Technology: +3.8
- Industrials: +1.5
- Consumer Discretionary: -2.1
Step 3: Analyze Analyst Revisions
Using the Analyst Estimates & Price Target API, we measured net estimate revisions from July 1 to August 15.
Net upward vs. downward revisions:
|
Sector |
Upward Revisions |
Downward Revisions |
Net % |
|
Technology |
61 |
19 |
+69% |
|
Industrials |
33 |
25 |
+24% |
|
Consumer Discretionary |
12 |
44 |
-72% |
Step 4: Calculate Dispersion and Breadth
We used guidance range data from the Analyst Estimates API to measure dispersion, and counted companies issuing positive revisions for breadth.
Guidance Dispersion (average EPS forecast range width):
- Technology: $0.19 → $0.14 (narrowing)
- Consumer Discretionary: $0.11 → $0.25 (widening)
- Industrials: $0.16 → $0.18 (stable)
Revision Breadth (percentage of companies raising guidance):
- Technology: 72%
- Industrials: 54%
- Consumer Discretionary: 23%
Step 5: Visualize the Signals
We combined these data points into a dashboard:
- Sentiment Score Index: Rolling average by sector
- Net Revisions Heatmap: Weekly trend of positive vs. negative changes
- Forecast Dispersion Tracker: Identifies rising risk in Consumer names
- Breadth Counter: Flags sectors with consensus directional movement
Tools used:
Google Sheets + FMP CSV endpoints for quick iteration
Streamlit app (optional) for dynamic filters by sector, cap, and time window
Preliminary Q3 Forecast Insight Example
- Technology leads Q3 momentum with strong positive sentiment (+3.8), a 69% net upward revision rate, and narrowing EPS dispersion. Management commentary reflects high conviction in AI and cloud infrastructure expansion.
- Consumer Discretionary, by contrast, shows signs of stress. Sentiment is negative (-2.1), downward revisions dominate, and guidance ranges are widening—particularly among retailers citing margin pressure and cautious consumer behavior.
- Industrials remain stable, with mixed signals but modest optimism, making it a potential value rotation candidate if macro signals turn supportive.
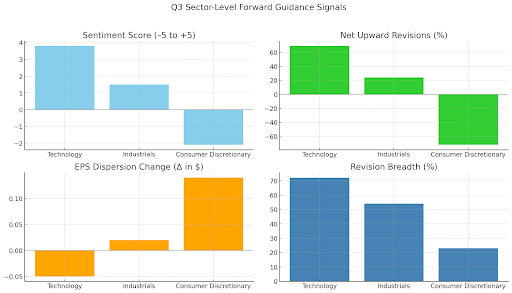
Chart Mockup
Here's a mockup of a visual dashboard showing Q3 forward guidance signals across three sectors. The chart includes:
- Sentiment Score (parsed from earnings calls)
- Net Upward Revisions (% of positive vs. negative estimate changes)
- EPS Dispersion Change (a proxy for uncertainty)
- Revision Breadth (% of companies issuing revisions)
This format could be used in an internal dashboard to drive sector allocation decisions.
Frequently Asked Questions
What is forward guidance?
Forward guidance is a communication strategy used by central banks and corporations to signal their expectations about future conditions—such as interest rates, earnings, or demand. It helps investors and stakeholders align their decisions with anticipated changes.
What is forward guidance in A-level economics?
In A-level economics, forward guidance refers to a central bank's use of public statements to shape market expectations about future interest rates or monetary policy. It's taught as a non-conventional monetary tool that influences behavior before actual policy changes occur.
What are the two types of forward guidance?
There are two primary types: Delphic forward guidance, which shares economic forecasts without firm policy commitments, and Odyssean forward guidance, which includes explicit commitments to future actions (e.g., keeping interest rates low until specific targets are met).
What is quantitative easing and forward guidance?
Quantitative easing (QE) involves central banks purchasing financial assets to inject liquidity into the economy. Forward guidance complements QE by setting expectations for how long policy will remain accommodative, reinforcing the impact of asset purchases on long-term rates and confidence.
Is there a forward guidance puzzle?
Yes—the "forward guidance puzzle" refers to the observed phenomenon where markets react more strongly to forward guidance than standard economic models predict. It raises questions about how expectations are formed and the limits of current forecasting frameworks.
What is forward guidance in economics?
Forward guidance is when a company or central bank communicates its expectations for future performance—such as earnings, demand trends, or interest rate policy. In economics, it helps market participants anticipate future behavior and adjust decisions accordingly.
How do institutional investors use forward guidance for forecasting?
Institutional teams use forward guidance to gauge momentum across sectors. By aggregating guidance sentiment and tracking changes over time, they can identify inflection points, support scenario planning, and optimize portfolio allocation.
What does the Federal Reserve mean by forward guidance?
In the context of monetary policy, the Federal Reserve uses forward guidance to influence expectations about future interest rate paths. These signals help stabilize markets and reduce uncertainty by clarifying the Fed's likely actions under current conditions.
How does Financial Modeling Prep (FMP) support forward guidance analysis?
FMP offers key datasets through its APIs—such as analyst estimates, earnings call transcripts, and company fundamentals—that allow investors to analyze forward guidance trends quantitatively across sectors and issuers.
What is the difference between forward guidance and analyst estimates?
Forward guidance comes from company executives and typically includes projected earnings or revenue ranges. Analyst estimates, meanwhile, are independent forecasts that may incorporate this guidance along with macro context, sentiment, and historical performance.
Can forward guidance help predict sector rotation?
Yes. When multiple companies within a sector issue stronger guidance, it often precedes increased institutional buying and capital flows. Detecting these patterns early can provide an edge in rotating into outperforming sectors.
What are some examples of forward guidance signals to monitor?
Key signals include guidance direction (positive or negative), tone from earnings calls, dispersion in forecast ranges, and breadth of upward or downward revisions. These metrics provide insight into both conviction and uncertainty.
How does guidance dispersion indicate market uncertainty?
Wide or inconsistent guidance ranges across companies in the same sector often reflect a lack of visibility into future conditions. This can suggest macroeconomic stress, emerging risks, or inflection points.
What role does forward guidance play in risk management?
Forward guidance helps identify early signs of deterioration. Negative tone shifts, lowered forecasts, or clustering of downward revisions can prompt defensive adjustments in positioning or hedging strategies.
How does forward guidance differ across companies like Apple, Microsoft, or NVIDIA?
Each company highlights different priorities in its guidance. Apple may focus on FX or product cycles, Microsoft on cloud growth, and NVIDIA on AI demand. Comparing guidance across peers can reveal trends affecting entire sectors.

Top 5 Defense Stocks to Watch during a Geopolitical Tension
In times of rising geopolitical tension or outright conflict, defense stocks often outperform the broader market as gove...

Circle-Coinbase Partnership in Focus as USDC Drives Revenue Surge
As Circle Internet (NYSE:CRCL) gains attention following its recent public listing, investors are increasingly scrutiniz...

LVMH Moët Hennessy Louis Vuitton (OTC:LVMUY) Financial Performance Analysis
LVMH Moët Hennessy Louis Vuitton (OTC:LVMUY) is a global leader in luxury goods, offering high-quality products across f...

