How to Calculate Fair Value of a Stock with the Price-Income Model
Jun 08, 2024(Last modified: Nov 18, 2025)
In this article, I want to share a very simple valuation model that requires minimal assumptions from you: the Price-Income model. All you need to do is download company financial ratios and those of the closest peers, calculate peer ratio averages, compare them to your selected company ratios, assign weights, and calculate the stock fair value. This model is not time-consuming; you just need to upload the data and build a simple model in Excel or Google Sheet. Let's explore the model in more detail so you can understand the logic and build it yourself.
Before we start, it is worth mentioning that stock target price or stock fair value can be calculated using three main models: the Discounted Cash Flow (DCF) model, the Dividend Discount Model (DDM), and the Price-Income model (also known as the Price Multiples or Ratio model). The DCF model is the most time-consuming but is widely used and popular among investment analysts because it provides a good representation of the company, allowing analysts to better define and understand company risks. However, the disadvantage of this model is that it requires many custom assumptions. For example, you need to understand how to forecast free cash flow (FCF) for several years in advance, determine the appropriate discount rate or Weighted Average Cost of Capital (WACC) for 10 years ahead, and assess the cost of money, among other assumptions. More assumptions can lead to greater accuracy, but if you make a mistake, your conclusions can be misleading.
The DDM model is also popular but cannot be used for companies that do not pay dividends. The Price-Income model is the simplest but still requires a few custom assumptions. Although not as many as in the DCF model, you should choose financial ratios to compare your company with competitors and assign weights accordingly. We will explore this in more detail below. Now that you know the three models for calculating stock fair value and their disadvantages, let's start with the Price-Income model.
The Price-Income Model
Step 1: Create the Financial Ratios Table
The first step is to open a Google Sheet and create a simple table. As shown in the table, I am using 10 financial ratios. First, extract ratios for AAPL shares, and then calculate the average of those ratios for Apple's closest peers. At this stage, you don't need to fill in numbers; just create an empty table with names as I did. As you can see from the table i am using 10 financial ratios, first i extract ratios for AAPL shares and then calculate the average of those rations for Apples closest peers. On this stage you don't have to fill in numbers just create empty table without numbers just name everything as i did.
Step 2: Extract the Financial Ratios
Before extracting the financial ratios, you need to install the Google Sheets add-on. Follow the instructions for the Financial Modeling Prep (FMP) add-on installation.
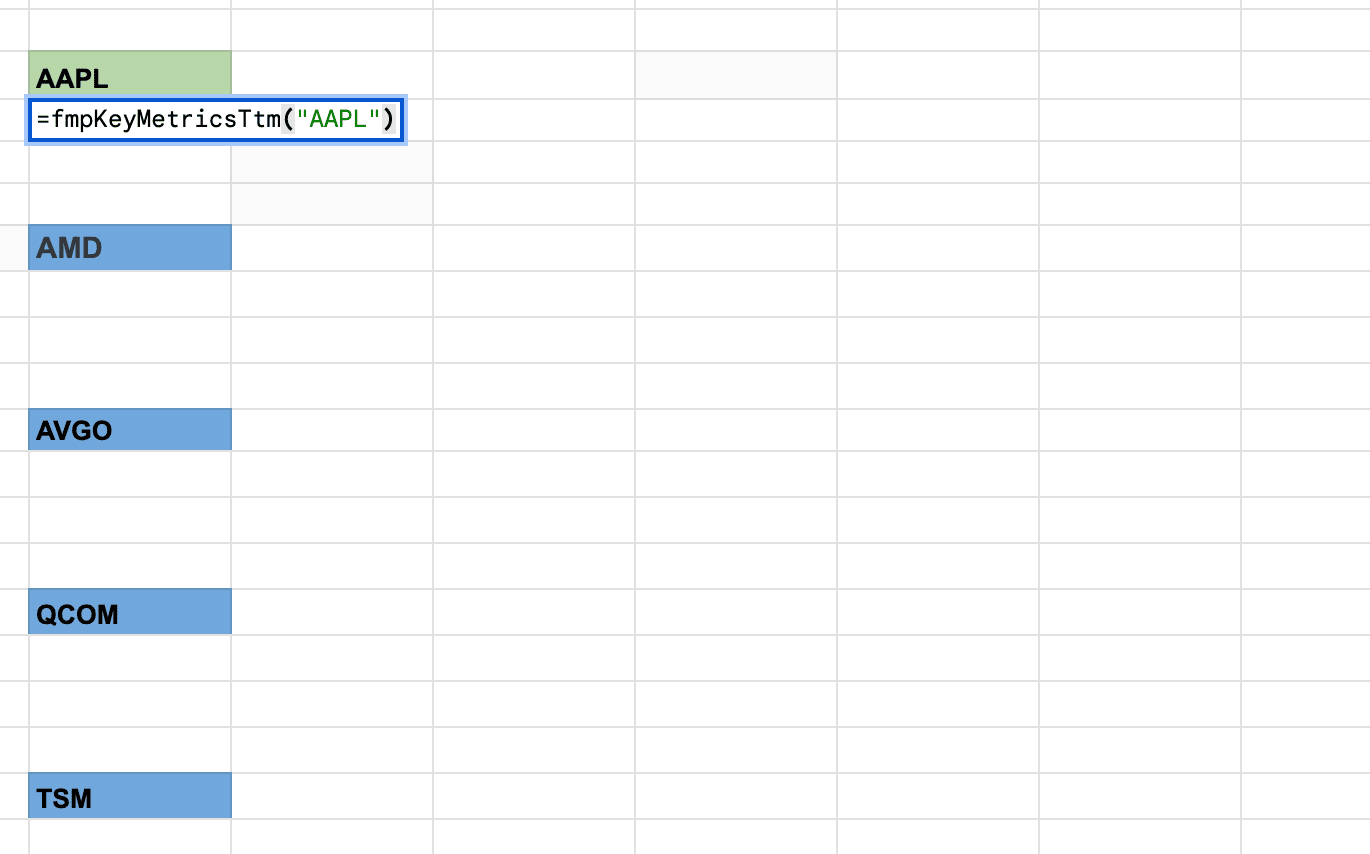
After installing the FMP add-on, you can extract the data. List AAPL's closest competitors as I did in the example and use the formula =fmpKeyMetricsTtm("AAPL") as shown in the picture. Place the formula directly under the AAPL ticker. To extract ratios for AMD, place the formula under AMD: =fmpKeyMetricsTtm("AMD"). As shown, replace the AAPL ticker with AMD.
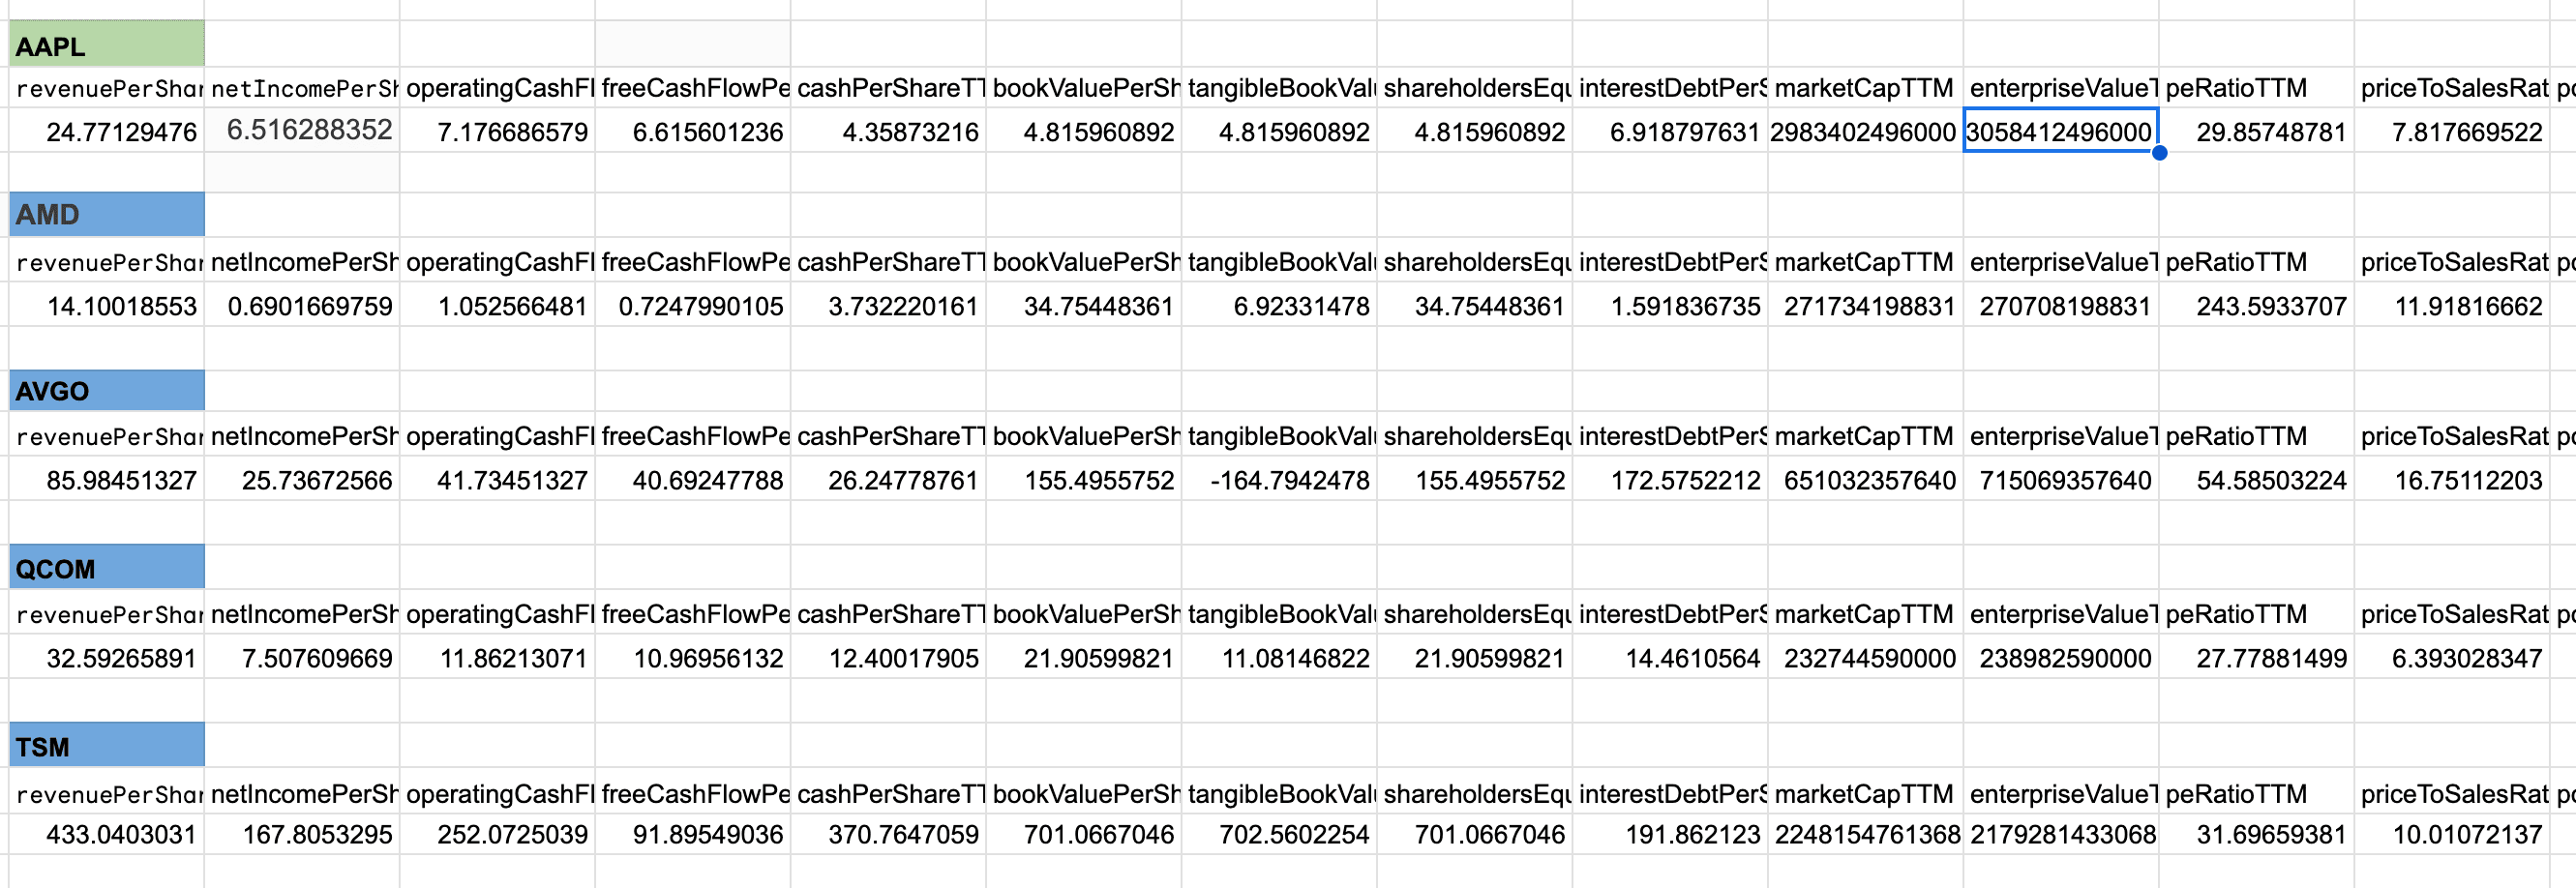
If done correctly, you will extract financial ratios for the companies as shown in the picture below. This table should be in the same file as your initial table (the first picture).
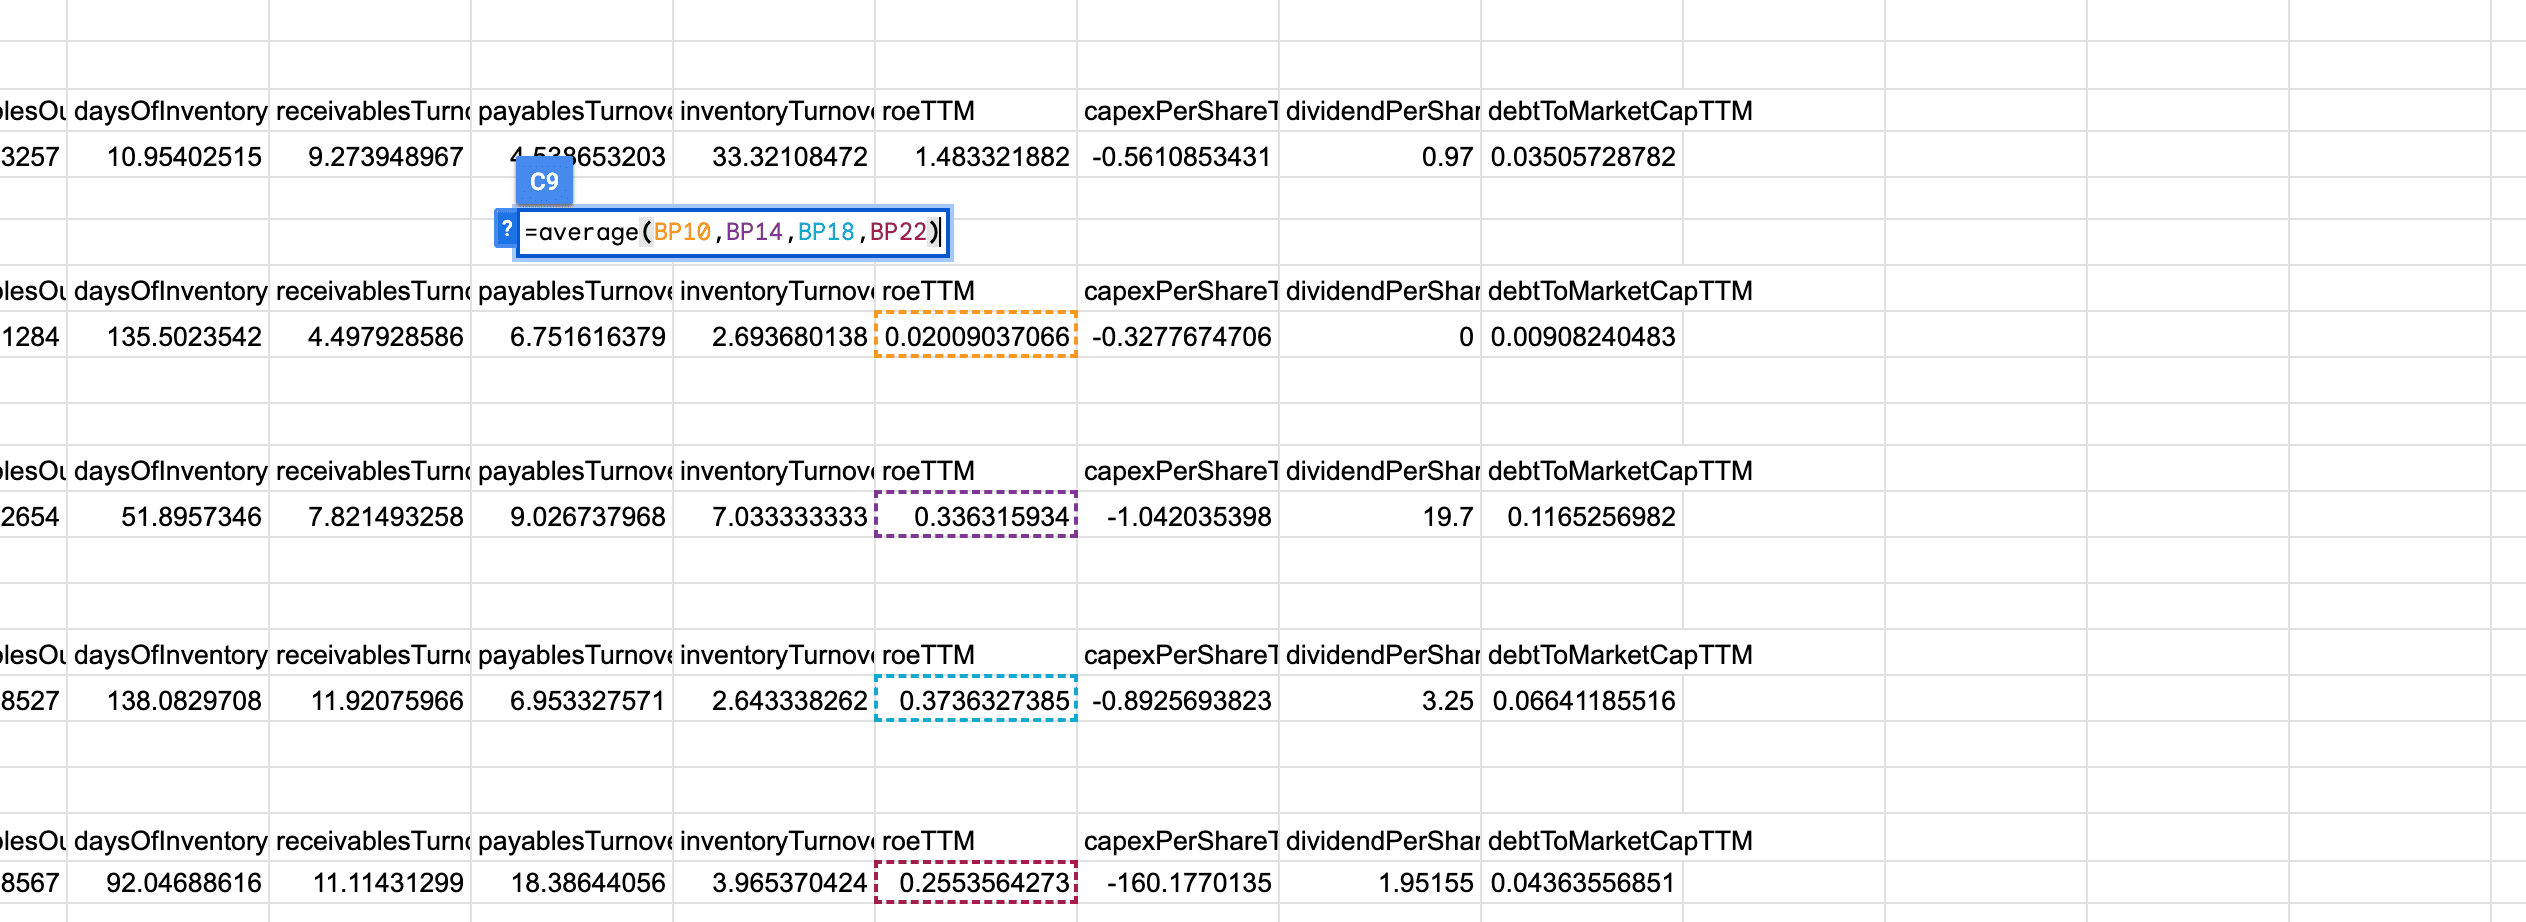
In your initial table, copy the financial ratios and numbers that you extracted as shown in the picture below (highlighted in red). To copy them, use the "=" sign. Simply put the sign under the ratio name, find the needed number, click on it, and hit enter. Then calculate the averages for Apple's closest peers. To calculate averages, use the formula =AVERAGE() and select the numbers that relate to competitors' ratios, place those numbers inside the brackets. For example, to calculate the average for “roeTTM”, type =AVERAGE() under the roeTTM cell (as shown in the below picture, marked yellow) and inside the brackets, input the numbers as shown in the picture
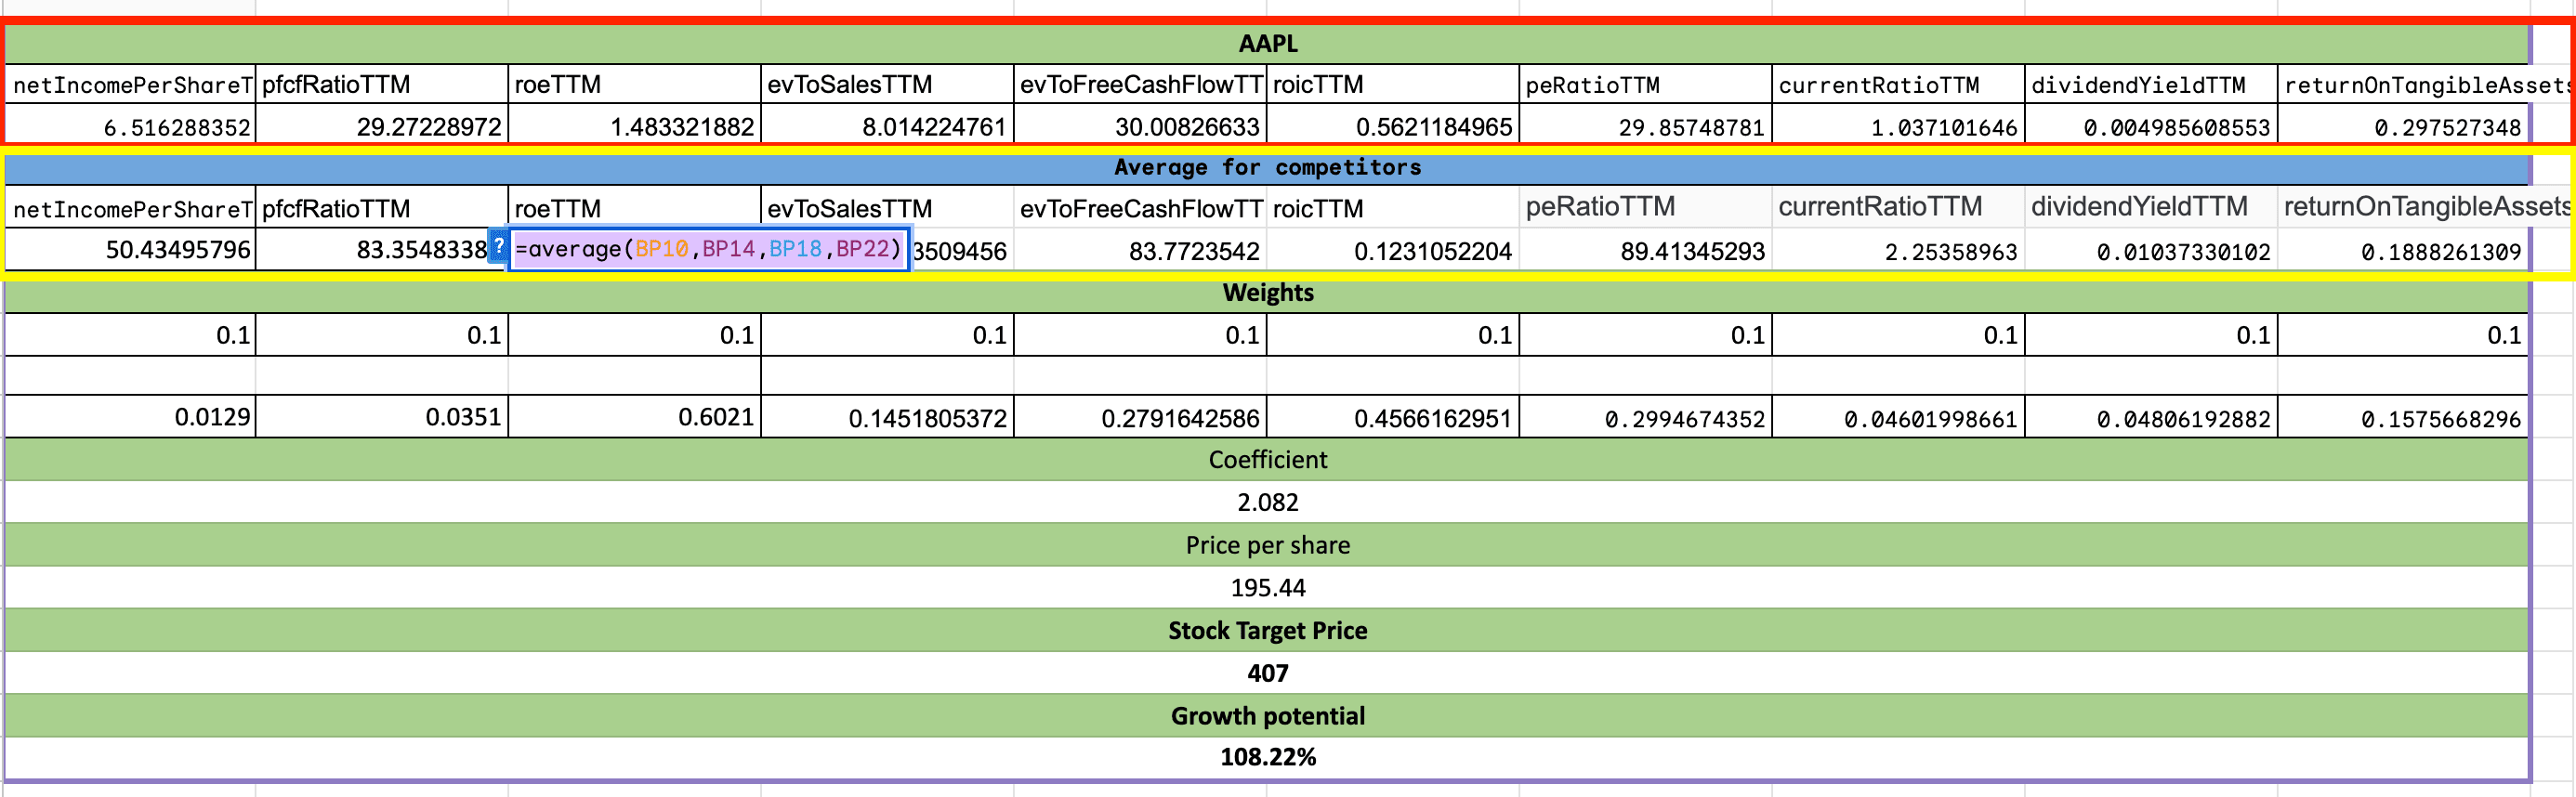
below. Hold the command key when clicking on numbers. Then do the same for other ratios and calculate the averages.
Step 3: Allocate Weights
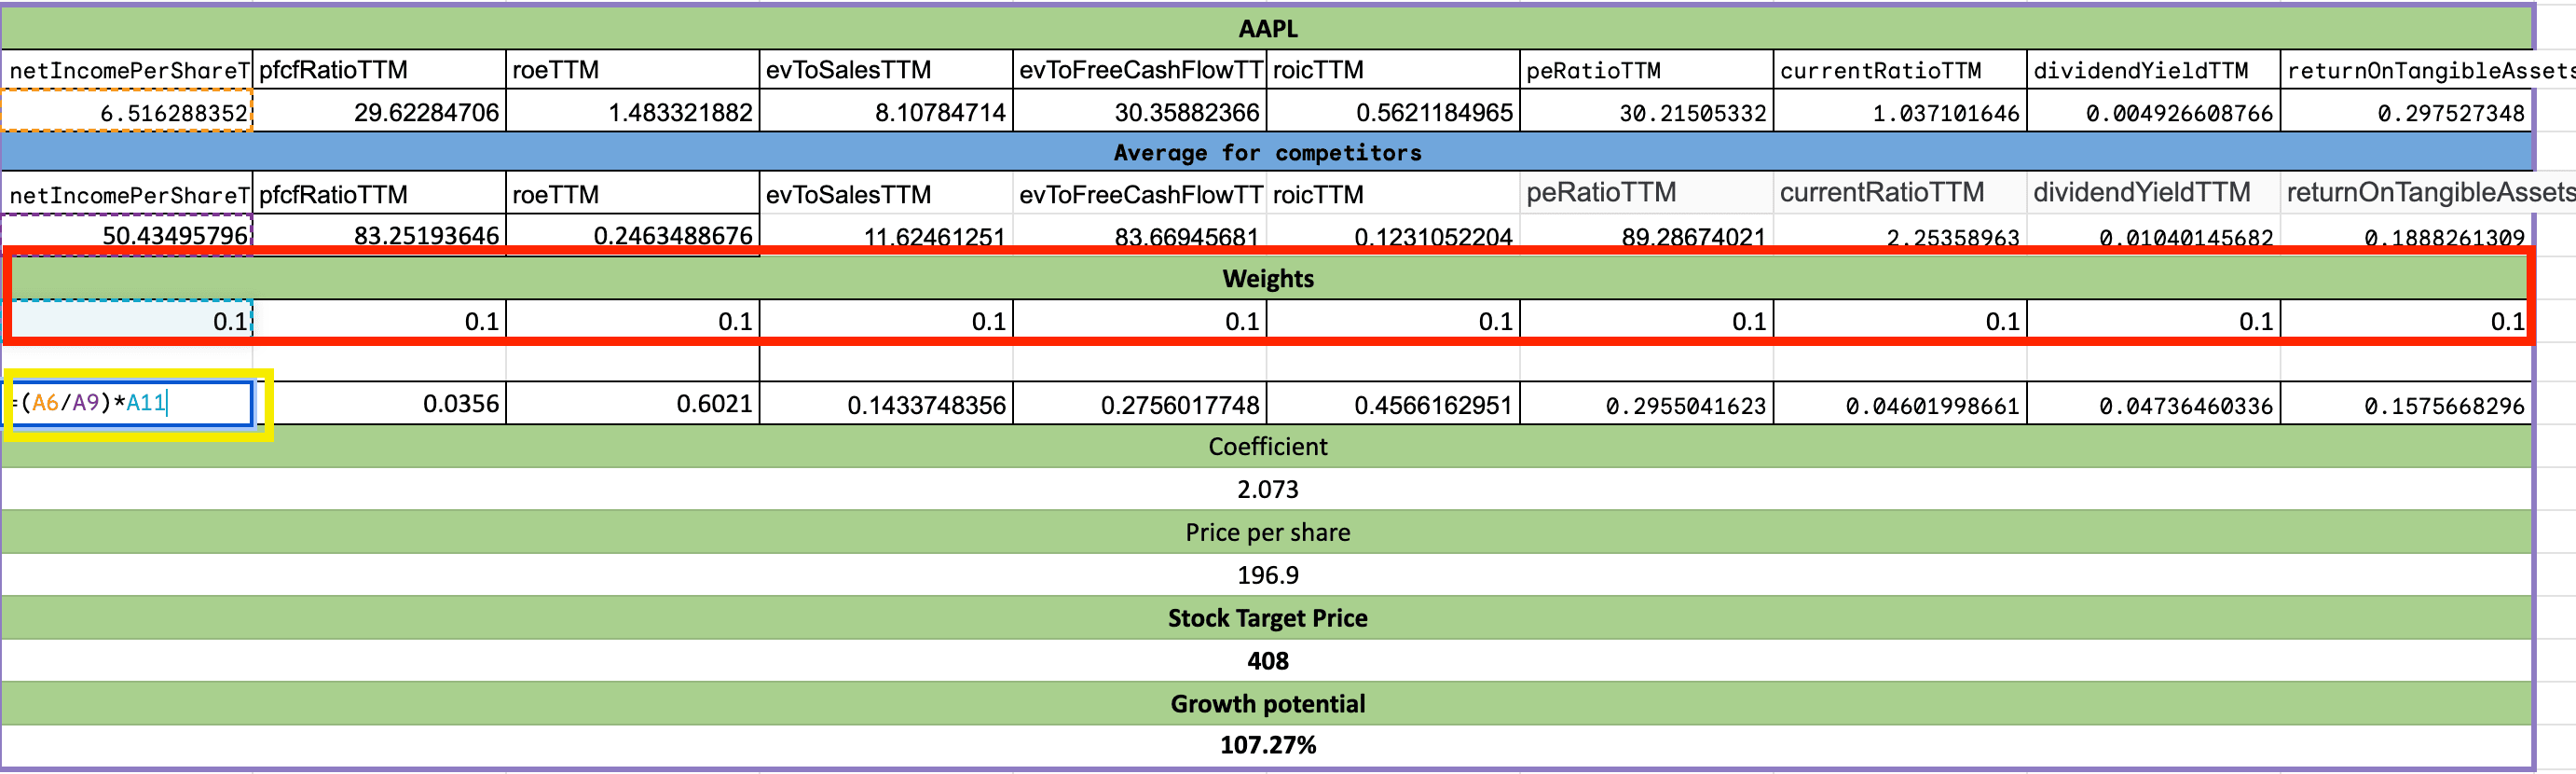
The next step is to allocate weights as shown in the picture below (marked in red). I have 10 financial ratios, so I assign 0.1 or 10% to each ratio. The sum of all weights should equal 1 or 100%. You can assign a higher weight to a particular ratio if you find it more relevant, but in this case, assign lower weights to other ratios to ensure the total equals 1. These are your assumptions.
Step 4: Calculate Coefficients
To calculate the coefficient for individual ratios, divide AAPL's netIncomePerShareTTM by the peer average netIncomePerShareTTM and multiply by your weight. The example is shown in the picture below (marked in yellow). If AAPL's netIncomePerShareTTM is higher than the peer average, this indicates AAPL is stronger than its peers, which is why we divide by the peer average. For ratios where a lower value is better, invert the calculation. For example, if considering evToSalesTTM, the lower the ratio, the better, so divide the peer average evToSalesTTM by AAPL's evToSalesTTM and multiply by 0.1. Same inverse calculation applies for evToFreeCashFlowTTM, peRatioTTM. Do similar calculations for other ratios.
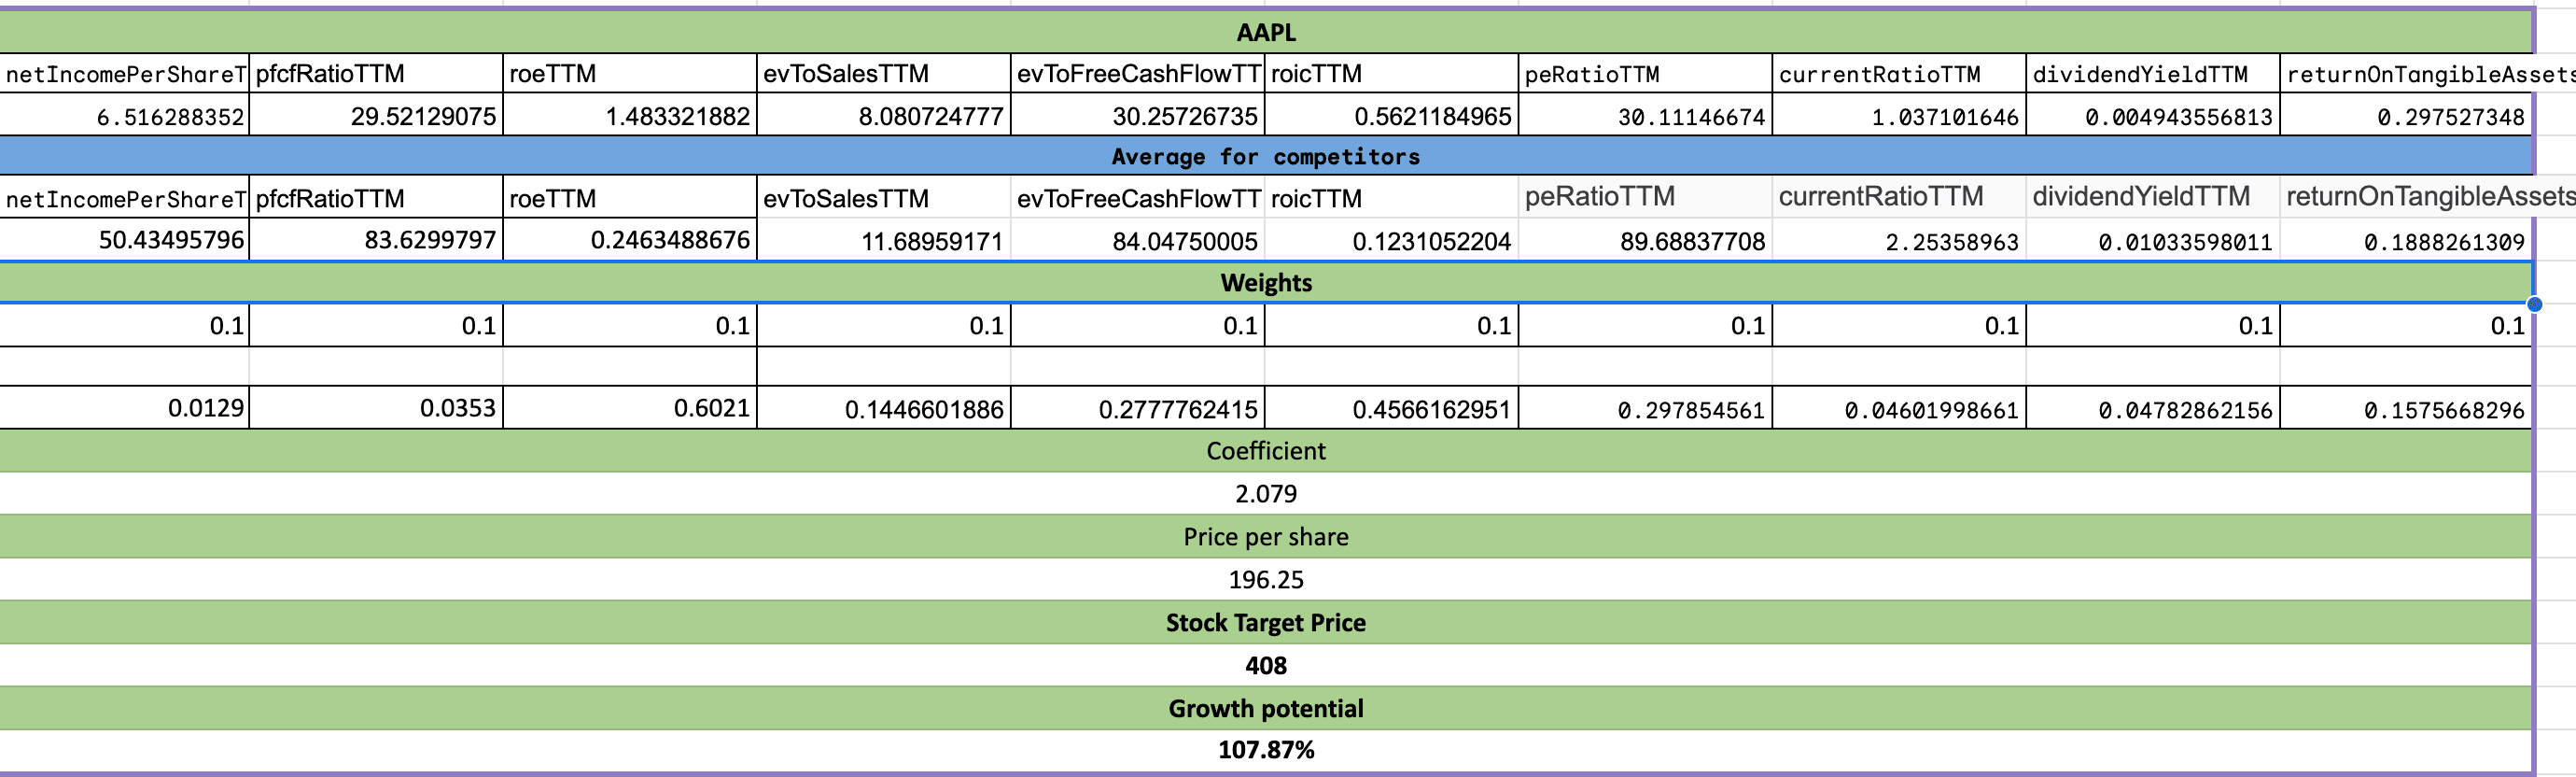
Step 5: Sum Up the Coefficients
Sum all the coefficients as shown in the picture above. In my example, the total of all individual coefficients equals 2.073.
Step 6: Input Share Price and Calculate Fair Value
The next step is to input the latest share price. In my example, AAPL's share price was $196.9 per share. Multiply this price by your coefficient which is 2.073 from our example, and you will get the stock target price, which is $408. To calculate the stock growth potential, subtract the target price from the market price and divide by the market price.
Now you know how to calculate a stock target price using a simple valuation model. Ideally, you should incorporate averages from developing countries and add custom financial ratios that best reflect the company's business. This will improve your model and make the stock target price more accurate. I hope my explanations were useful.

Top 5 Defense Stocks to Watch during a Geopolitical Tension
In times of rising geopolitical tension or outright conflict, defense stocks often outperform the broader market as gove...

Circle-Coinbase Partnership in Focus as USDC Drives Revenue Surge
As Circle Internet (NYSE:CRCL) gains attention following its recent public listing, investors are increasingly scrutiniz...

LVMH Moët Hennessy Louis Vuitton (OTC:LVMUY) Financial Performance Analysis
LVMH Moët Hennessy Louis Vuitton (OTC:LVMUY) is a global leader in luxury goods, offering high-quality products across f...

