NVDA vs AMD: Which Stock Is the Better Investment Based on Financial Ratios?
Apr 14, 2025(Last modified: Nov 19, 2025)
Are you trying to decide whether to invest in NVIDIA (NVDA) or AMD (Advanced Micro Devices)? Both companies are top players in the semiconductor industry. But if you're a smart investor, you'll want to dig deeper and look at the financial ratios before you decide. These numbers can tell you a lot about how well a company is doing.
In this article, we'll compare NVDA and AMD using key financial ratios like P/E, ROE, profit margin, and more. We'll also compare them to the industry averages. We're using the Financial Ratios API endpoint from the Financial Modeling Prep (FMP), a helpful tool that gives investors easy access to financial information.
What Is the Financial Ratios API?
If you want to get financial data like we did, you can use the Financial Ratios API. It's super easy. You just plug in the stock ticker to the endpoint and use your own API key. You can get the data in your custom app or simply use the endpoint in the browser's address bar.
Here's an example of the endpoint:
https://financialmodelingprep.com/api/v3/ratios/NVDA?apikey=your_api_key
Just change `NVDA` to any other stock ticker (like `AMD`) and insert your own `apikey`.
Now let's look at what the numbers are, after we got an API key and inputted the stock ticker to the endpoint.
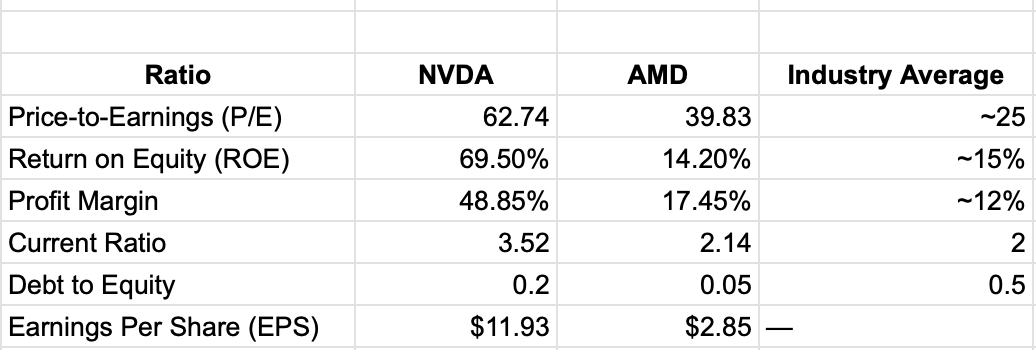
Key Financial Ratios: NVDA vs AMD
Let's break it down in simple terms.
What the Numbers Tell Us
1. Profitability: NVDA is Winning
- NVDA has a very high profit margin (48.85%) compared to AMD (17.45%) and the industry (12%). That means NVDA is making more money from every dollar of sales.
- NVDA also has a much higher ROE — nearly 70%, which is extremely strong. AMD's 14.2% is still decent, but NVDA clearly performs better.
2. Valuation: NVDA Is More Expensive
- NVDA's P/E ratio (62.74) is much higher than AMD's (39.83). This means investors are paying more for each dollar of NVDA's earnings.
- This could be because the market expects faster growth from NVDA.
3. Financial Strength: Both Are Safe
- Both companies have a strong current ratio, meaning they can easily cover their short-term debts.
- Both also have low debt, which is a good sign in case the market becomes uncertain.
4. Earnings Power: NVDA Has the Edge
- NVDA has a much higher EPS at $11.93 compared to AMD's $2.85, which shows it generates more profit per share.
So, Which Is the Better Investment?
If you're looking for a company with strong profitability, high returns, and solid financial health, then NVDA looks like the better stock to buy right now based on financial ratios. However, it's also more expensive, which might be a concern if you're looking for value.
AMD is still a good company. It has low debt, a solid profit margin, and a decent return on equity. It might be a better option if you're looking for a more affordable growth stock.
Financial ratios give us a quick way to compare companies and make smart investment choices but remember, before you invest, always do your research. These numbers are just part of the puzzle. Also check market trends, future outlooks, and other company news.

Top 5 Defense Stocks to Watch during a Geopolitical Tension
In times of rising geopolitical tension or outright conflict, defense stocks often outperform the broader market as gove...

Circle-Coinbase Partnership in Focus as USDC Drives Revenue Surge
As Circle Internet (NYSE:CRCL) gains attention following its recent public listing, investors are increasingly scrutiniz...

LVMH Moët Hennessy Louis Vuitton (OTC:LVMUY) Financial Performance Analysis
LVMH Moët Hennessy Louis Vuitton (OTC:LVMUY) is a global leader in luxury goods, offering high-quality products across f...

