FMP
What is Return on Equity, how do you calculate it, and why is it Important?
Sep 30, 2022
One of the most powerful ratios you can calculate is the profitability ratio Return On Equity (ROE). Its primary function is to tell you the expected return on investment for investors. However, using a few other analytical methods it can reveal far more information about how well the company is being managed and performing. In this article, we will answer the following:
1. What is Return on Equity?
2. How do you calculate return on equity?
3. How do you calculate future growth rate using ROE?
4. What are the drawbacks of Return on Equity?
1. What is Return on Equity?
Return on Equity calculates how much money is made based on the investors' investment in the company. Investors want to see a high return on equity ratio because this indicates that the company is using its investors' funds effectively. Since Assets = Liabilities + Equity , ROE gives deeper insight into specifically how well the company generates profit in comparison to the value of the equity held; ROE is also considered the return on net assets because Equity = Assets - Liabilities.
Return on assets is often considered a two-part ratio because it brings together the income statement (Net Income) and the balance sheet (Shareholders Equity). In summary, it shows the company's ability to convert investment equity into profit . Aka for every dollar invested how much profit is made.
2. How To calculate return on equity (ROE)?
The standard formula for calculating return on equity is:
Equation: ROE = Net Income / Average Total Equity
However, the Dupont formula (Used in Dupont analysis) returns ROE by cancelling out other accounts using simple mathematics. The advantage of this method is that you can calculate each part individually before multiplying them together to get ROE. We will dive deeper into each part in our upcoming Dupont Analysis article.
Dupont Formula:
Return on Equity = (Net Income / Sales) x (SalesTotal / Assets) x (Total Assets / Total Equity)
= Net Profit Margin x Asset Turnover x Financial Leverage
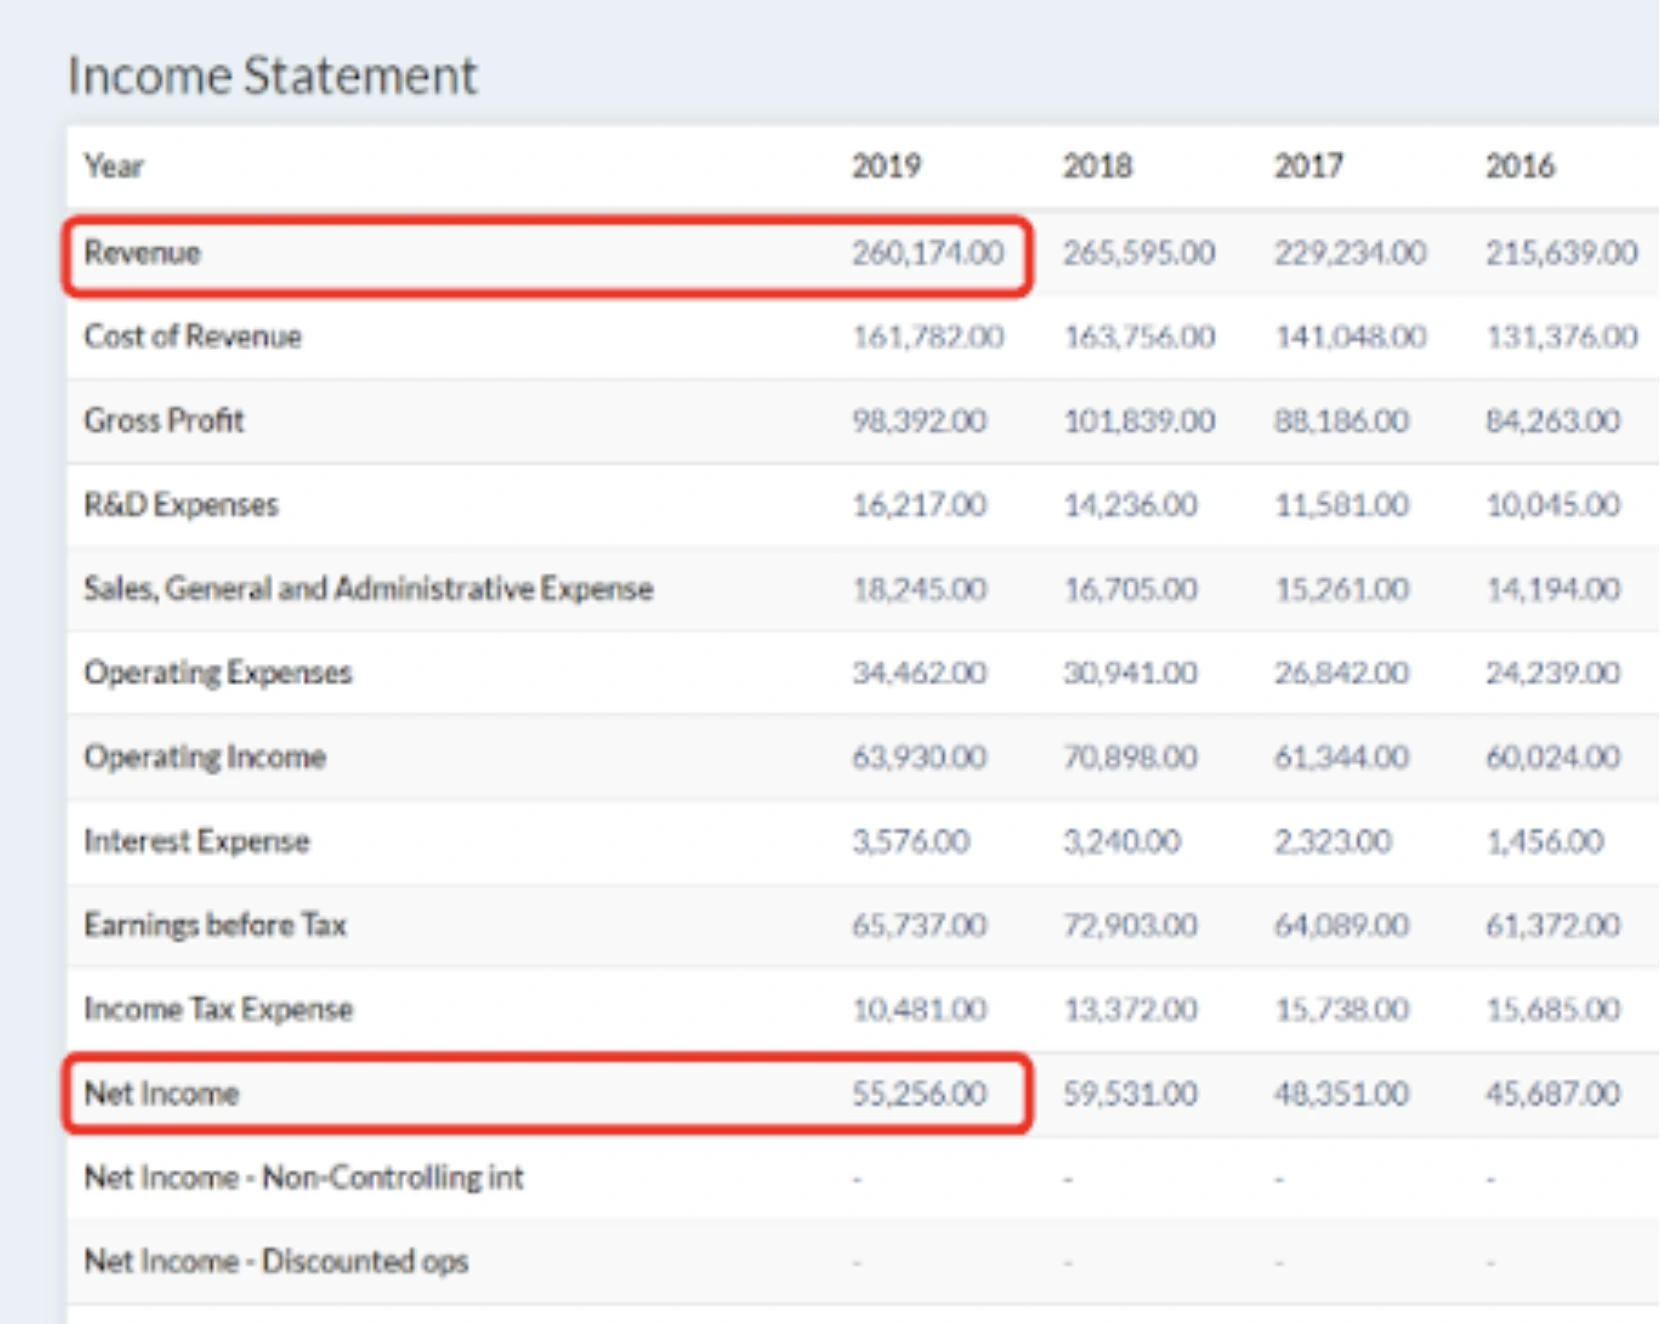
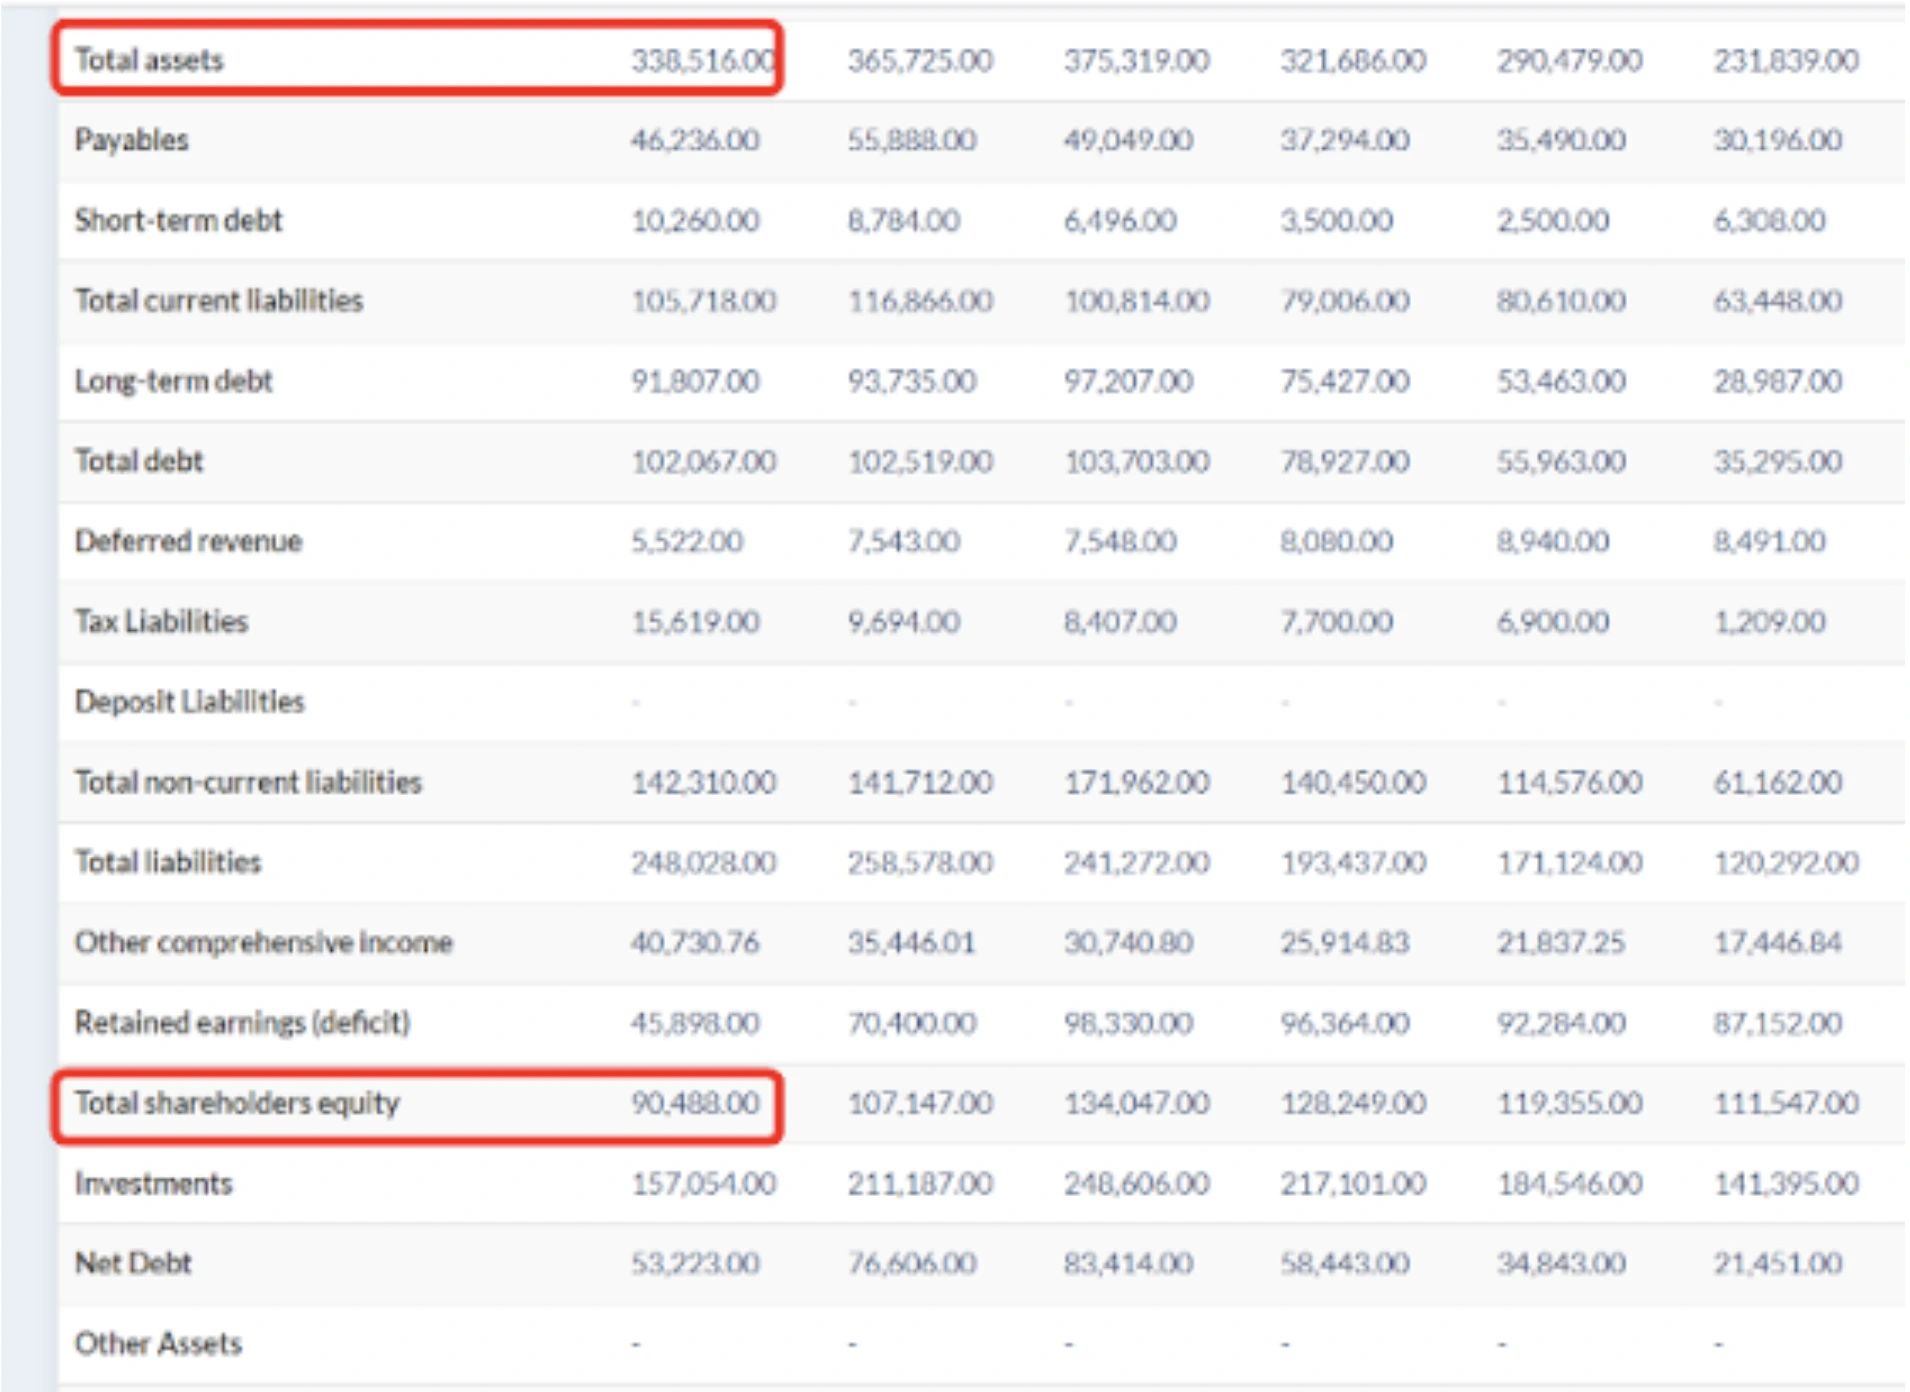
Where do I find all these numbers? Net income and Sales (Revenue) on the income statement. Total Assets and Total Equity (Shareholders Equity) are found on the balance sheet. The first image below shows Apple's income statement and the second image shows Apple's balance sheet.
Why is Return on Equity Important?
Ultimately, return on equity allows investors to determine what sort of return to expect from investing in the company and a company's management can determine how well they are using their equity. To be valuable, the current ROE must be compared to the firm's historical ROE and to industry averages. Generally a ‘good' return on equity is equal to or just above industry average. Major deviations, low and high, from the industry average are cause for concern. In terms of historical analysis, what you are looking for depends on which stage in the company life cycle the firm is in and the economic situation.
Return on Equity can also be used to estimate the future growth rate of a company and to find serious issues.
3. How do you calculate future growth rate using ROE?
A useful function of the return on equity ratio is for the purpose of determining the future growth rate of the firm's stocks and/or dividends. This is called the sustainable growth rate model. You use the ROE and Retention Rate of companies to determine what you can expect the growth to be in subsequent years. Retention Rate essentially measures how much earnings is kept by the company for use in growing future income. The formula for calculating future growth rate is simple:
Equation: Future Growth Rate = Return On Equity x Retention Ratio
Equation: Retention Ratio = Retained Earnings / Net Income
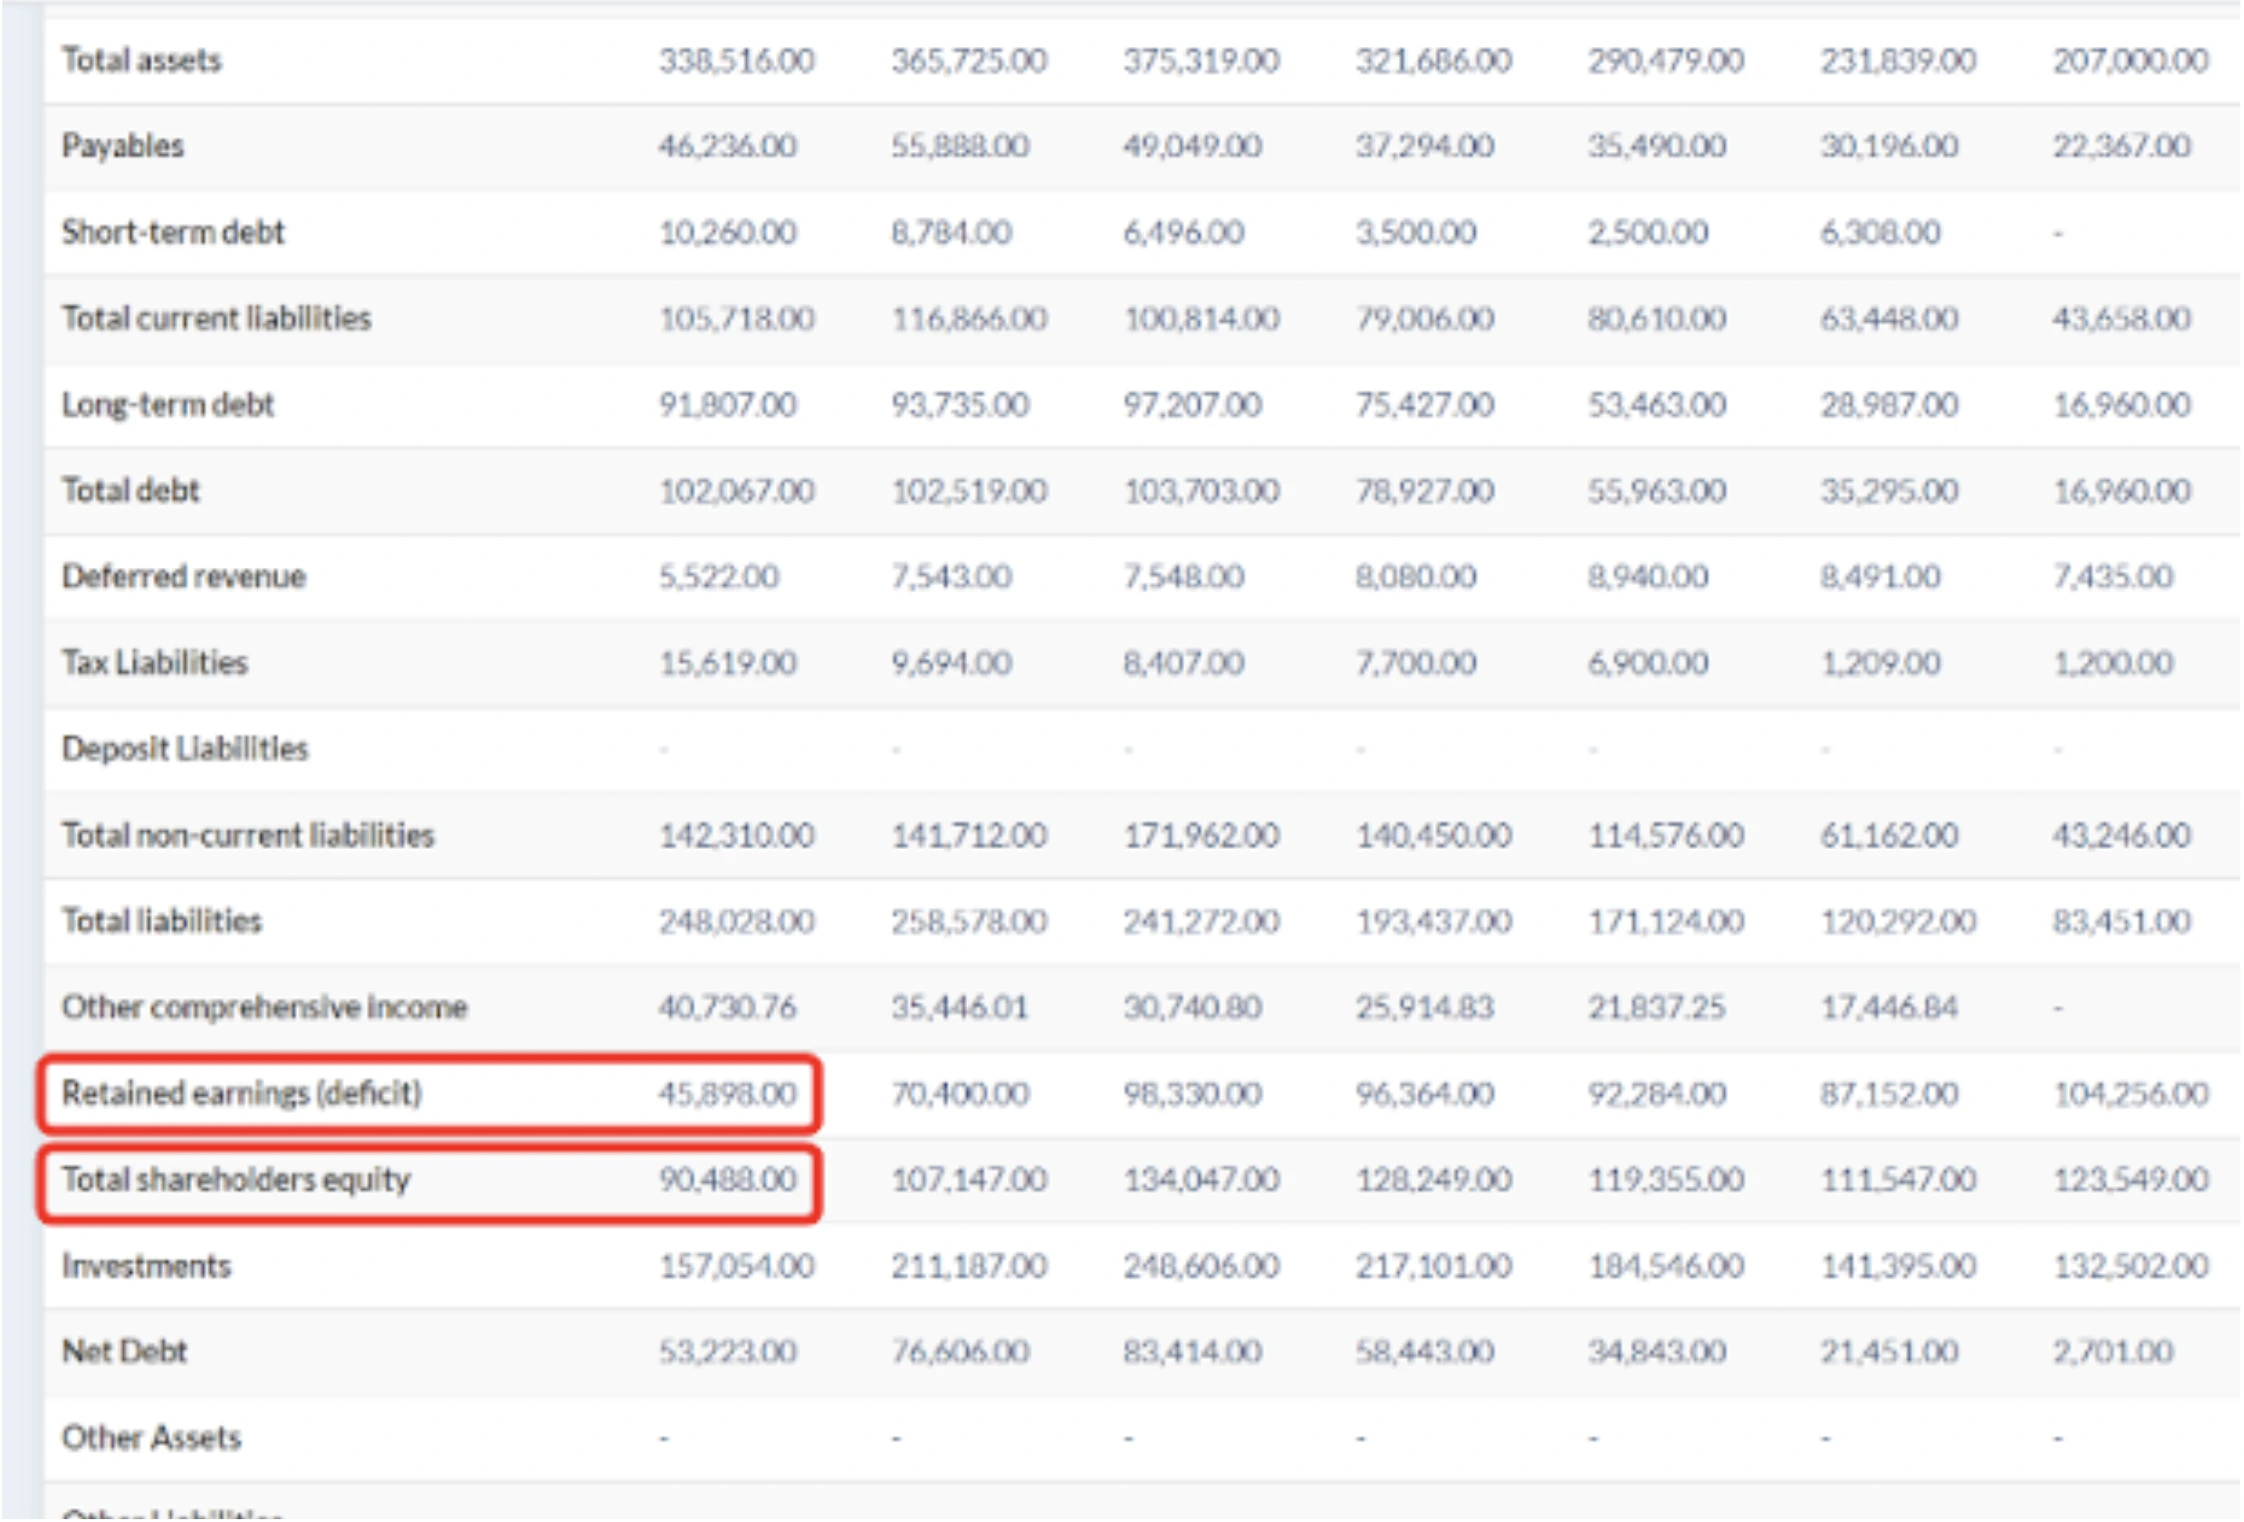
Where can I find Retained Earnings ? This is found towards the bottom of the balance sheet. The image below shows Apple's 2019 retained earnings and shareholders equity.
ROE and sustainable growth
Comparing the future growth rate is useful but if that rate is unaligned with the sustainable growth rate, then you should investigate further. The sustainable growth rate is the rate at which the company can grow without having to borrow more money; essentially, how fast can the firm grow by only using revenue created internally.
Sustainable Growth Rate = Return On Equity x (1 - Dividend Payout Ratio)
Dividend Payout Ratio = Dividends Paid / Net Income
Where can I find Dividends Paid? Dividends Paid is found in the Retained Earnings Schedule. Below is an image of Apple's Dividends Paid:
ROE to find issues
You may be inclined to think that the higher return on equity is, the better the company is performing. This is not always the case. There are few reasons for this. Generally, this is due to deflated shareholders equity which can happen for a number of reasons and is risky.
Inconsistent Performance
If a company has been losing money for the last few years, the amount of equity will have reduced. Then if the company has a great year and makes a profit, the ROE will be inflated because shareholders equity will have remained low. Perhaps, the company has changed management or introduced a new product which has led to the increased performance, this would be great and perhaps a sign that the company is undervalued by the market. However, it could also be a fortunate year for the company and, so, a historical ROE that swings should be thoroughly investigated.
Excess Debt
As we know, Assets = Liabilities + Shareholder Equity. So if a company has a large amount of debt, the relative proportion of shareholders equity will be lower. This will result in an inflated return on equity, similar to the inconsistent performance situation. You can investigate this concern by analyzing the company's debt by using the debt ratios.
4. What are the drawbacks of Return on Equity?
So, we've now seen that an unusually high return on equity may not be a good thing but the ratio itself is still useful in giving reason to investigate further. There are a couple of other issues to be aware of when using the return on equity ratio.
Share Buybacks
Return on Equity can be manipulated by share buybacks. Share buybacks are when management repurchases its shares from the marketplace. Management may do this to retain more control of the firm. This reduces the number of outstanding shares. Again, this leads to lower shareholders equity and hence an misleading return on equity calculation.
Negative Income and Equity
If both net income and shareholders equity are negative then the company is in fact performing poorly but the laws of mathematics will produce a positive figure for ROE (Two negative numbers multiplied by each other results in a positive number). This is clearly misleading. However, if either net income or equity are negative, then return on equity should not be calculated or used in any analysis.
Intangible assets
A final weakness of return on equity is how intangible assets are expressed. Intangible assets include items such as goodwill, trademarks, and other intellectual property. These inflate total assets and often result in shareholders equity being inflated to balance it. This would result in a smaller ROE and indicate poorer performance than is perhaps true. This makes it more difficult to compare against companies that choose to express their intangible assets differently. The very nature of intangible assets (they are intangible so cannot be seen and hence are difficult to calculate) makes this issue hard to negate.
Rounding Up
Return on equity gives investors a good indication of the return they will get on their investment, and allows analysts to determine future growth rate models. However, when using this ratio, you should tread carefully and be aware of the drawbacks it poses. Financial modeling prep gives FREE access to the financial statements of all SEC registered companies. So your next step is to search your favourite companies and start performing your own analysis.

Top 5 Defense Stocks to Watch during a Geopolitical Tension
In times of rising geopolitical tension or outright conflict, defense stocks often outperform the broader market as gove...

Walmart vs. Target vs. Costco: The $100 Billion Retail Media War
The U.S. retail media market is evolving into one of the most lucrative arms races in consumer tech. With ad spending on...

Circle-Coinbase Partnership in Focus as USDC Drives Revenue Surge
As Circle Internet (NYSE:CRCL) gains attention following its recent public listing, investors are increasingly scrutiniz...

