What is EBITDA? Definition, Formula, and Why Analysts Use It
Sep 14, 2025
According to CFA Institute curriculum materials, EBITDA is among the most frequently used metrics in relative valuation, particularly when comparing companies across industries.
For research analysts and associates, understanding what is EBITDA (Earnings Before Interest, Taxes, Depreciation, and Amortization) is a fundamental step toward mastering financial modeling and valuation. This metric serves as a critical starting point in many financial analyses, from comparable company analysis to leveraged buyout (LBO) models.
This guide will demystify what EBITDA is, show you how to calculate it, and explain its strategic importance, as well as its limitations, for finance professionals.
EBITDA Definition and Core Concept
EBITDA is a measure of a company's operational performance. It is a non-GAAP (Generally Accepted Accounting Principles) metric that strips away the effects of a company's financing decisions, tax environment, and non-cash accounting practices.
By excluding these factors, EBITDA provides a clearer, more standardized view of a business's operational profitability. It is often used as a proxy for the cash flow generated from core operations, allowing analysts to compare the underlying business performance of different companies more directly, regardless of their capital structure or tax jurisdiction.
Breaking Down Each Component
The acronym itself reveals how the metric is constructed:
- Earnings (Net Income): This is the starting point for calculating EBITDA. It represents the company's total revenue minus all expenses, including interest, taxes, depreciation, and amortization.
- Interest & Taxes: Analysts add these back to net income. Interest expense is a function of a company's debt structure, not its operational efficiency. Taxes are influenced by jurisdiction and are often a separate management decision. By adding them back, analysts can compare the operational profitability of two companies with different debt loads or tax rates.
- Depreciation & Amortization: These are non-cash expenses. Depreciation accounts for the wear and tear of a physical asset (e.g., machinery), while amortization applies to an intangible asset (e.g., a patent). Since no cash is leaving the company when these are expensed, adding them back provides a closer approximation of the cash generated from operations.
How to Calculate EBITDA from Financial Statements
Calculating what is EBITDA is straightforward once you know where to find the necessary components. The two primary formulas are:
- Formula 1 (from Net Income):
EBITDA = Net Income + Interest Expense + Tax Expense + Depreciation + Amortization - Formula 2 (from Operating Income):
EBITDA = Operating Income (EBIT) + Depreciation + Amortization
Most financial professionals prefer the second formula because it requires fewer adjustments. The challenge in practice is consistently finding all the data points across different companies and filings.
Analysts often pull company financials directly from the FMP Income Statement API to calculate EBITDA consistently across peers. This automated process ensures accuracy and saves significant time, a critical advantage in fast-paced deal environments.
Step-by-Step Example
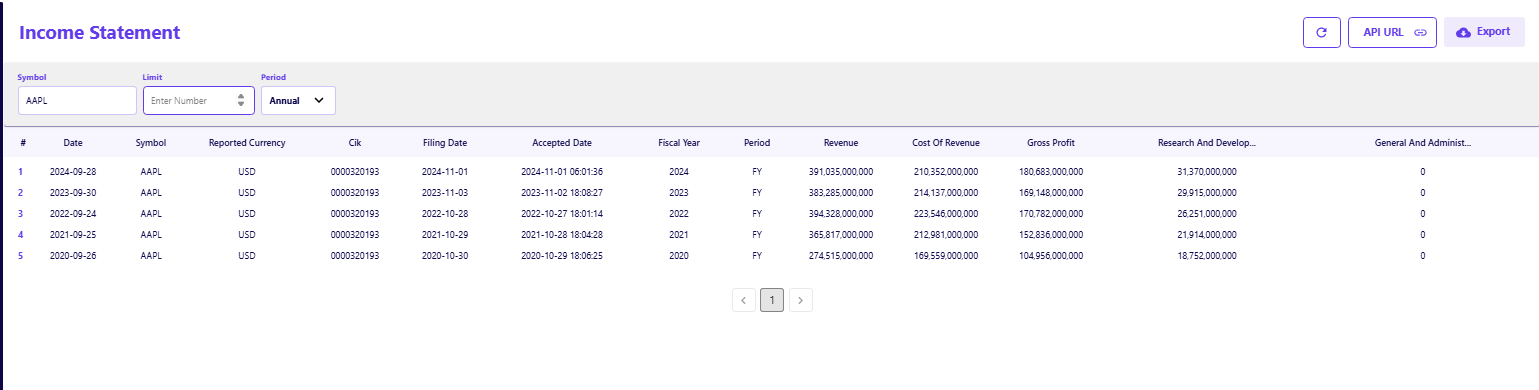
Let's use Apple's (AAPL) income statement for its fiscal year ending September 30, 2023, to demonstrate how EBITDA is calculated in practice. Using the provided data, we can reconcile the calculation from net income.
- Net Income: $96,995,000,000
- Interest Expense: $3,933,000,000
- Tax Expense: $16,741,000,000
- Depreciation & Amortization: $11,519,000,000
Using Formula 1 to reconcile from Net Income:
EBITDA = $96,995M (Net Income) + $3,933M (Interest) + $16,741M (Taxes) + $11,519M (D&A)
EBITDA = $129,188,000,000
This step-by-step process shows how to arrive at a company's core operational earnings by adding back non-operational and non-cash charges.
Why Analysts Use EBITDA in Valuation
EBITDA's prevalence in financial analysis stems from its utility as a standardized metric. It allows for a more "apples-to-apples" comparison between companies by removing the idiosyncratic effects of capital structure, tax policy, and asset-based accounting. This makes it an invaluable tool for:
- Universality and Comparability: As a standard measure, EBITDA is used across a wide range of industries, from manufacturing to software. It helps level the playing field when a tech company with minimal physical assets is being compared to a capital-intensive manufacturing firm with high depreciation charges.
- Use in Multiples: The Enterprise Value-to-EBITDA (EV/EBITDA) multiple is a staple of relative valuation. It measures the total value of a company (Enterprise Value or "EV") relative to its operating earnings. Because EV accounts for both equity and debt, the EV/EBITDA multiple is a superior way to compare companies with different financing structures than, for instance, the price-to-earnings (P/E) ratio.
Situations Where EBITDA is Most Significant
EBITDA's use case shines in specific financial contexts:
- Mergers & Acquisitions (M&A): Acquirers often use EBITDA to quickly assess the core profitability of a target company. This helps determine a potential transaction value independent of the target's existing debt.
- Leveraged Buyouts (LBOs): In an LBO, a company is acquired primarily with borrowed funds. LBO models heavily rely on EBITDA as a proxy for the cash flow available to service the acquisition debt.
- Comparing Capital-Intensive Businesses: Industries like airlines, telecommunications, and manufacturing have significant upfront capital expenditures and, consequently, high depreciation. EBITDA allows analysts to compare the operational performance of companies within these sectors without the distortion of large, non-cash charges.
Common Myths and Misuses of EBITDA
While powerful, EBITDA is not a perfect metric. Its non-GAAP nature means it can be subject to manipulation, and relying on it alone can lead to flawed conclusions.
- Myth 1: “EBITDA equals cash flow.” This is a common and dangerous misconception. EBITDA does not account for changes in working capital (e.g., changes in accounts receivable and inventory) or, crucially, capital expenditures (capex). A company can have high EBITDA but a negative free cash flow if it is aggressively spending on new equipment.
- Myth 2: “EBITDA shows profitability.” EBITDA is a measure of operational earnings, not final profitability. It ignores interest costs, which can be substantial for highly leveraged firms. A company with high EBITDA might still be unprofitable on a net income basis due to high debt payments.
- Myth 3: “Higher EBITDA always means stronger business.” The quality of earnings matters. A company might have inflated EBITDA by deferring maintenance, neglecting R&D, or engaging in aggressive accounting.
Beyond EBITDA - Key Metrics That Matter
A seasoned analyst never relies on EBITDA in isolation. To get a complete picture, it must be supplemented with other metrics, particularly those that account for the costs it conveniently ignores. This blended approach is essential for avoiding distorted conclusions.
For example, the FMP Key Metrics TTM API helps compare EV/EBITDA against EV/Free Cash Flow (EV/FCF) to get a fuller picture of valuation. A large disparity between these two multiples could indicate a company is not generating sufficient cash flow to cover its capital expenditures, making it a high-risk investment despite a strong EBITDA figure.
Strategic Takeaway
For a junior analyst, the key lesson is this: use EBITDA as a valuable, standardized starting point for your analysis. Then, always supplement it with cash flow metrics (such as Free Cash Flow to Firm or Free Cash Flow to Equity) and measures of capital intensity. For a CFO or senior strategist, this means using a suite of metrics to validate the story the numbers are telling, always asking, "Where is the cash?"
Practical Use-Cases for Research Analysts
EBITDA is more than an abstract concept; it is a practical tool used daily in finance.
- Equity Research Reports: Analysts frequently use EBITDA and related metrics to support their "buy," "sell," or "hold" recommendations. It helps them justify a target price in a comparable company analysis.
- Screening for Comps: Before building a full model, analysts use EBITDA-based multiples to quickly screen for a list of comparable companies.
- Investment Memos or Pitch Books: EBITDA is a go-to metric for summarizing a company's operational performance in concise, high-level presentations to a team or client.
Test how EBITDA compares to other metrics in real-time using the FMP Key Metrics TTM API—an easy way to see if a company's multiple is justified.
Demystifying EBITDA as a Starting Point
At its core, EBITDA is a powerful analytical tool, not a standalone truth. By stripping away non-operational and non-cash items, it provides a transparent view of a company's core earning power. This makes it an essential first step in a wide range of financial analyses, from corporate valuation to credit analysis.
Analysts who master EBITDA understand both its utility and its limitations. They use it as a starting point for comparisons, but they always contextualize it with a deeper understanding of a company's cash flow, debt, and capital needs.
To continue your journey into advanced financial analysis, explore more financial datasets to refine your valuation approach with FMP's full suite of APIs, and gain a strategic advantage by Turning Earnings Disappointments into Strategic Advantage with FMP Data.
FAQs
What is EBITDA in simple terms?
EBITDA is a quick way to measure a company's operational performance before accounting for the effects of interest, taxes, or non-cash charges like depreciation and amortization. It helps you see how a company's core business is performing.
How is EBITDA calculated from an income statement?
The most common way is to start with a company's operating income (also known as EBIT) and then add back the non-cash expenses of depreciation and amortization, which are typically found on the cash flow statement or in the notes to the financial statements.
Why do analysts prefer EV/EBITDA over P/E ratio?
Analysts prefer EV/EBITDA because it provides a more accurate comparison between companies with different capital structures (i.e., different levels of debt). P/E (Price-to-Earnings) is an equity-based multiple, while EV/EBITDA is a firm-based multiple that considers both debt and equity.
Is EBITDA the same as cash flow?
No, EBITDA is not the same as cash flow. While it is often used as a proxy for cash flow from operations, it does not account for crucial cash expenditures such as capital expenditures (capex) or changes in working capital.
What industries rely most on EBITDA for valuation?
Capital-intensive industries with high depreciation and amortization charges, such as manufacturing, airlines, telecommunications, and energy, rely most heavily on EBITDA for valuation and comparability.
Can EBITDA be negative, and what does that mean?
Yes, EBITDA can be negative. A negative EBITDA indicates that a company's core operations are not generating enough revenue to cover their direct operating expenses, suggesting the business is fundamentally unprofitable.
What's the difference between EBIT and EBITDA?
The key difference between EBIT (Earnings Before Interest and Taxes) and EBITDA is the exclusion of depreciation and amortization. EBITDA adds back these non-cash expenses, making it a better proxy for a company's gross operational cash flow than EBIT.

Top 5 Defense Stocks to Watch during a Geopolitical Tension
In times of rising geopolitical tension or outright conflict, defense stocks often outperform the broader market as gove...

Circle-Coinbase Partnership in Focus as USDC Drives Revenue Surge
As Circle Internet (NYSE:CRCL) gains attention following its recent public listing, investors are increasingly scrutiniz...

LVMH Moët Hennessy Louis Vuitton (OTC:LVMUY) Financial Performance Analysis
LVMH Moët Hennessy Louis Vuitton (OTC:LVMUY) is a global leader in luxury goods, offering high-quality products across f...

