FMP

FMP

Enter

The Power of Visual Storytelling with Data Data Visualization's Impact Discover how data visualization transcends traditional data representation, making co

Finance Data

Data Visuals

Visualizations

Data Storytell

Infographics

Presenting Insights: Visual Storytelling through Data Representation

Jan 8, 2024 8:45 AM - Parth Sanghvi

twitterlinkedinfacebook
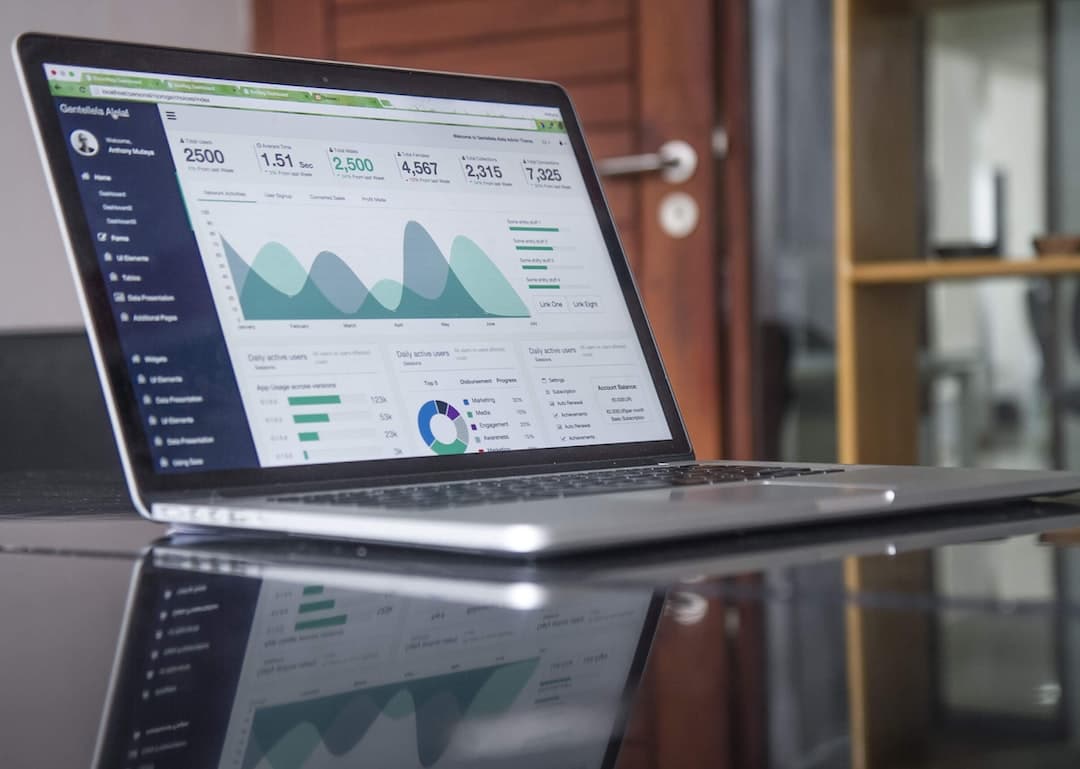
blog post cover photo

Image credit: Carlos Muza

The Power of Visual Storytelling with Data

Data Visualization's Impact

Discover how data visualization transcends traditional data representation, making complex information more understandable and engaging. Visual storytelling transforms numbers into compelling narratives.

Communicating Insights

Visual storytelling effectively communicates complex data insights to diverse audiences. Understand the power of compelling visuals in simplifying intricate information for enhanced comprehension.

Leveraging Infographics and Information Design

Infographics as Narrative Tools

Explore how infographics serve as powerful narrative tools. By blending data points with captivating design, they create compelling stories that resonate with audiences.

Information Design Principles

Understand the core principles of information design. From color theory to layout and typography, learn how design elements influence data communication.

Crafting Engaging Visual Narratives

Interactive Data Visualization

Harness the potential of interactive visualizations. These dynamic tools allow audiences to explore data interactively, empowering them to extract personalized insights.

Tailoring Visuals for Audience Engagement

Adapt data visualization to resonate with the audience. Customizing visuals based on audience preferences ensures maximum engagement and comprehension.

Tools and Techniques for Effective Data Storytelling

Data Visualization Tools

Discover an array of data visualization tools. Explore their functionalities and find the right fit for your storytelling needs, from simple graph generators to sophisticated data storytelling platforms.

Incorporating Storytelling in Data

Learn how to integrate storytelling techniques into data representation. Crafting narratives around data adds context and emotional resonance, enhancing the impact of your message.

Conclusion: Empowering Communication through Visual Storytelling

Visual storytelling with data is a powerful communication tool. By mastering the art of data visualization, businesses can effectively convey insights, simplify complexities, and drive informed decision-making. Embrace the art of visual storytelling to unlock the potential of data and captivate your audience.

Other Blogs

Sep 11, 2023 1:38 PM - Rajnish Katharotiya

P/E Ratios Using Normalized Earnings

Price to Earnings is one of the key metrics use to value companies using multiples. The P/E ratio and other multiples are relative valuation metrics and they cannot be looked at in isolation. One of the problems with the P/E metric is the fact that if we are in the peak of a business cycle, earni...

blog post title

Sep 11, 2023 1:49 PM - Rajnish Katharotiya

What is Price To Earnings Ratio and How to Calculate it using Python

Price-to-Earnings ratio is a relative valuation tool. It is used by investors to find great companies at low prices. In this post, we will build a Python script to calculate Price Earnings Ratio for comparable companies. Photo by Skitterphoto on Pexels Price Earnings Ratio and Comparable Compa...

blog post title

Oct 17, 2023 3:09 PM - Davit Kirakosyan

VMware Stock Drops 12% as China May Hold Up the Broadcom Acquisition

Shares of VMware (NYSE:VMW) witnessed a sharp drop of 12% intra-day today due to rising concerns about China's review of the company's significant sale deal to Broadcom. Consequently, Broadcom's shares also saw a dip of around 4%. Even though there aren’t any apparent problems with the proposed solu...
blog post title
FMP

FMP

Financial Modeling Prep API provides real time stock price, company financial statements, major index prices, stock historical data, forex real time rate and cryptocurrencies. Financial Modeling Prep stock price API is in real time, the company reports can be found in quarter or annual format, and goes back 30 years in history.
twitterlinkedinfacebookinstagram
2017-2024 © Financial Modeling Prep