FMP
Tracking Post-Earnings Announcement Drift with FMPs Market Data
Aug 27, 2025(Last modified: Nov 28, 2025)
When earnings season hits, stock prices don't just react in the moment—they often keep moving in a pattern that savvy traders can spot and quantify.
This article dives into Post-Earnings Announcement Drift (PEAD), unpacking why it happens, how to measure it, and—most importantly—how to model and test it with Financial Modeling Prep's market data. We'll bridge the gap between theory and actionable execution so you can evaluate whether PEAD-based strategies deserve a place in your trading playbook.
What is Post-Earnings Announcement Drift?
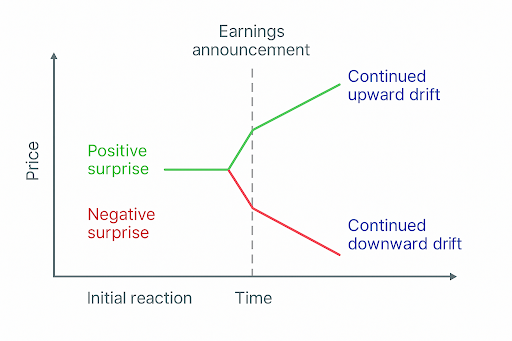
Post-Earnings Announcement Drift — also known as post-earnings drift or post-earnings announcement price drift—is a market anomaly in which a stock's price continues to move in the same direction as an earnings surprise well after the initial announcement.
This delayed price adjustment often unfolds over weeks, and in some cases months, as the market gradually absorbs and reacts to the new information.
Post-Earnings Drift Definition
Post-earnings drift is the market pattern in which a stock's price continues trending in the same direction as its earnings surprise for a period after the announcement. An earnings beat often extends into further gains beyond the initial jump, while an earnings miss can result in continued declines. This elaborates on the concept by highlighting the delayed market reaction and its role as a consistent, measurable input for strategy design.
Earnings Surprise
An earnings surprise occurs when a company's reported earnings differ from analyst or investor expectations.
- Positive surprises (earnings beats) typically trigger an initial price jump, followed by continued gains.
- Negative surprises (earnings misses) often cause an initial drop, followed by a continued decline.
Duration & Magnitude
While the drift effect historically persisted for several weeks or months, its magnitude has moderated over time as markets have become more efficient and arbitrageurs have acted on the signal. Still, post-earnings announcement drift remains a repeatable and measurable phenomenon in many market conditions.
Existence and Evolution of PEAD
Post-earnings announcement drift still exists today, though its magnitude has declined compared to earlier decades. Improvements in market efficiency, faster data dissemination, algorithmic trading, and changes in earnings disclosure practices have all contributed to a reduced but still measurable drift effect. Signal informativeness—how much earnings news tells us about future performance—also plays a role, with reduced persistence in less informative environments.
Potential Explanations for Post-Earnings Announcement Drift
While no single theory has been universally accepted, research often points to investor underreaction as the most consistent explanation. Several contributing factors include:
- Limited attention and cognitive biases: Investors may not fully process all details in earnings announcements immediately due to attention limits and behavioral biases such as anchoring or confirmation bias.
- Delayed disclosure and information complexity: Complex business structures or staggered release of financial details can slow investor interpretation and pricing.
- Limits to arbitrage: Trading frictions like transaction costs, liquidity constraints, and volatility can prevent arbitrageurs from quickly correcting mispricing. Drift tends to be stronger in lower-liquidity stocks, those with higher transaction costs, or lower institutional ownership.
- Earnings persistence: A decline in the persistence of earnings news can reduce the informativeness of PEAD signals over time, making future returns harder to predict.
- Market sentiment and expectations: Even strong earnings beats can lead to price declines if forward guidance disappoints, expectations are unrealistically high, or investors engage in profit-taking.
Measurement and Detection of PEAD
- Standardized Unexpected Earnings (SUE): The difference between actual earnings and expected earnings—often based on analyst forecasts or time-series models—normalized by the standard deviation of past earnings.
- Cumulative Abnormal Returns (CARs): Summing the abnormal returns over a defined window around the earnings announcement to capture the full effect of the news.
- Overnight Returns (OR): Isolating returns between the market close before the announcement and the open after can help capture immediate reaction to unexpected information.
- Seasonal Random-Walk Model: Defining unexpected earnings as the difference between the most recent quarterly earnings and those from the same quarter a year earlier, scaled by prior market capitalization.
Practical Implementation Framework
This section provides a clear, actionable roadmap for moving from theoretical understanding of post-earnings announcement drift to a tested, data-driven trading approach. It explains the workflow from data collection to scoring and backtesting, ensuring that each stage is designed for realistic execution and reliable signal validation.
Workflow Overview
The process of modeling post-earnings announcement drift follows a structured workflow:
Market Calendar → Historical Data → Processing → Scoring → Backtest
1. Market Calendar - Begin by pulling company earnings dates, analyst estimates, and actual results from the Market Calendar API.
2. Historical Data - Collect price and volume data surrounding each announcement to measure the market's reaction.
3. Processing - Clean and align the datasets, calculate earnings surprises, and normalize values for comparability.
4. Scoring - Assign drift scores based on factors such as surprise magnitude, abnormal volume, and persistence of excess returns.
5. Backtest - Test the strategy under realistic conditions, incorporating costs, liquidity limits, and multiple market regimes to validate robustness.
Example API Call and Process Walk Through
Step 1: Get earnings events.
Call the FMP Market Calendar API to retrieve earnings calendar data between the start and end dates you define. Replace the endpoint and parameters as needed. This typically involves sending an HTTP GET request using a library like requests in Python or an SDK provided by FMP.
|
`https://financialmodelingprep.com/stable/earning_calendar?from={start_date}&to={end_date}&apikey={api_key}` |
After receiving the JSON response, you would parse it into a usable format for further processing.
Step 2: Fetch historical prices for each event returned.
Retrieve closing prices over the period following the earnings announcement.
Step 3: Calculate excess returns
Compare the stock's performance to a benchmark (such as a sector ETF) over the same period.
Step 4: Score the drift
Base this score on factors like earnings surprise magnitude, trading volume spike, and persistence of the excess return.
Backtesting Considerations
Before acting on a post-earnings announcement drift strategy, it's critical to validate its performance under realistic conditions. Robust backtesting ensures the results aren't inflated by unrealistic assumptions and helps identify how the approach might perform across different environments.
- Avoid look-ahead bias: Ensure all calculations use only the data that would have been available at the time of the decision to avoid overstating potential performance.
- Adjust for survivorship bias: Include delisted or bankrupt companies in the dataset to reflect a realistic trading universe and prevent inflated historical returns.
- Factor in slippage and transaction costs: Model realistic entry and exit prices that account for bid-ask spreads, market impact, and broker fees.
- Incorporate liquidity constraints: Avoid assuming execution of large trades in illiquid securities without affecting the price.
- Test multiple market regimes: Backtest across bull, bear, and sideways markets to evaluate robustness.
- Validate with out-of-sample tests: Split data into training and testing sets or use walk-forward testing to avoid overfitting.
Trading Mechanics - How to Trade PEAD
A typical post-earnings announcement drift trading process may include:
- Entry trigger: Buy a stock if earnings surprise exceeds a set positive threshold (e.g., +5%) and volume spikes above average; short if surprise is below a negative threshold.
- Holding period: Hold positions for a pre-defined window, often 5-20 trading days, depending on backtested decay patterns.
- Exit rule: Exit when the signal decays, a stop-loss is triggered, or the holding period expires.
Post Earnings Announcement Drift Strategy Variations
Before diving into specific approaches, it's useful to recognize that post-earnings announcement drift can be expressed in different ways depending on portfolio objectives, risk tolerance, and market conditions. Adjusting the parameters or combining the signal with other factors can help tailor strategies to distinct use cases.
- Holding period optimization: Test multiple horizons (e.g., 5-day, 10-day, 20-day) to identify optimal exit.
- Factor combination: Blend PEAD with momentum indicators for stronger conviction.
- Coverage filters: Segment by analyst coverage to test whether drift is stronger in low-coverage stocks.
- Sector targeting: Focus on sectors with historically higher drift persistence, such as tech or biotech.
Timing Considerations - Before or After Earnings?
Buying before earnings can capture the announcement reaction but exposes the trader to event risk if results disappoint. Buying after a confirmed positive surprise may miss some initial upside but aligns the trade with the observed drift, reducing the risk of being on the wrong side of a surprise.
Risk and Limitations Deep Dive
While post-earnings announcement drift offers attractive opportunities, it's equally important to understand the scenarios and conditions where the strategy may underperform or fail.
Recognizing these limitations allows for more resilient design, better risk controls, and improved decision-making before capital is committed.
- Market shocks: Macro events can overwhelm drift patterns.
- False positives: Filter with liquidity, volatility, and sentiment to reduce noise.
- Liquidity crunches: In thinly traded stocks, execution risk can erode theoretical gains.
- High-volatility regimes: Drift persistence can be shortened or reversed.
Efficient Market Hypothesis Connection
Post-earnings announcement drift challenges the semi-strong form of the Efficient Market Hypothesis, which asserts that all publicly available information is instantly and fully reflected in stock prices. The existence of delayed price adjustment suggests that markets sometimes underreact to earnings news, leaving exploitable patterns that can be systematically studied and potentially acted upon.
This underreaction forms the theoretical foundation for many PEAD-based strategies, as it highlights a persistent gap between information release and full price incorporation.
Modeling Post-Earnings Drift with Historical Market Data
Using FMP's Historical Market Data and Market Calendar APIs, you can model and test post-earnings announcement drift systematically. Consider expanding the workflow with these additional steps to strengthen your analysis and improve execution quality:
- Identify Earnings Events
Extract earnings dates, consensus estimates, and actual results. Calculate earnings surprise magnitudes. - Measure Price & Volume Reactions
Track close-to-close returns over rolling windows and analyze abnormal volume. - Calculate Excess Returns
Adjust returns against a relevant index or sector ETF. - Test Signal Decay
Determine the persistence of the drift. - Build Drift Scoring Models
Rank events by surprise magnitude, liquidity profile, and initial reaction. - Segment and Compare
Break down results by sector, market cap, or analyst coverage to find where drift is most persistent. - Backtest with Robust Controls
Incorporate slippage, transaction costs, and liquidity constraints. Validate with out-of-sample and walk-forward testing. - Visualize Results
Plot CARs, signal decay curves, and distribution of drift scores to confirm statistical and practical significance.
Post Earnings Announcement Drift Example
Below is a fictional, educational example to illustrate the process from concept to execution. All data is entirely made up and should not be used for actual trading decisions.
Hypothesis: Large positive earnings surprises will, on average, lead to a sustained upward drift in stock prices over the subsequent 10 trading days.
- Step 1 - Select the API:
Use FMP's Market Calendar API for fictional earnings dates and estimates, and Historical Market Data API for fictional price and volume data. - Step 2 - Use the API Key:
With a placeholder API key (demo_key_123), call the Market Calendar endpoint to retrieve fictional Q1 earnings events. - Step 3 - Identify Earnings Events:
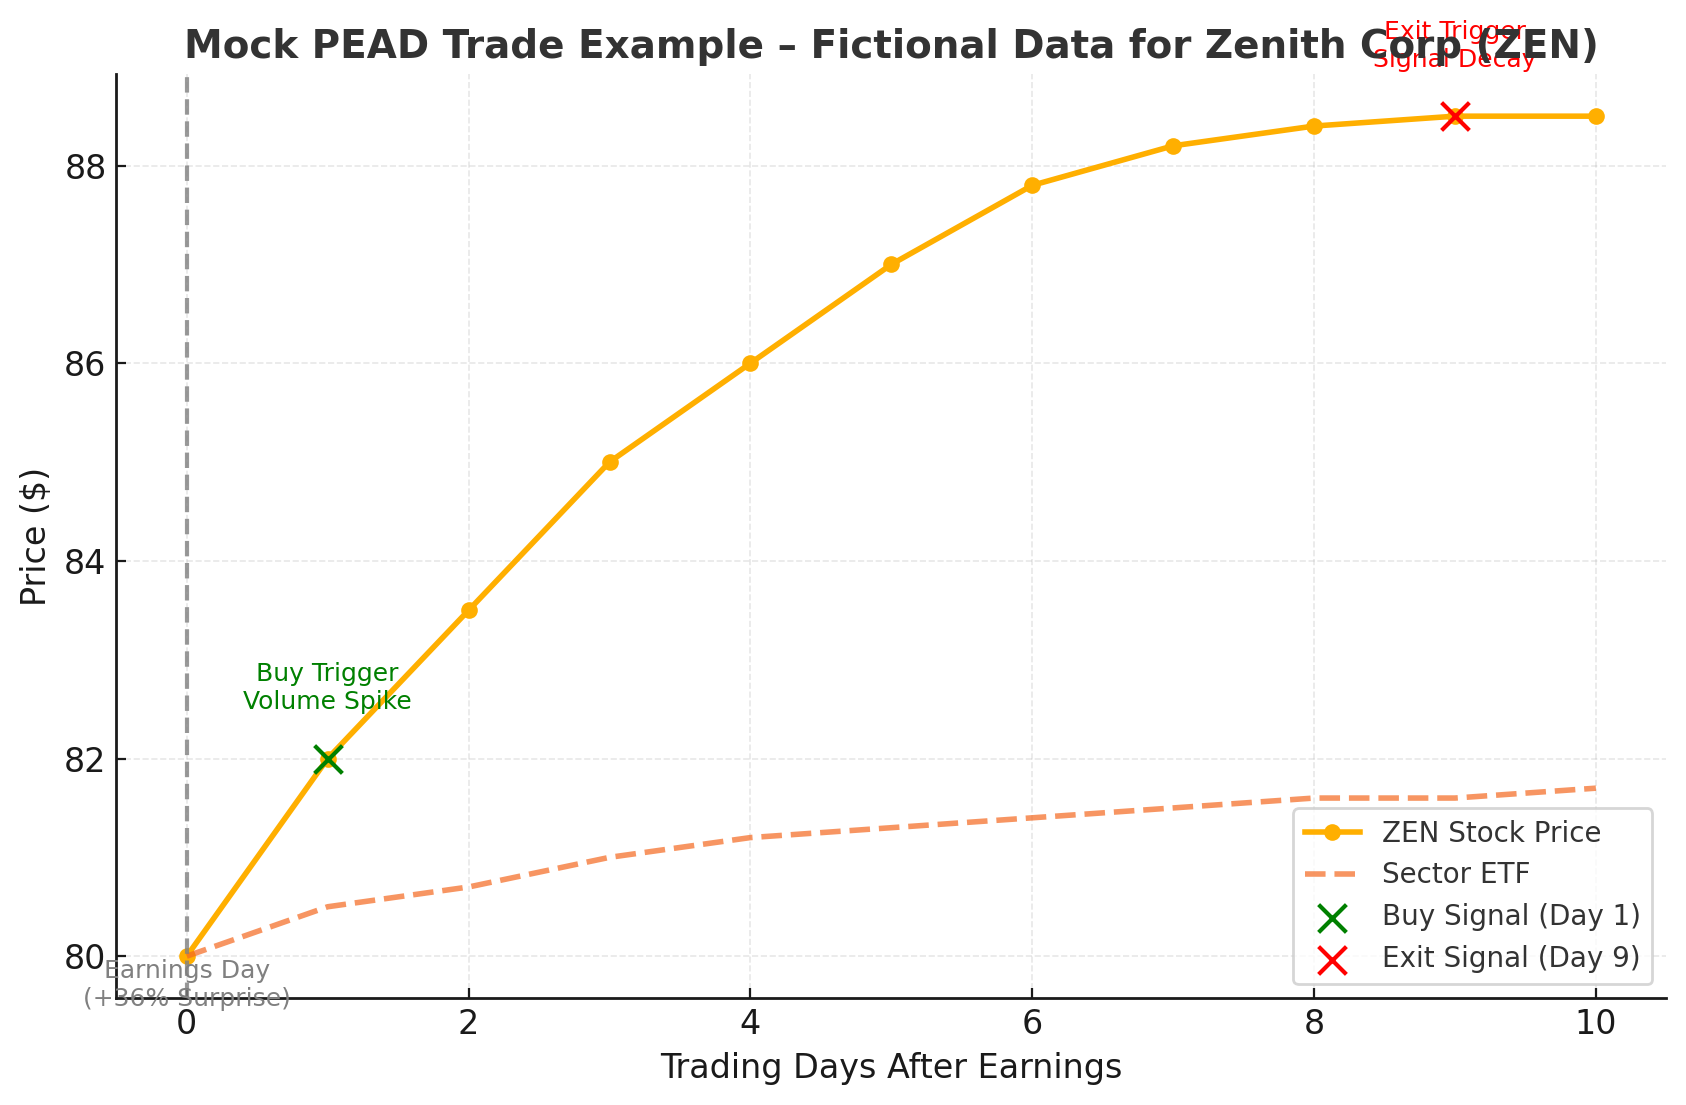
Fictional company, Zenith Corp (ticker: ZEN), reports EPS of $3.00 vs. an analyst estimate of $2.20 on 2025-06-15 — a +36% surprise. - Step 4 - Measure Price & Volume Reactions:
In the mock dataset, ZEN's price rises from $80.00 to $88.50 over 10 days, with announcement-day volume 2.8x the 30-day average. - Step 5 - Calculate Excess Returns:
Compare ZEN's +10.6% return to its sector ETF's +1.5% return, yielding +9.1% excess. - Step 6 - Test Signal Decay:
Drift persists through day 9 before plateauing. - Step 7 - Build Drift Scoring Models:
Assign ZEN a fictional PEAD score of 95/100.
Conversely, the following fictional decay curve illustrates how the strength of a post-earnings announcement drift signal may diminish over time.
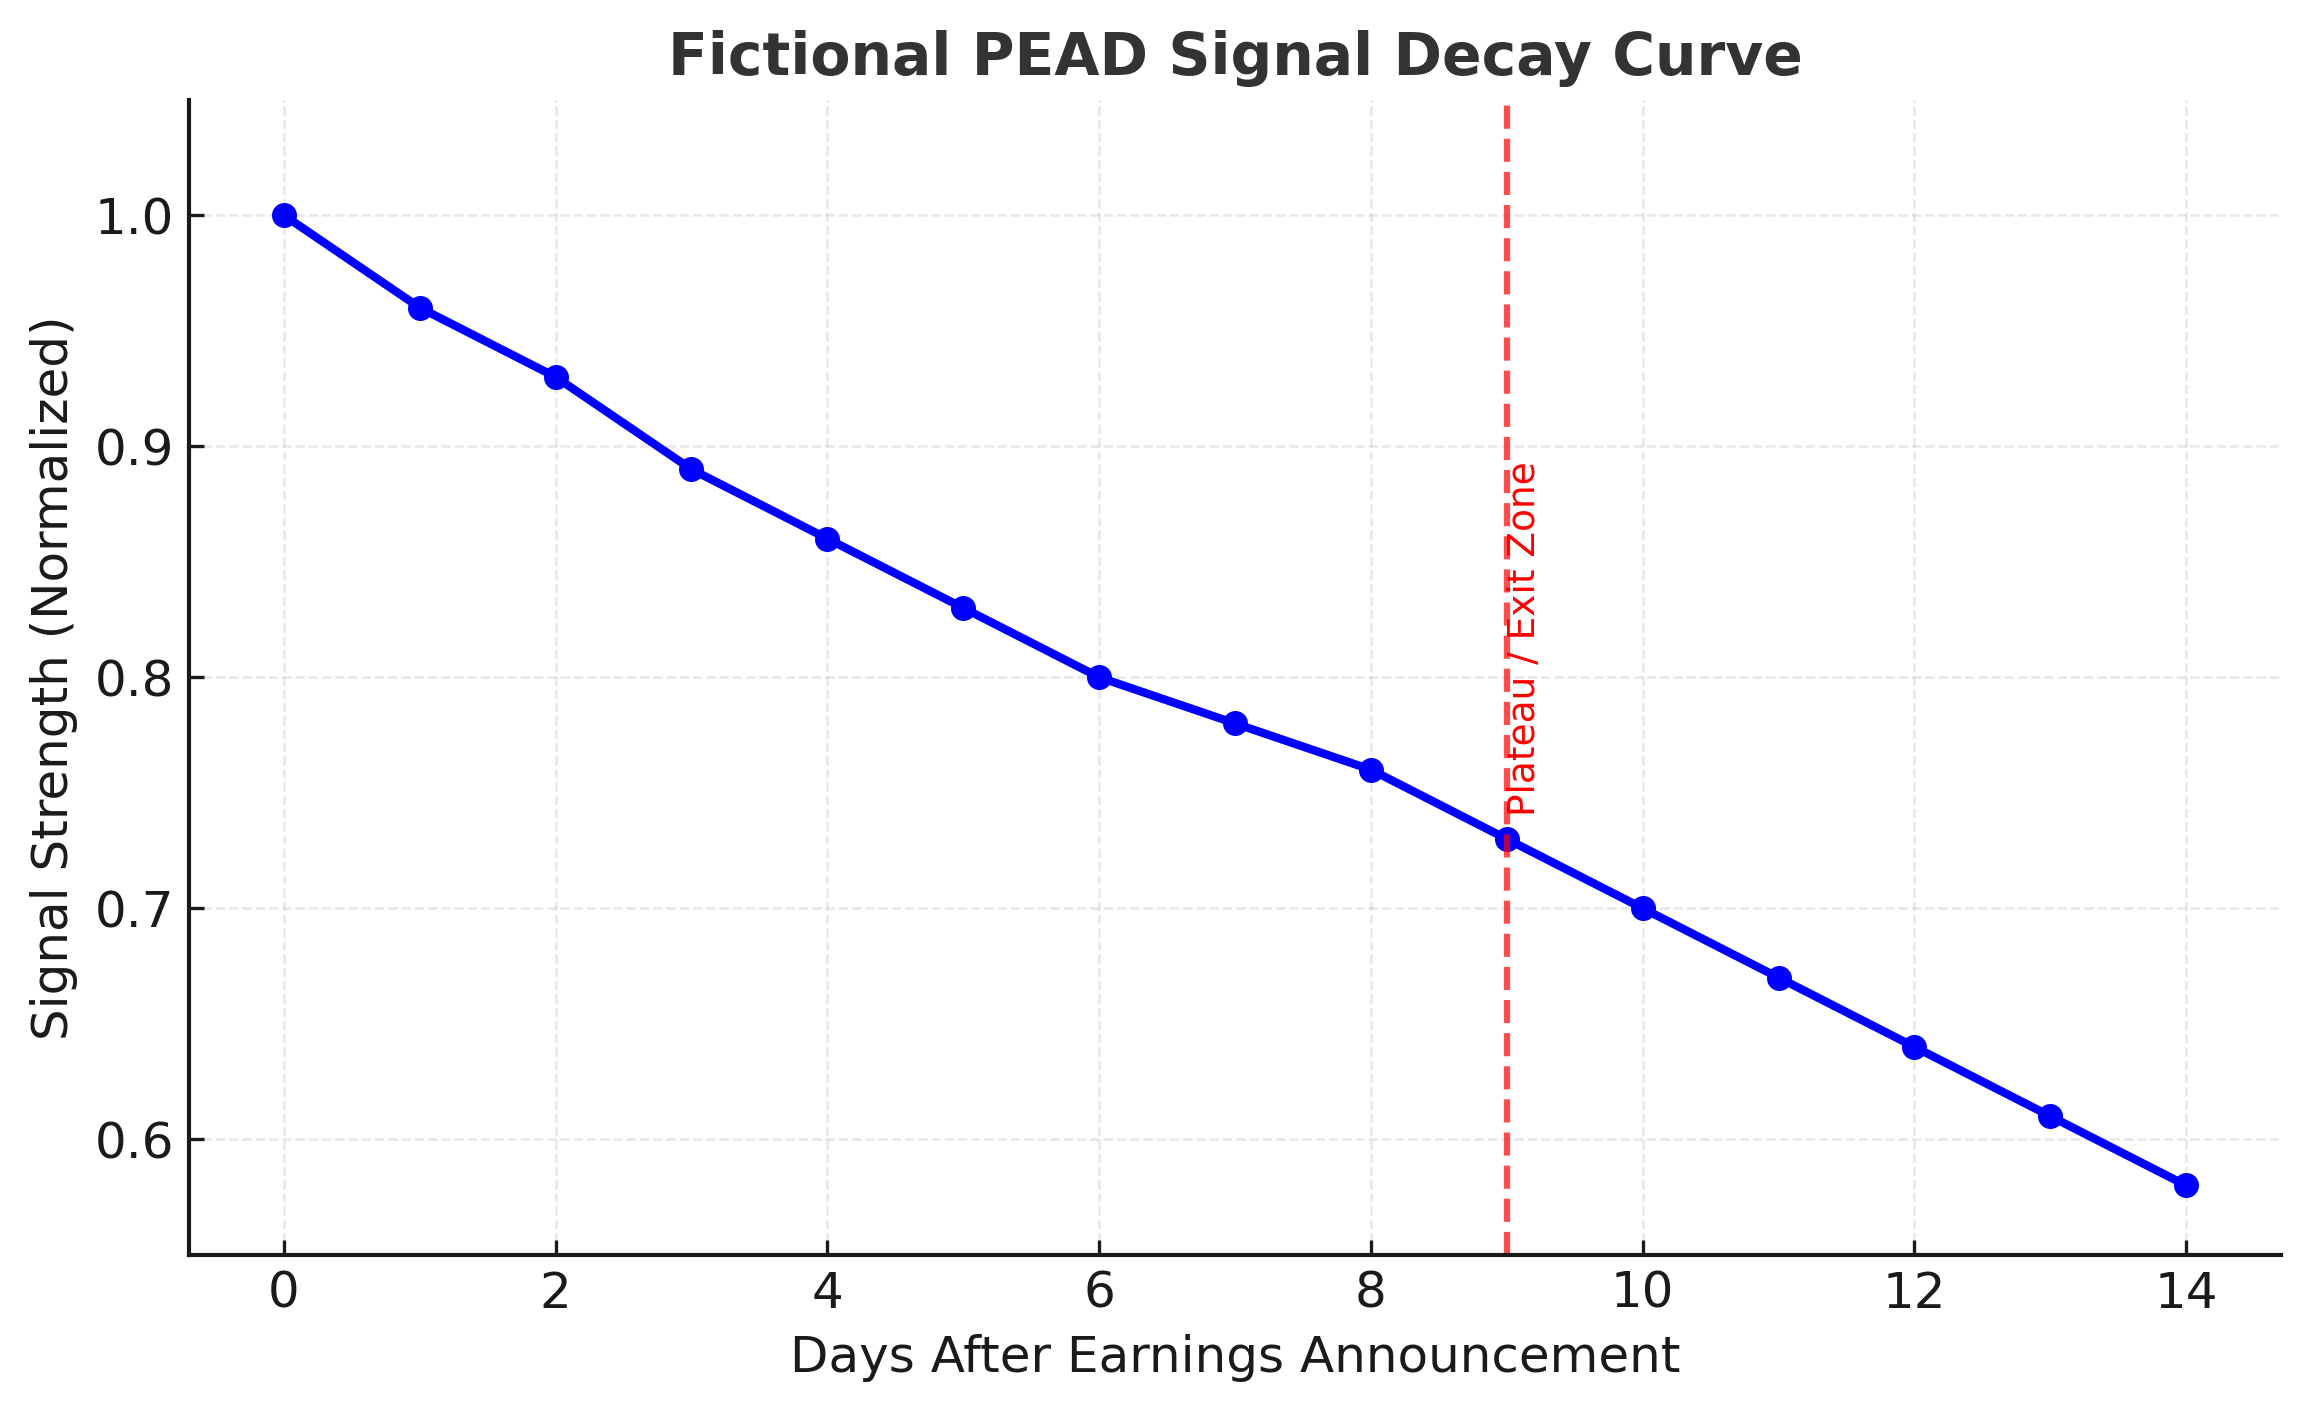
This fictional decay curve shows how the strength of a post-earnings announcement drift signal weakens over time. The signal starts at full strength immediately after the earnings announcement (Day 0) and steadily declines over the following days. Around Day 9, the curve begins to plateau, marking a potential “exit zone” where the drift effect has largely run its course. This visual helps traders identify when the market's reaction to earnings news has been absorbed, reducing the likelihood of further drift.
Turning Drift into Data-Driven Opportunity
PEAD is one of the most durable and studied anomalies in modern finance. While market efficiency and arbitrage activity have reduced its magnitude, systematic tracking and disciplined execution can still extract value. With FMP's data, you can transform post-earnings announcement drift from a theoretical anomaly into a quantifiable, actionable trading strategy.
Frequently Asked Questions
How to trade post-earnings drift?
Trading post-earnings announcement drift typically involves identifying significant positive or negative earnings surprises, entering a trade in the direction of the surprise, and holding for a set period based on backtested drift persistence. This can be applied through long positions for beats and short positions for misses.
Why do stock prices fall after good earnings announcements?
Even with strong earnings, prices can drop if expectations were higher than reported results, forward guidance is weak, or investors take profits after a run-up.
Does PEAD still exist?
Yes, although its magnitude has decreased over time due to faster information dissemination, algorithmic trading, and market efficiency improvements.
Does the phenomenon of post-earnings announcement drift contradict the efficient market hypothesis?
PEAD challenges the semi-strong form of EMH by showing that public information—earnings results—is not always immediately and fully incorporated into prices.
Why has PEAD declined over time and what role does signal informativeness play?
The decline is due to increased competition among traders, improved technology, and better information access. Signal informativeness—how much earnings results predict future performance—affects how long drift persists.
What is post-announcement drift?
Post-announcement drift refers to the continued movement of a stock's price in the same direction as its initial reaction to an earnings announcement.
How does drift trading work?
Drift trading involves systematically buying or shorting stocks after earnings announcements based on the size and direction of the earnings surprise, and exiting after a predetermined holding period.
What is PEAD in the stock market?
In the stock market, post-earnings announcement drift (PEAD) is the tendency for stock prices to continue drifting in the direction of an earnings surprise for days or weeks after the announcement.
Is it better to buy stock before or after earnings?
Buying before earnings can capture the announcement reaction but carries high event risk. Buying after earnings lets you align with the drift once results are known, reducing the risk of being wrong on the surprise.
What causes post-earnings announcement drift?
Post-earnings announcement drift is caused by factors like investor underreaction, delayed information processing, trading frictions, liquidity constraints, and behavioral biases.
Why do stocks fall even after beating earnings?
This can happen when the market expected even stronger results, guidance disappoints, or investors lock in profits after the announcement.

Top 5 Defense Stocks to Watch during a Geopolitical Tension
In times of rising geopolitical tension or outright conflict, defense stocks often outperform the broader market as gove...

Circle-Coinbase Partnership in Focus as USDC Drives Revenue Surge
As Circle Internet (NYSE:CRCL) gains attention following its recent public listing, investors are increasingly scrutiniz...

LVMH Moët Hennessy Louis Vuitton (OTC:LVMUY) Financial Performance Analysis
LVMH Moët Hennessy Louis Vuitton (OTC:LVMUY) is a global leader in luxury goods, offering high-quality products across f...

