FMP
Building an RSI Buy/Sell Signal with FMP Data: A Quant’s Guide
Sep 03, 2025
The challenge for quant leaders isn't a lack of data; it's translating an ocean of information into clear, actionable signals that inform capital allocation and risk management strategies.
The Relative Strength Index (RSI), a momentum oscillator developed by J. Welles Wilder Jr., helps analysts spot overbought and oversold conditions that drive trade timing.
With the FMP Relative Strength Index (RSI) API, you can calculate RSI values instantly across thousands of tickers and build systematic buy/sell signals into your models. This guide shows how to construct and scale an RSI strategy, from calculation basics to integration within screening and backtesting frameworks.
The Relative Strength Index (RSI) as a Strategic Asset
The Relative Strength Index (RSI) is a momentum oscillator developed by J. Welles Wilder Jr. that measures the speed and change of price movements. Its purpose is to indicate overbought or oversold conditions in a market, asset, or security.
Calculated on a scale from 0 to 100, the conventional wisdom holds that an asset is considered overbought and potentially due for a price correction when its RSI rises above 70. Conversely, it's considered oversold and possibly poised for a rally when its RSI falls below 30.
The RSI is typically calculated over a 14-period lookback, though this can be adjusted based on the time horizon of your analysis. The calculation involves computing the average gain and average loss over the specified period, and then using those averages to derive the final RSI value.
The true challenge for an analyst or quant researcher isn't just calculating RSI — that part is straightforward. The real value lies in integrating this signal into a repeatable, automated workflow that can be stress-tested across multiple assets and time horizons. For technical analysts, this means sharpening trade timing and filtering out noise. For quant researchers, it becomes a building block within systematic models, where consistency, scalability, and out-of-sample robustness determine whether RSI is a useful signal or just another charting tool.
The Challenge of Noise: Turning Values into Actionable Signals
A raw RSI value is an academic data point. To transform it into an actionable signal, you need to set clear thresholds and build a rule-based system.
For instance, a simple rule might be: "Generate a 'buy' signal when RSI crosses below 30, and a 'sell' signal when it crosses above 70." However, sophisticated quant researchers know this is a starting point, not a complete strategy.
The most effective signals are confirmed by other indicators or tailored to specific market conditions. For a quant lead, this means looking beyond the basic thresholds to integrate additional data points that validate the signal. Does a low RSI coincide with positive insider trading activity? These are the questions that separate noise from predictive analytics.
The goal is to create a signal that is both timely and reliable, avoiding the false positives that can erode returns and capital. A great signal is one that can be backtested against historical data, demonstrating its efficacy over time.
Building an RSI Signal: A Practical Scenario
Imagine you are a quant researcher tasked with identifying a potential reversal in a fictional tech company, Quantum Dynamics Inc. (ticker: QDI). You decide to build a daily RSI signal to screen for a buying opportunity.
You would use historical data from the FMP Stock Quote API to power your analysis. This provides a wealth of end-of-day information, including open, high, low, and close prices. From this data, you'll calculate the daily returns and then the 14-day average gains and losses.
Here is a simplified step-by-step process for generating your signal using mock data for QDI:
- Retrieve Historical Data & Compute Gains/Losses
To calculate RSI, analysts typically start by pulling the last 14-15 days of price data, then computing daily gains and losses. Instead of coding every calculation from scratch, you can streamline this step by directly querying the FMP Relative Strength Index API.
Here's how an illustrative API call would look:
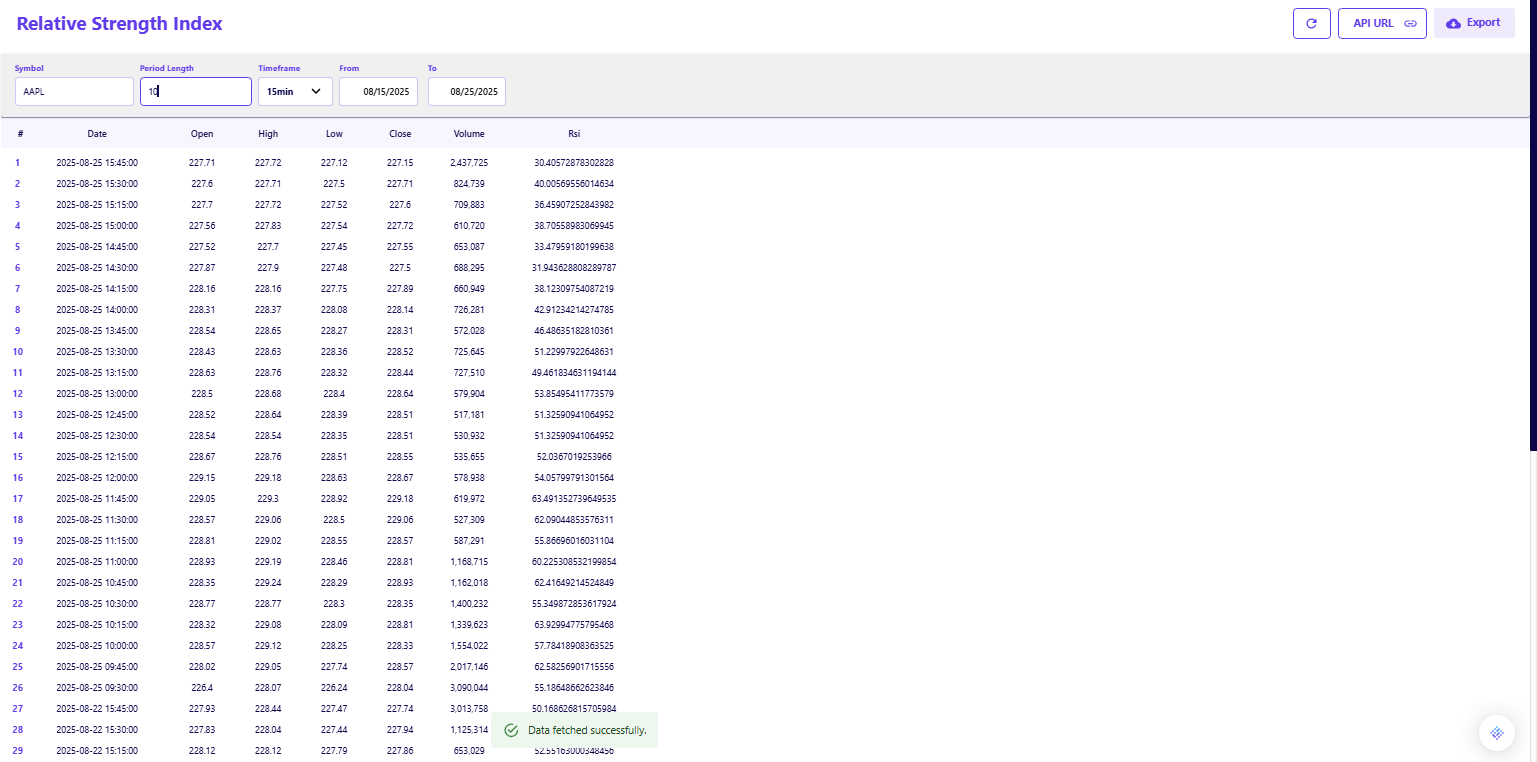
Key Parameters:
- 15min → Timeframe (options: 1min, 30min, 1h, daily, etc.)
- AAPL → Ticker symbol (can be replaced with thousands of other stocks)
- rsi=10 → RSI period length (adjustable to 10, 14, or any custom value depending on your analysis)
- from / to → Date range for historical data
- apikey → Your FMP API key
By adjusting ticker, timeframe, RSI length, and period range, you can easily scale this to thousands of stocks and multiple strategies freeing up your time to test signal robustness, tune thresholds, and integrate RSI into broader trading models.
(Note: mock data is used below just to demonstrate the basics. “Day 1 provides the baseline, leaving 14 usable periods for calculation.):
|
Date |
Close |
Daily Change |
Gain |
Loss |
|
Day 1 |
$95.00 |
- |
- |
- |
|
Day 2 |
$93.50 |
-1.50 |
0.00 |
1.50 |
|
Day 3 |
$92.00 |
-1.50 |
0.00 |
1.50 |
|
Day 4 |
$90.50 |
-1.50 |
0.00 |
1.50 |
|
Day 5 |
$89.50 |
-1.00 |
0.00 |
1.00 |
|
Day 6 |
$88.50 |
-1.00 |
0.00 |
1.00 |
|
Day 7 |
$87.00 |
-1.50 |
0.00 |
1.50 |
|
Day 8 |
$88.00 |
+1.00 |
1.00 |
0.00 |
|
Day 9 |
$87.50 |
-0.50 |
0.00 |
0.50 |
|
Day 10 |
$86.50 |
-1.00 |
0.00 |
1.00 |
|
Day 11 |
$85.50 |
-1.00 |
0.00 |
1.00 |
|
Day 12 |
$84.00 |
-1.50 |
0.00 |
1.50 |
|
Day 13 |
$83.50 |
-0.50 |
0.00 |
0.50 |
|
Day 14 |
$82.50 |
-1.00 |
0.00 |
1.00 |
|
Day 15 |
$81.50 |
-1.00 |
0.00 |
1.00 |
2. Calculate Average Gain and Average Loss
We compute the simple moving average for both gains and losses over the 14-day period.
- Average Gain: The sum of gains is 1.00. The 14-day average gain is 1.00 / 14 ≈ 0.0714.
- Average Loss: The sum of the losses is 1.50 + 1.50 + 1.50 + 1.00 + 1.00 + 1.50 + 0.50 + 1.00 + 1.00 + 1.50 + 0.50 + 1.00 + 1.00 = 15.50. The 14-day average loss is 15.50 / 14 ≈ 1.1071.
Note: Wilder's original RSI calculation uses these simple averages only for the first value. For subsequent periods, the averages are smoothed using an exponential-like formula. The simplified approach shown here demonstrates the initial RSI calculation, but if you're coding this, you'll need to apply Wilder's smoothing for accurate rolling values.
3. Compute Relative Strength (RS)
We divide the average gain by the average loss.
- RS=0.0714/1.1071≈0.0645
4. Compute RSI & Generate Signal
We plug the RS value into the final RSI formula.
- RSI=100−(100/(1+RS))
*
RSI=100−(100/(1+0.0645))
*
RSI=100−(100/1.0645)≈100−93.94≈6.06
In this mock scenario, our final RSI value is approximately 6.06. This is well below the conventional oversold threshold of 30, triggering a definitive buy signal.
⚠️ Note: Such an extremely low RSI reading (near 6) is technically possible but very rare in real-world markets. We use this exaggerated example purely for illustration. In practice, most oversold signals occur in the 20-30 range, but the logic behind the calculation remains exactly the same.
This example demonstrates how a persistent downward trend in price, even with occasional minor gains, directly translates into a low RSI value and a clear signal for a quant researcher.
However, in real-world markets, RSI alone is rarely sufficient to justify an entry. Most analysts validate RSI against other factors such as volume, sector strength, and broader price trends to avoid false positives. This is why RSI is best used as part of a multi-signal framework, which we explore in the next section.
From Signal to Strategy: Integrating RSI into Screening and Backtesting
A single signal is not a portfolio strategy. The true power of this approach comes from integrating the RSI buy/sell signal into a broader framework for screening and backtesting. For a CFO focused on capital allocation, this process provides the quantitative justification for a new position.
Instead of relying on a single indicator, your team can build a systematic screener that combines multiple signals. For example, your screener might look for stocks that meet all of the following criteria:
- RSI drops below 30 (oversold signal).
- The stock's sector is showing strong revenue growth according to the FMP Sector Performance API.
- The company's P/E ratio is below its 5-year average.
This multi-faceted approach reduces the risk of acting on a single, isolated signal. The next logical step is backtesting. By applying this composite strategy to years of historical data, you can measure its performance against market benchmarks.
This provides the empirical evidence needed to prove the strategy's viability and convince a CIO to allocate capital. The insights gained from backtesting such as optimal entry and exit points or the maximum drawdown are invaluable for refining and de-risking the strategy before deployment.
Common RSI Myths Debunked
While the RSI is a powerful tool, its misuse often leads to flawed signals and poor decisions. Here are some of the most common misconceptions about the indicator:
- Myth #1: RSI is a Standalone Indicator. This is the most dangerous myth. The RSI is an oscillator, not a complete strategy. Relying on it alone can lead to acting on false signals and experiencing significant drawdowns.
- Myth #2: Overbought/Oversold Guarantees a Reversal. An RSI above 70 doesn't mean a stock will immediately correct. A stock can remain in an overbought or oversold state for a long time, especially during strong market trends. The RSI simply indicates a condition, not a guaranteed future event.
- Myth #3: The Default 14-Period Setting is Always Optimal. While 14 is the standard, the ideal lookback period is highly dependent on the asset and the trading strategy. A quant might use a 7-day RSI for a high-frequency strategy or a 21-day RSI for a long-term position.
Leveraging FMP for Advanced Signal Generation
The example above uses mock daily data, but the FMP platform provides granularity down to the minute. For quant teams focused on high-frequency trading or intraday strategies, the FMP Charts endpoint offers real-time and historical intraday pricing, enabling the creation of advanced indicators on a much finer scale. You can also leverage the dedicated FMP Relative Strength Index API for streamlined access to pre-calculated RSI values for various tickers, saving valuable computation time for your team.
This level of detailed, accessible data allows for the development of highly nuanced strategies. For example, a quant team could build a signal that only triggers when a stock is oversold on a 5-minute chart, but remains in a strong uptrend on a daily or weekly chart. This multi-timeframe analysis is key to creating robust signals that are less susceptible to short-term market noise. The ability to pull this data in real-time is a competitive advantage, allowing firms to react to market shifts faster than their peers.
Ready to move beyond theory and start building?
Use the FMP Relative Strength Index (RSI) API to generate signals, test thresholds, and scale RSI strategies across thousands of tickers. Pair it with FMP's broader Technical Indicators API to backtest and refine your models — giving your team a repeatable, data-driven edge in any market environment.
Frequently Asked Questions
What is the best way to use RSI in a trading strategy?
The most effective way to use RSI is to combine it with other technical or fundamental indicators. For example, a quant team might generate a buy signal when a stock's RSI is below 30 and its on-balance volume (OBV) is trending up. This helps confirm the signal and reduce the likelihood of false positives. It's a key part of building a robust, multi-factor strategy.
How can I backtest an RSI trading strategy?
Backtesting an RSI strategy involves applying your rules (e.g., buy when RSI crosses 30) to historical FMP data to see how the strategy would have performed over a specific time period. This process allows you to evaluate the strategy's performance against market benchmarks, and the insights gained from this analysis, such as optimal entry and exit points, can be invaluable for refining your approach.
What is a good RSI value to buy or sell?
Conventionally, an RSI above 70 suggests a stock is overbought (a potential sell signal), while an RSI below 30 suggests it is oversold (a potential buy signal). However, these thresholds are a starting point. They can be adjusted based on your strategy and the asset's volatility. For example, a highly volatile stock may require a lower overbought threshold to avoid false signals.
How does RSI relate to momentum and how can I create other momentum signals?
RSI is a momentum oscillator, which means it measures the speed and change of price movements to identify overbought or oversold conditions. It's one of many tools used to understand momentum. For a deeper look at creating other momentum signals, you can review this article on three ways to build momentum signals using FMP's forecast APIs.
Is RSI a good standalone indicator for trading?
RSI is generally not recommended as a standalone indicator. While it can be a powerful signal, it's most effective when used in a broader, multi-factor strategy to reduce false signals and improve overall accuracy. Relying on a single data point can lead to significant risk, as any single data point can be influenced by market noise.
What other indicators can I combine with RSI?
You can combine RSI with a variety of indicators to create a more robust strategy. Other common choices include moving averages (e.g., the 200-day SMA), volume indicators (e.g., On-Balance Volume), or fundamental data from the FMP API, such as P/E ratios and revenue growth.
Where can I find historical data for free to calculate RSI?
The FMP API offers extensive free and paid historical data endpoints, including daily and intraday prices, which are essential for accurately calculating RSI and other technical indicators. You can get started with a free tier to build and test your initial strategies.

WACC vs ROIC: Evaluating Capital Efficiency and Value Creation
Introduction In corporate finance, assessing how effectively a company utilizes its capital is crucial. Two key metri...

BofA Sees AI Capex Boom in 2025, Backs Nvidia and Broadcom
Bank of America analysts reiterated a bullish outlook on data center and artificial intelligence capital expenditures fo...

Pinduoduo Inc. (PDD) Q1 2025 Earnings Report Analysis
Pinduoduo Inc., listed on the NASDAQ as PDD, is a prominent e-commerce platform in China, also operating internationally...

