FMP
How to set Stop-Loss and Take-Profit for your selected stock.
Jun 14, 2024(Last modified: Nov 18, 2025)
In this article, I will teach you how to set your stop-loss and take-profit levels. But before we dive into the process, let me explain what a stop-loss and take-profit are.
In stock trading, stop-loss and take-profit are crucial tools used to manage risk and optimize profits.
Stop-loss is a predefined price level set by a trader to limit potential losses on a trade. When the stock price reaches this level, the stop-loss order automatically triggers, selling the stock to prevent further loss. In simple terms, this is the price at which the trader is willing to sell the stock to minimize losses.
Take-profit is a predetermined price level at which a trader decides to sell a stock to lock in profits. Once the stock price reaches this level, the take-profit order executes, securing the gains made on the trade. In simple terms, this is the price at which a trader will close their position with profits.
Both stop-loss and take-profit orders are essential for disciplined trading, helping traders protect their capital and maximize returns by automatically executing trades based on predetermined criteria.
Understanding and effectively using these tools can significantly improve trading outcomes and reduce emotional decision-making in volatile markets.
Now that you've learned what SL (Stop-Loss) and TP (Take-Profit) are, let's dive into the calculation process and I will teach you how to set those levels correctly. Of course, a lot depends on your risk appetite. The riskier you are, the higher losses you may be willing to take, in anticipation of higher returns without closing positions prematurely. Conversely, risk-averse traders prefer to minimize risk and close positions earlier.
To calculate these levels, you first need to determine your stock's standard deviation, which is calculated using the formula:
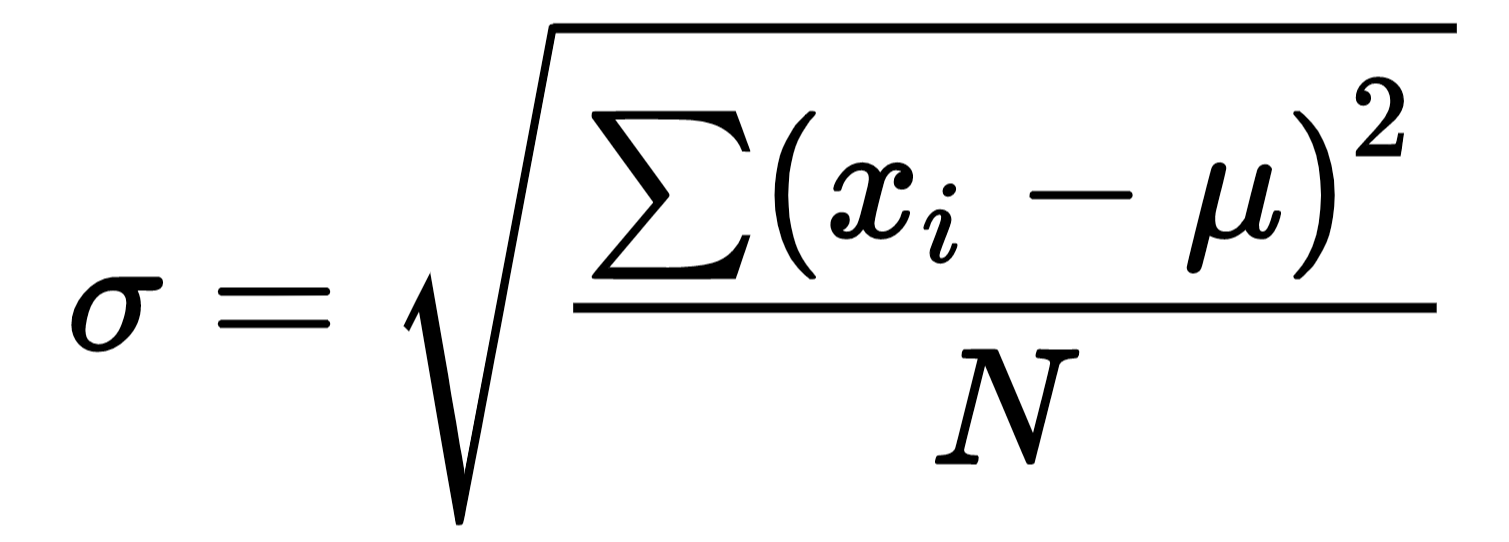
where x are individual data points mu is the mean of the data points and N is the number of data points.
Let's consider an example. Suppose we have the following daily closing prices of a stock over a period of 5 days: 25.50, 25.75, 26.00, 25.90, 26.10. To calculate the standard deviation of these stock prices, we first need to find the mean. Sum all the prices and divide by 5, since there are five days. It will equal 25.85.
Then calculate squared differences from the mean:
(25.50 - 25.85)^2 = (-0.35)^2 = 0.1225
(25.75 - 25.85)^2 = (-0.10)^2 = 0.0100
(26.00 - 25.85)^2 = (0.15)^2 = 0.0225
(25.90 - 25.85)^2 = (0.05)^2 = 0.0025
(26.10 - 25.85)^2 = (0.25)^2 = 0.0625
Then sum all squared differences:
0.1225+ 0.0100 + 0.0225 + 0.0025 + 0.0625 = 0.22.
The last step is to take the square root of 0.22/5 or the square root of 0.044, which equals approximately 0.21. Now we have the stock's standard deviation or some traders call it volatility, indicating that the stock typically deviates from its average by 0.21 units. Ideally, larger datasets, such as 360 days or more, provide a more accurate standard deviation.
Now that you know how much the stock can deviate from its average, you can set your stop-loss and take-profit prices.
To aim for higher earnings on the stock, set a higher take-profit level. Multiply the standard deviation by 3. In our example, multiply 0.21 by 3 to get 0.63. Then, add 0.63 to the stock's market price, which is 26.10 in our case, resulting in a take-profit level of 26.73.
For the stock's stop-loss, use a smaller standard deviation. Multiply the standard deviation by 2 and subtract from the market price. In our case, the calculation would be: 26.10 - (0.21 * 2) = 25.68, which is the stop-loss price.
The rule of thumb is that the more risk you're willing to take, the higher the multiplier you should use. If you increase the stop-loss multiplier, don't forget to adjust the take-profit accordingly. For instance, if you're comfortable with more risk, you could use 4 standard deviations for the stop-loss and 5 standard deviations for the take-profit.

WACC vs ROIC: Evaluating Capital Efficiency and Value Creation
Introduction In corporate finance, assessing how effectively a company utilizes its capital is crucial. Two key metri...

BofA Sees AI Capex Boom in 2025, Backs Nvidia and Broadcom
Bank of America analysts reiterated a bullish outlook on data center and artificial intelligence capital expenditures fo...

Pinduoduo Inc. (PDD) Q1 2025 Earnings Report Analysis
Pinduoduo Inc., listed on the NASDAQ as PDD, is a prominent e-commerce platform in China, also operating internationally...

