FMP
Forecasting Stock-Market Trends with the Yield Curve
Oct 03, 2025
Every U.S. recession in recent history has been preceded by an inverted yield curve. In other words, when short-term Treasury rates climb above longer-term yields, markets often stall or slide. For equity analysts and portfolio managers, tracking the yield curve's slope is a vital early-warning signal.
Using FMP's data infrastructure, you can fetch historical Treasury rates alongside stock index prices via API. This enables automated monitoring of yield-curve inversions and their correlation with S&P 500 drawdowns over time.
Yield Curve Inversion: A Time-Tested Warning Sign
A yield curve inversion occurs when short-term rates (e.g. 2-year Treasury) exceed long-term rates (e.g. 10-year). Economists regard this as a strong recession predictor: in fact, “every U.S. recession in the past 60 years was preceded by a negative term spread,” i.e. an inverted curve.
Historically, inverted curves (10Y-2Y or 10Y-3M spreads falling below zero) have aligned with major downturns. For example, in the months before the 2001 dot-com bust or the 2008 financial crisis, the 10Y-2Y Treasury spread plunged into negative territory, and the S&P 500 soon entered a steep drawdown. (Not all inversions lead to immediate crashes, but almost every U.S. recession since the 1950s was foreshadowed by one.) Thus, keeping an eye on the curve's shape helps analysts anticipate stress.
Investors can monitor curve steepness and inversions continuously with FMP's APIs. FMP provides up-to-date yield data and index prices to model this relationship. Built on FMP's platform, one can easily pull the Treasury yield curve and S&P index history, compute spreads, and compare them to stock returns. Below, we outline how to use FMP's Treasury Rates API and Historical Index Light Chart API to do this.
Using FMP's Treasury Rates and Index APIs
FMP's Treasury Rates API delivers real-time and historical yields for all maturities
The endpoint
|
https://financialmodelingprep.com/stable/treasury-rates?apikey=YOUR_KEY |
returns JSON like:
|
[ {"date":"2025-09-29","year2":3.63,"year10":4.15, …}, {"date":"2025-09-26","year2":3.63,"year10":4.20, …}, … ] |
Each entry gives daily yields from 1-month up to 30-year. To build the yield curve, fetch these data via FMP's API and plot rates across maturities. In particular, compute the 10Y-2Y spread (subtract the 2-year rate from the 10-year rate) for each date. A negative value signals an inverted curve. For example:
Fetch yield curve and compute 10Y-2Y spread
|
import requests api_key = "YOUR_KEY" treasury_url = "https://financialmodelingprep.com/stable/treasury-rates?apikey={api_key}" treasury_data = requests.get(treasury_url).json() spreads = [d['year10'] - d['year2'] for d in treasury_data] |
Next, use FMP's Historical Index Light Chart API for S&P 500 prices. This endpoint (e.g. symbol=^GSPC) returns daily index values:
|
[ {"symbol":"^GSPC","date":"2025-09-30","price":6658.66,…}, {"symbol":"^GSPC","date":"2025-09-29","price":6661.20,…}, … ] |
By downloading these prices via API, you can calculate stock drawdowns (percentage drops from previous peaks) and overlay them with yield spreads. A simple code example:
|
sp500_url = "https://financialmodelingprep.com/stable/historical-price-eod/light?symbol=^GSPC&apikey={api_key}" sp500_data = requests.get(sp500_url).json() dates = [d['date'] for d in sp500_data] prices = [d['price'] for d in sp500_data] # Compute drawdowns peak = max(prices) drawdowns = [(price-peak)/peak*100 for price in prices] |
Using these APIs, you can automate tracking of yield spreads vs. equity performance. For instance, pull the last two years of data and build charts showing how the 10Y-2Y spread compares to S&P 500 movements. The APIs can be integrated in scripts, dashboards, or even a spreadsheet add-on.
If used through Google Sheets add-on:
- Install Google Sheets Add-on.
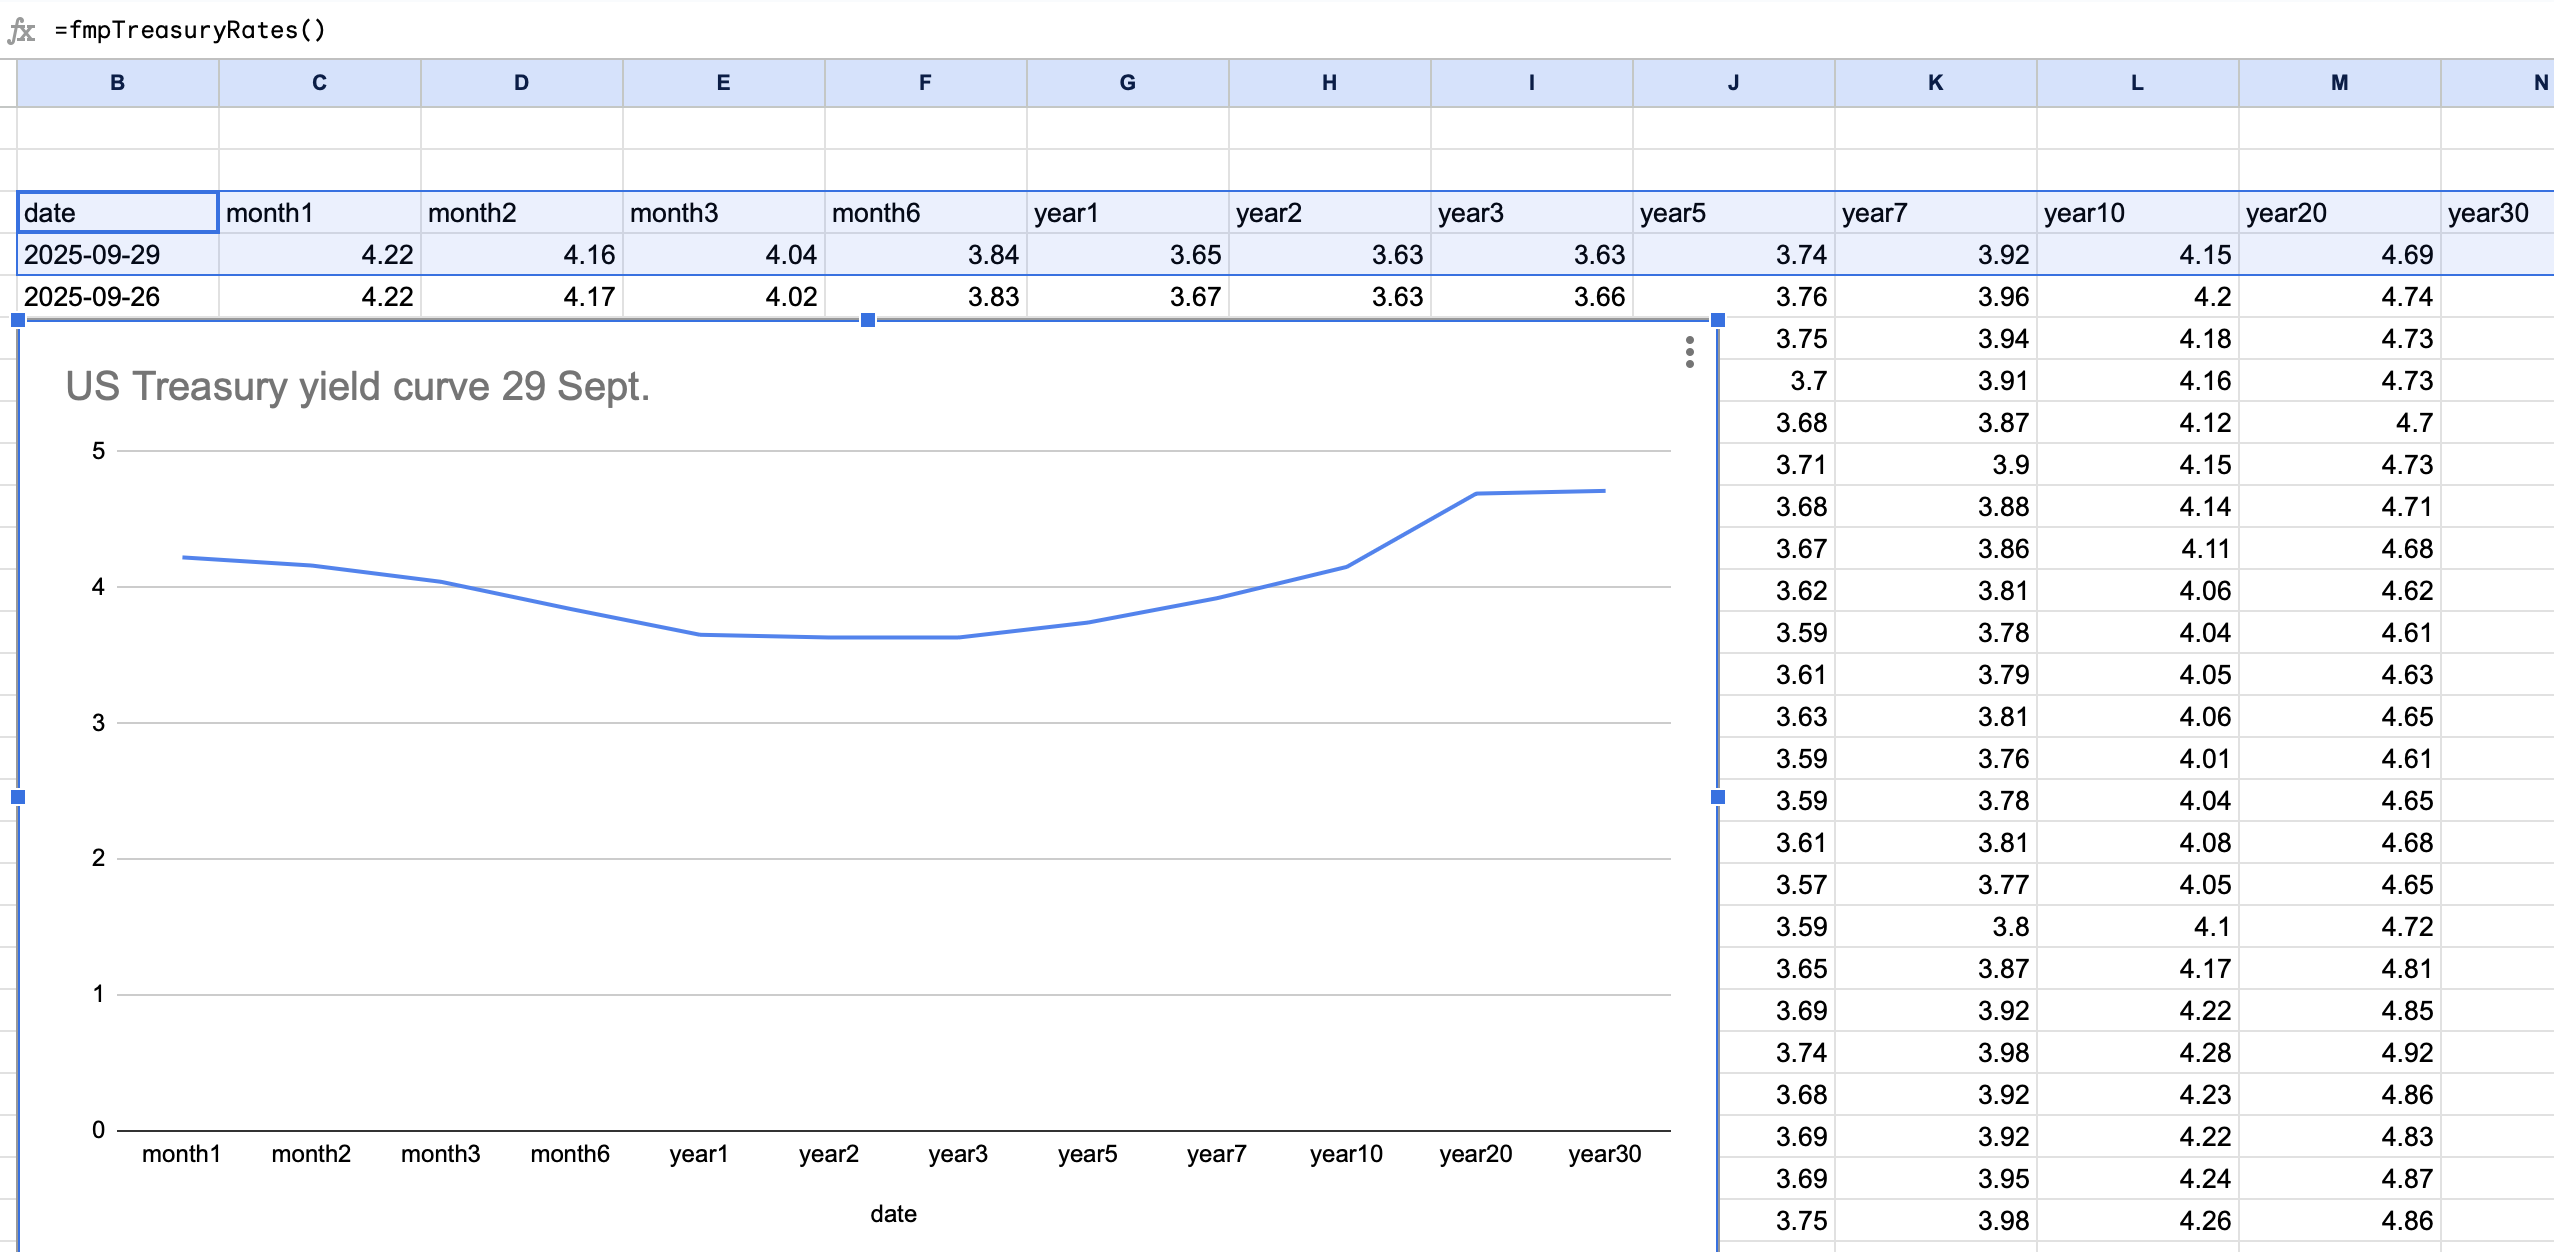
- In an empty cell, input the “=fmpTreasuryRates()” formula and press the Enter key.
You will get US treasury rates extracted to your Google Sheets.
- Then plot the graph, capturing US treasury yields for different maturities, as shown in the image below.
You will get a U.S. treasury yield curve, enabling you to analyze its slope and determine whether it is inverted.
US Treasury Yield curve, plotted in Google Sheets.
Alternatively, subtract the 2-year rate from the 10-year rate to check if the curve is inverted. A negative value signals an inverted curve.
Also, FMP's API viewer makes it easy to query these endpoints and preview JSON results.
Historical Examples: Inversions Before Crises
The predictive power of inversions is clear in past episodes. Consider a few examples:
Dot-Com Bust (2000-2002).
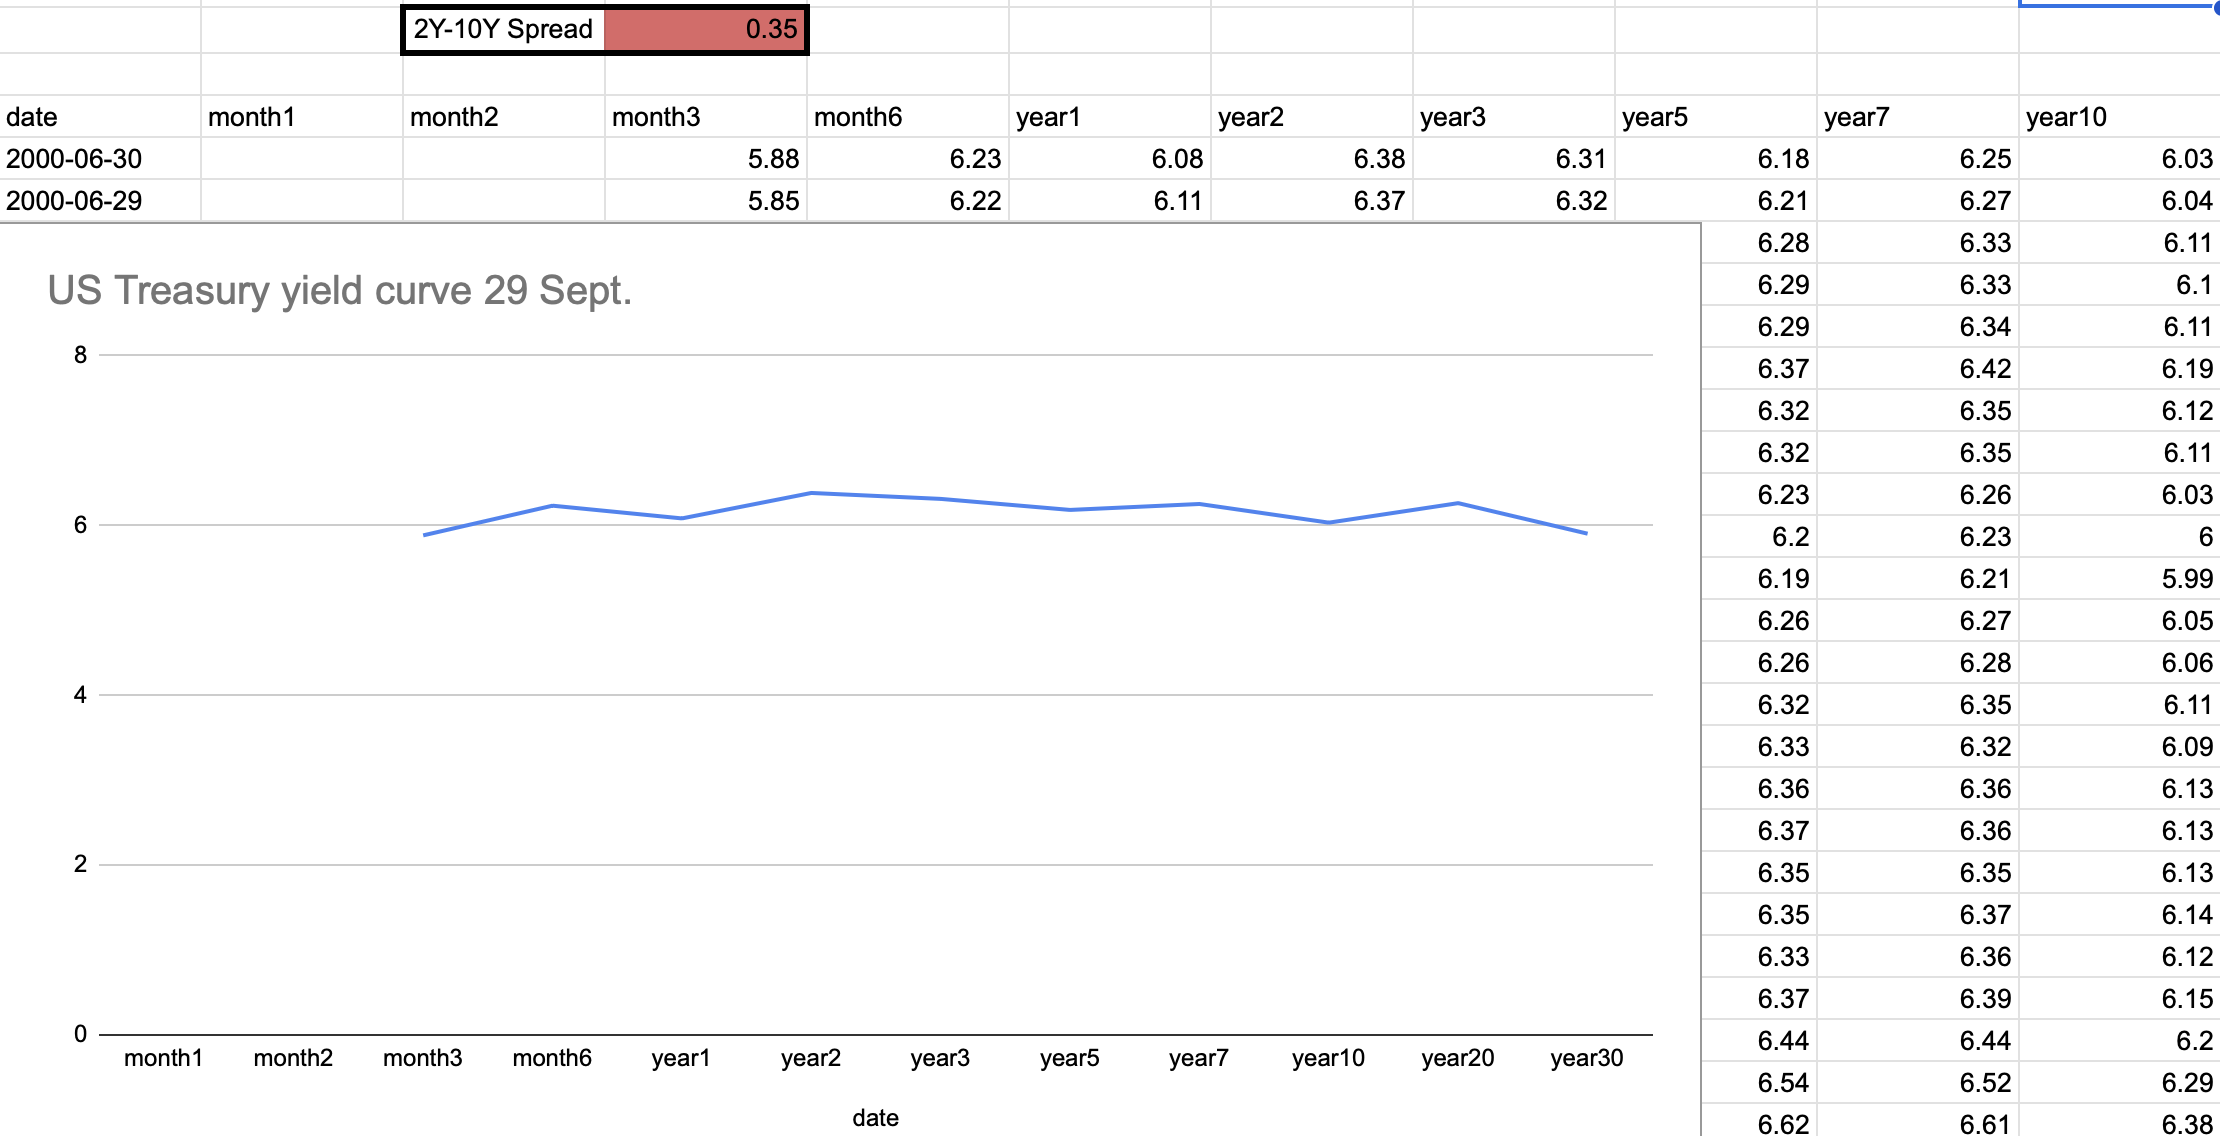
In mid-2000, the 10Y-2Y spread fell below zero. This inversion preceded the S&P's peak and ~50% plunge into 2002. In hindsight, the inverted curve was a clear warning signal.
US Treasury Yield curve, mid 2000.

Global Financial Crisis (2007-2009).
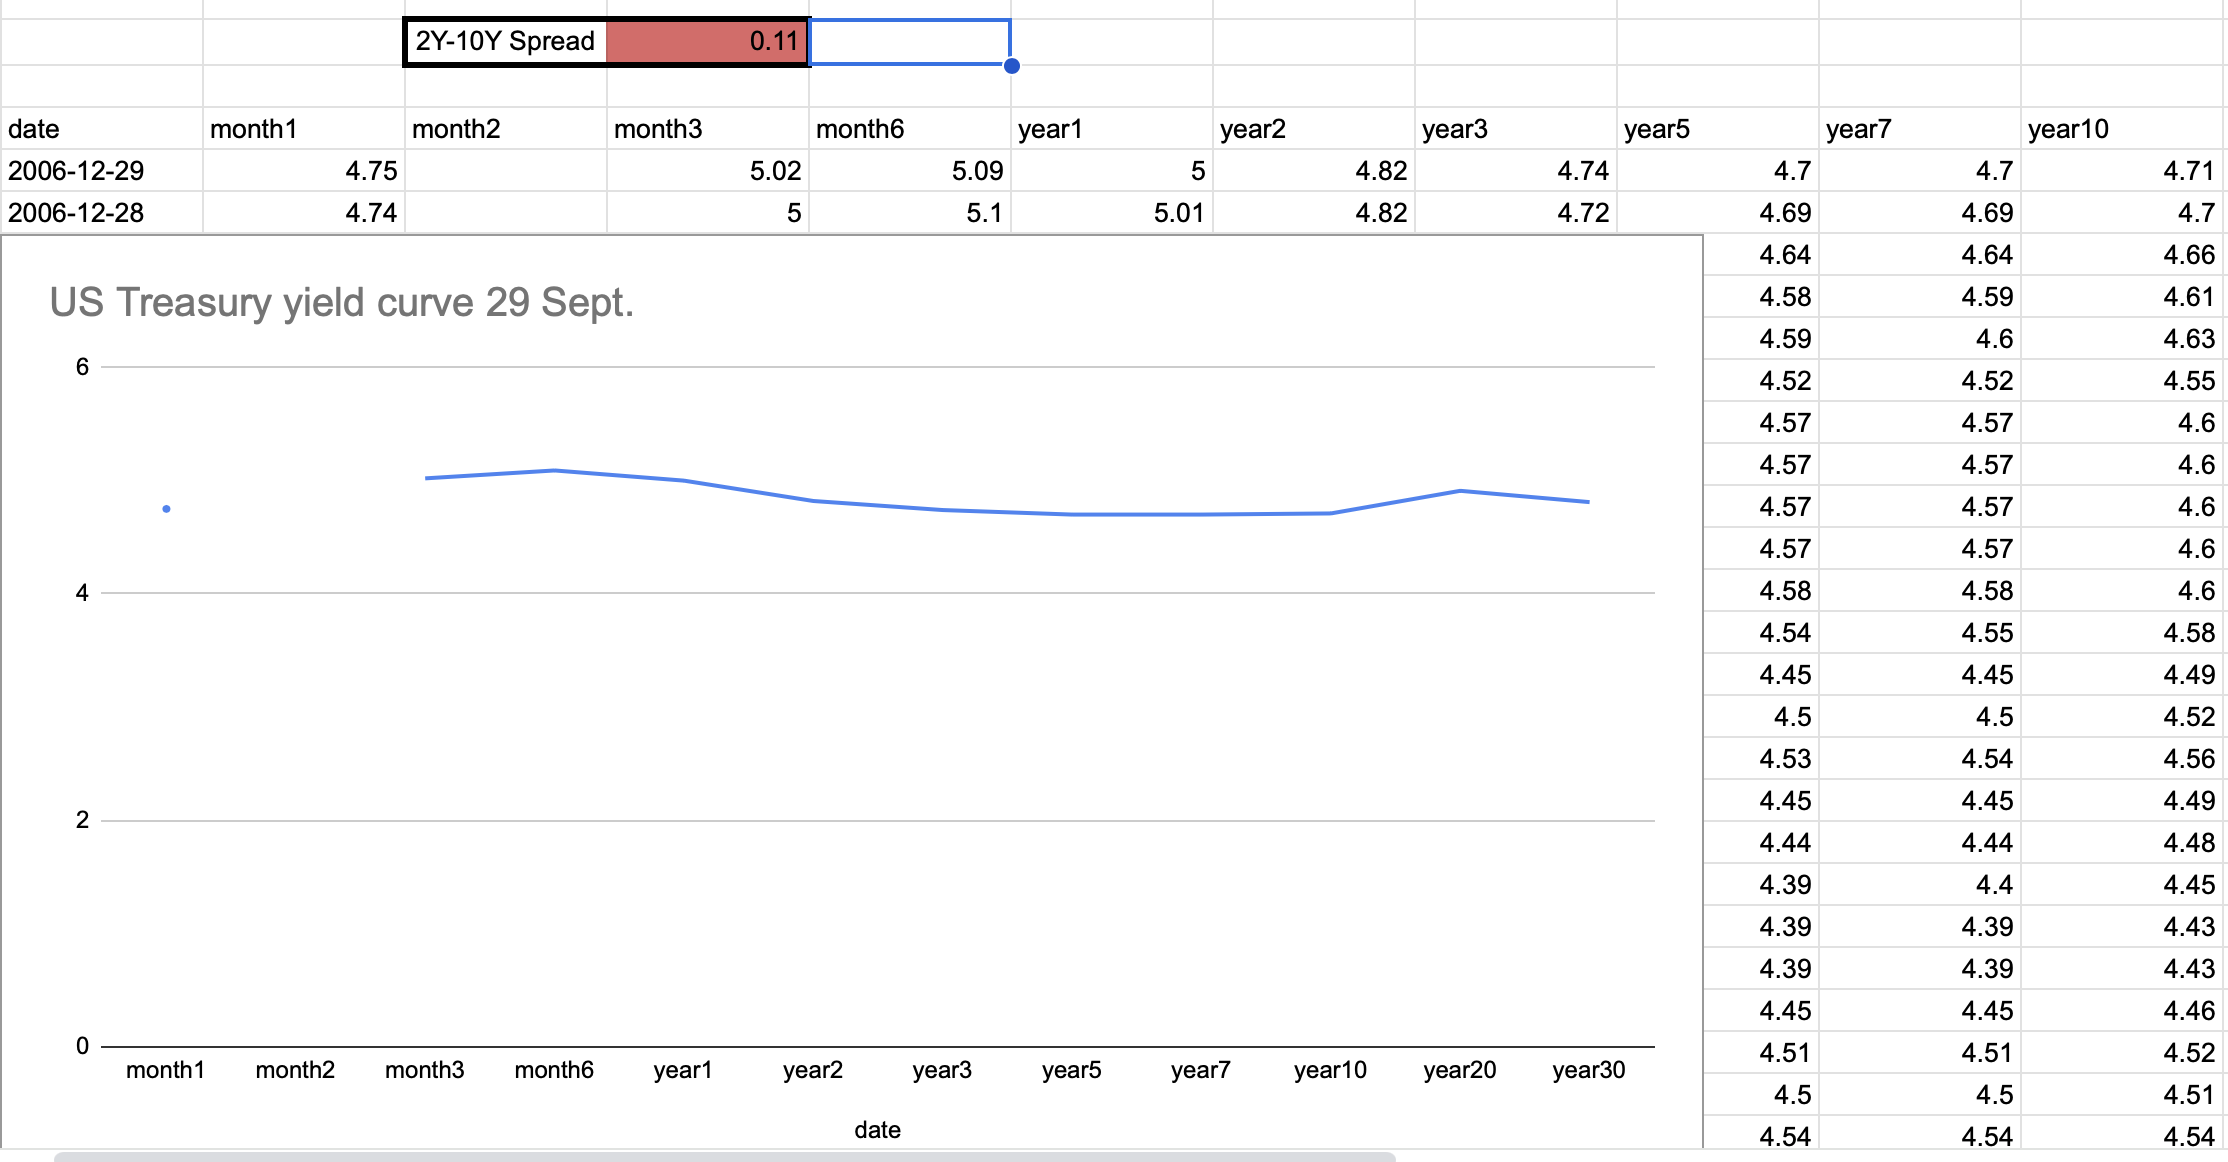
The curve inverted in late 2006 (as Fed tightened) and inverted again in 2007. The S&P 500 then collapsed ~57% over the next two years. Here again, the inversion matched the downturn.
US Treasury Yield curve, late 2006.
Recent Cycles (2019-2020).
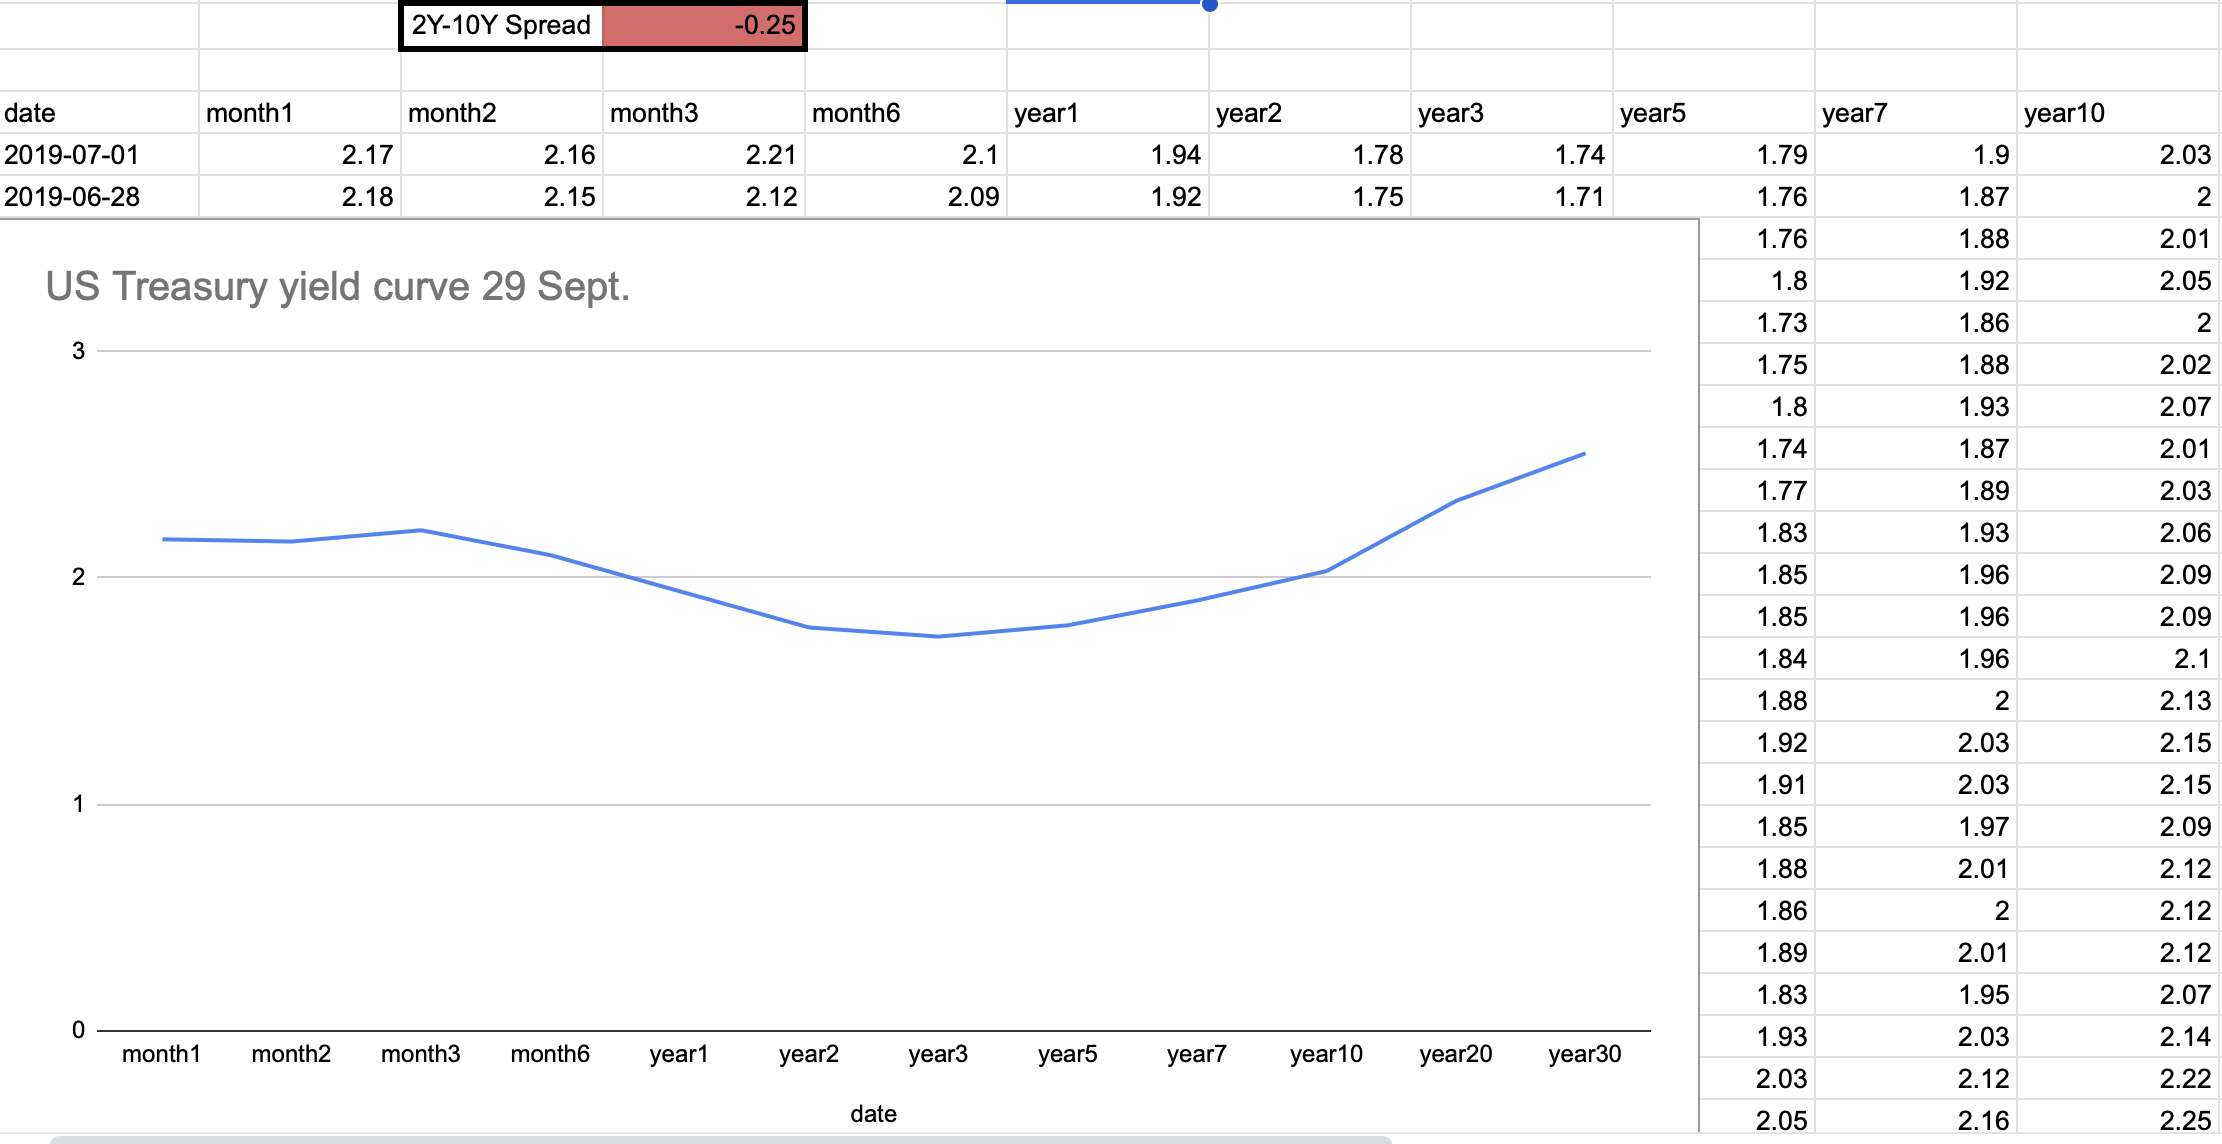
The yield curve briefly inverted in 2019. The U.S. then entered a sharp recession in 2020 (amid the pandemic), with an S&P drawdown of ~34%. While Covid was a unique shock, the inversion still coincided with stress.
US Treasury Yield curve, mid 2019.
Real-Time Monitoring: Early Warnings via APIs
Because yield inversions are such reliable signals, real-time monitoring is essential. FMP's APIs enable constant tracking of the yield curve and market indices so you can “spot the signs” as they develop. For example:
- Automated Alerts: Write a simple script to fetch the latest Treasury rates daily and flag whenever the 10Y-2Y spread flips negative.
- Dashboard Updates: Use FMP's API in a BI tool or spreadsheet to display current yield curve charts and plot the term spread over time.
- Correlation Analysis: Pull index prices and compare current S&P performance against past inversion points to assess vulnerability.
Because these endpoints are built on FMP's data infrastructure, they deliver low-latency, accurate data that you can trust. This means quantitative teams and traders can embed FMP calls into their models for immediate insight. For example, a Python/R script could auto-fetch yields and S&P data each morning, compute the spread, and warn if a negative turn is imminent.
Expert tip: FMP provides a “Stock Chart Light API” API for individual equities and an “Index Light Chart” API for indices. You can test these yourself: query the Treasury Rates endpoint and the S&P Historical Index endpoint using FMP's online API viewer. This hands-on approach shows how easy it is to integrate FMP data.
In sum, by automating yield-curve checks via FMP, traders gain precious lead-time. Instead of reacting to a market selloff, you can see stress building in the curve days or months in advance. This aligns with expert advice to “monitor yield-curve inversions carefully as a recession warning”. In today's fast markets, having the curve in your toolkit — updated through FMP's APIs — is a prudent way to stay ahead of potential downturns.
Open-Source U.S. Treasury Yield Curve Tracker App
To illustrate these concepts in a live tool, an open-source iOS app called USTYieldCurveTracker has been built on FMP's data. The app fetches historical Treasury rates from FMP's API and plots the full yield curve for any selected date. Traders can slide through calendar dates to watch how the curve steepness and inversions evolve over time. This utility (available on GitHub) is a practical demonstration of “built on FMP's data infrastructure” - you can download the code and see how easy it is to call FMP's Treasury Rates endpoint and render the curve. The tracker highlights how FMP data can power custom dashboards and tools for market research.
Wrapping Up: Institutional Strategies for Yield Curve Monitoring
Yield-curve inversion has proven to be a reliable lead indicator of market stress. By leveraging FMP's Treasury Rates API and Historical Index API, analysts can quantify and visualize this signal against S&P 500 performance. We've seen that nearly every post‑war U.S. recession was foreshadowed by an inverted Treasury curve, and FMP's real-time data feeds make it easy to watch for the next inversion as soon as it happens.
Inverting curves aren't just a recession signal — they're a workflow trigger for institutions. With FMP's APIs, you can scale from individual analysis to firm-wide monitoring, giving your team an edge in spotting stress before it hits portfolios. In practice, this means setting up automated queries or dashboards using FMP endpoints so you can spot stress early, not after the market has already turned.
FAQs
What is a yield curve and why does its inversion matter?
The yield curve plots Treasury yields by maturity. An inverted curve (short-term rates > long-term rates) is unusual and historically signals that investors expect an economic slowdown. Monitoring this inversion helps forecast downturns.
Why focus on the 10-year vs. 2-year spread?
The 10Y-2Y spread is a common proxy for the curve's slope. It has a strong track record: a negative 10Y-2Y spread has preceded all U.S. recessions since the 1950s. It tends to offer a clear, timely signal of tightening monetary policy ahead of downturns.
Is an inverted yield curve a sure sign of recession?
It's a very strong indicator but not a guarantee. The data show nearly every inversion was followed by a recession. However, timing can vary (often 6-18 months later). It's wise to use inversions along with other signals (like economic indicators) when making decisions.
Can I use FMP APIs for real-time monitoring?
Yes. FMP's endpoints update daily (and some endpoints update intraday under premium plans). You can automate queries to check the latest yield curve or index price. FMP's infrastructure is designed for integration, so you could set up alerts or dashboards that refresh with each new data release.
Where can I find more resources?
In addition to FMP's API documentation, FMP's blog offers insights. For instance, a recent post highlights yield curve inversion as a key recession signal. You can also examine FMP's Google Sheet Add-on for extracting valuable financial data into your Google Sheets.
WACC vs ROIC: Evaluating Capital Efficiency and Value Creation
Introduction In corporate finance, assessing how effectively a company utilizes its capital is crucial. Two key metri...
BofA Sees AI Capex Boom in 2025, Backs Nvidia and Broadcom
Bank of America analysts reiterated a bullish outlook on data center and artificial intelligence capital expenditures fo...
Pinduoduo Inc. (PDD) Q1 2025 Earnings Report Analysis
Pinduoduo Inc., listed on the NASDAQ as PDD, is a prominent e-commerce platform in China, also operating internationally...

