Insider Trading Tracker: Spotting Market Signals Before They Break
Oct 13, 2025(Last modified: Nov 18, 2025)
What if you knew - in near real time - that a CEO just poured $20 million into his own company's stock? In one instance, Netflix Co-CEO Reed Hastings quietly bought 51,440 Netflix shares (about $20M worth) on the open market. Days later, the stock rebounded.
Insider trading activity often telegraphs insiders' confidence or caution before news hits the wire. By tracking these moves before the market reacts, analysts and portfolio managers can get an early read on a company's trajectory. This article shows how to monitor insider buying and selling as a predictive signal, using Financial Modeling Prep's Insider Trade Statistics API as a powerful insider trading tracker.
Why Insider Trades Are Early Stock Signals
Company insiders - executives, directors, key stakeholders - know their business intimately. When they buy shares, it's often because they believe the stock is undervalued or good news is ahead. When they sell shares, especially in unusual volumes, it can signal internal concern or a stock that's overvalued.
Academic research backs this up: insider transactions have significant predictive power for future stock returns. In fact, studies find net insider buying correlates with better subsequent performance, while heavy insider selling can foreshadow weaker returns.
Insiders are required to disclose their trades (via SEC Form 4 filings, typically within two business days), but these disclosures often go under the radar. Rarely will CNBC or Bloomberg broadcast a mid-level executive's stock purchase. Yet patterns like multiple insiders all buying at once - known as cluster buys - are potent bullish signals.
A cluster of executives snapping up shares in tandem shows collective confidence that the stock will rise. Conversely, if you see a wave of insider selling, it might be time to dig deeper into why. By monitoring insider trades continuously, you can align your strategy with those who might have early insight into the company's prospects.
Tracking Insider Activity with FMP's Insider Trade Statistics API
How do we systematically track insider trading signals? This is where the Insider Trade Statistics API from Financial Modeling Prep comes in.
The API provides a convenient quarterly breakdown of insider transactions for a given stock symbol - essentially an aggregate insider trading report card for each period. It shows the total number of insider buy transactions (acquisitions), sell transactions (dispositions), shares acquired vs. shares disposed, and even the ratio of buys to sells. In other words, it distills raw insider Form 4 filings into clear stats and trends. By analyzing these trends, you can gauge insider sentiment at a glance.
Insider Trade Statistics API returns data in JSON format, organized by year and quarter. For example, if we request insider stats for Apple (AAPL), we might get a response like this (abbreviated for clarity):
|
[ { "symbol": "AAPL", "year": 2025, "quarter": 3, "acquiredTransactions": 6, "disposedTransactions": 3, "acquiredDisposedRatio": 2.0, "totalAcquired": 391455, "totalDisposed": 125256, "averageAcquired": 65242.5, "averageDisposed": 41752, "totalPurchases": 0, "totalSales": 2 }, { "symbol": "AAPL", "year": 2025, "quarter": 2, "acquiredTransactions": 6, "disposedTransactions": 38, "acquiredDisposedRatio": 0.1579, "totalAcquired": 466004, "totalDisposed": 892618, "averageAcquired": 77667.3, "averageDisposed": 23489.9, "totalPurchases": 0, "totalSales": 13 }, … ] |
Each record above represents a quarter's insider trading summary for Apple. Let's break down the key fields and how to interpret them:
Acquired vs. Disposed Transactions.
The number of insider buy transactions (acquiredTransactions) versus sell transactions (disposedTransactions).
- In Apple's Q3 2025, insiders executed 6 buys and 3 sells - a 2:1 ratio favoring buys. This yielded an acquired-to-disposed ratio of 2.0 (6/3), indicating insiders bought twice as often as they sold.
- In contrast, Q2 2025 saw only 6 buys against 38 sells (ratio ~0.16), a heavy tilt toward selling.
The higher the ratio above 1, the more bullish the insider sentiment; below 1 suggests net insider selling pressure. This simple ratio reveals insider sentiment at a glance.
Total Acquired vs. Total Disposed Shares.
The aggregate number of shares insiders acquired versus sold in that quarter.
Volume matters - a few small stock option exercises (often reported as “acquisitions”) are very different from a CEO buying millions worth of shares on the open market.
In our Apple example, Q3 2025 had ~391k shares bought by insiders and ~125k shares sold. Insiders not only bought more frequently, they bought larger volume than they sold, aligning with a bullish outlook.
Average Trade Size.
The API also provides average acquired and disposed amounts (averageAcquired, averageDisposed).
This shows whether the typical insider trade was large or small. A high average buy size might mean a top executive made a particularly big purchase (a strong confidence signal), whereas many small sales might just be routine diversification.
For instance, Apple's Q3 2025 average insider buy (~65k shares) was larger than the average sale (~41k shares), suggesting those few sales were relatively smaller transactions compared to the purchases.
Purchase vs. Sale Transactions.
Fields like totalPurchases and totalSales often denote open-market purchase and sale transactions (excluding things like option exercises or grants).
In the snippet above, Apple had totalSales: 2 in Q3 2025 - indicating at least two insiders sold stock in open market transactions that quarter. Tracking open-market trades can be useful because they reflect deliberate buy/sell decisions (as opposed to automatic vesting of stock or gifts).
In general, when insiders buy shares outright on the open market, it's considered a bullish sign, since insiders are putting their own money on the line expecting the price to rise. High totalPurchases in a quarter would flag such bullish bets.
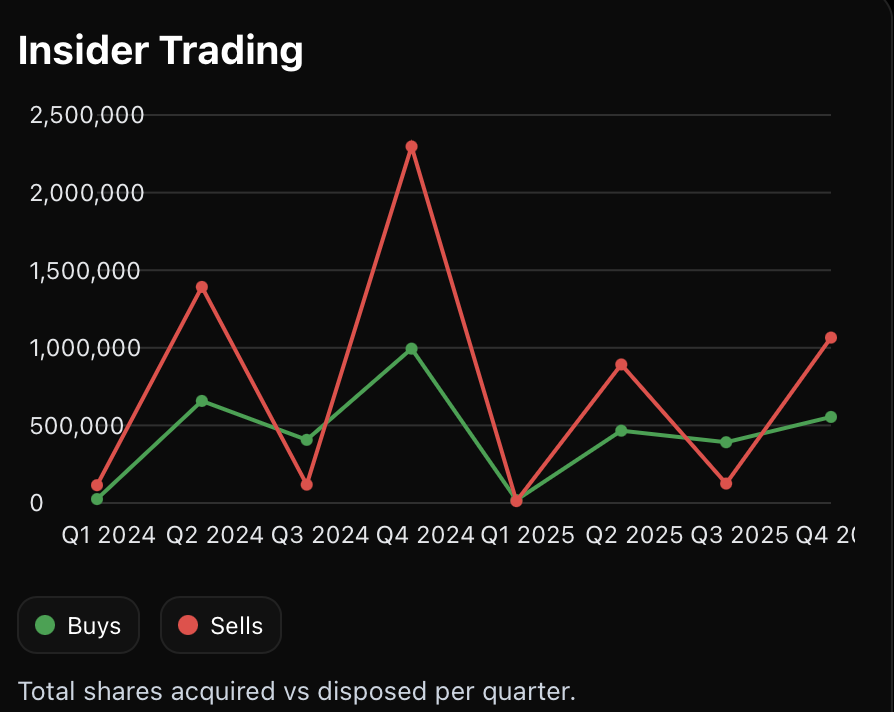
Insider Trading stats visualized.
Analyzing the Line Graph Above.
|
Apple (AAPL) insider trading statistics for 2025 by quarter, comparing total shares insiders acquired (“Shares Bought”) versus disposed (“Shares Sold”). Note the dramatic shift in Q3 2025 when insider buying far exceeded selling, followed by a return to net selling in Q4. As shown above, an insider trading tracker can visualize changes in insider behavior over time. In Apple's case, insiders were heavy net sellers in early 2025 (Q2), then turned into net buyers in Q3, and apparently swung back to selling in Q4. An analyst might ask: Why did Apple insiders buy so aggressively in Q3 2025? Perhaps they perceived the stock as undervalued or anticipated strong results (indeed, insider optimism often precedes positive news). The subsequent flip to net selling in Q4 could indicate insiders felt the stock had risen to a more fully valued level or knew of challenges ahead. While we'd need to corroborate with actual events (earnings reports, product launches, etc.), the insider trade data gave an early signal of shifting sentiment. |
Importantly, insider trading signals should be weighed in context. One quarter of selling by insiders isn't automatically bearish - insiders might sell for personal reasons (diversification, taxes). Conversely, occasional buys could be symbolic.
Focus on notable patterns: clusters of multiple insiders buying, sustained buying or selling across consecutive quarters, or extremely large single trades by top executives. These are the kinds of signals an insider trading tracker can spotlight for further analysis.
Setting Up Alerts for Unusual Insider Trading Activity
Detecting insider moves early is valuable - but only if you catch them in time. Rather than manually checking SEC filings or API data daily, you can automate an insider trading alert workflow. Below is a simple step-by-step approach to get started:
Get an API Key and Access the Endpoint.
Sign up for a free API key with FMP (Financial Modeling Prep) to unlock the insider trading data. With your API key, you can call the Insider Trade Statistics API for any stock ticker. For example, a GET request to:
|
https://financialmodelingprep.com/stable/insider-trading/statistics?symbol=AAPL&apikey=YOUR_API_KEY |
will fetch Apple's insider stats. (You can test this endpoint with your own ticker - e.g., try MSFT or TSLA - to see insider data for those companies.)
Define Your Alert Criteria.
Decide what insider trading patterns should trigger an alert. This can be tailored to your strategy.
For instance, you might set an alert if the acquired-to-disposed ratio exceeds 1 (more insider buys than sells) for the latest quarter - a possible bullish signal. Or, flag if total insider shares sold jump by, say, 50%+ from the prior quarter - which could be a red flag of insiders rapidly cashing out.
You could also watch for any cluster buy scenario: multiple insiders buying in the same week or quarter. Essentially, use the API's data points as filters - high buy/sell ratios, an unusual surge in transactions, or the presence of big open-market buys.
Schedule Regular Data Pulls.
Insiders report transactions throughout each quarter, and FMP's data updates as new filings come in.
Set up a scheduled job (daily or weekly) to pull the latest insider stats for your stocks of interest. This could be a simple Python script or Excel with FMP's add-on - whatever you're comfortable with. For example, you might run a daily script that checks the current quarter's acquiredTransactions and disposedTransactions counts.
If you see a jump in those numbers mid-quarter (e.g., several new insider trades filed this week), that might warrant attention even before the quarter ends.
Trigger Notifications.
When your criteria are met, have your system send an alert. This could be an email, a Slack message, or a push notification on your phone. For instance, Alert: Tesla insiders turned net buyers this quarter (buy/sell ratio now 1.5). Check if any big insider purchases were disclosed. By receiving such a prompt, you can investigate further.
Integrate Price Data for Confirmation.
An optional but useful step is to tie in real-time stock prices when an insider alert triggers. Using FMP's 5 Min Interval Stock Chart API, you could immediately see if the market is already reacting to the insider activity.
For example, if an alert tells you a CEO just bought shares and you notice the stock ticking up 2% on no other news, that's a sign the insider signal is impactful. Conversely, an insider selling alert during a quiet period might precede a stock drift downward.
By correlating price movements with insider alerts, you can decide whether to act (e.g. buy, sell, or hold) or investigate more.
Expert tip: FMP's 5 Min Interval Stock Chart API can fetch live or end-of-day prices easily; use it to confirm whether an insider trade signal is flying under the market's radar or starting to be priced in.
Setting up these alerts turns raw data into actionable insight. You'll effectively have a radar that pings you when insiders make noteworthy moves, so you can research and respond promptly. Many portfolio managers use such alerting systems to ensure they never miss a major insider trade on their key holdings.
From Prototype to Pro: Using FMP Plans to Scale Up
It's worth noting that Financial Modeling Prep offers tiers of API access suitable for different needs. For initial experiments and small-scale use, FMP's Basic plan (free) allows up to 250 API calls per day - plenty for testing a few stocks with insider alerts.
With basic access, you can easily try out the Insider Trade Statistics API on a handful of companies and even integrate it into a simple alert script without cost. In fact, many users start this way to prove the concept that insider data adds value to their investment process. (For example, you might track three stocks over a quarter and observe how insider signals aligned with their price moves.)
As you look to monitor more symbols or perform deeper analysis, upgrading unlocks much more. Premium and Ultimate plans open the door to high-volume API calls and broader historical datasets. This is crucial if you want full coverage of, say, the entire S&P 500 for insider trading alerts - or if you want to backtest your insider-based strategy across many years of data. With higher-tier plans, you can pull decades of insider trading history to see how well insider buy signals would have predicted past rallies, or how clusters of insider selling coincided with eventual stock drops.
Such backtesting can refine your alert criteria (for example, you might discover that a buy/sell ratio > 2 with at least three insiders buying is a particularly bullish combination historically). Moreover, Premium/Ultimate plans support more frequent calls (hundreds or thousands per minute) - enabling real-time monitoring and instantaneous alerts even for large portfolios.
Gaining an Edge with Insider Insights
In the arms race for market insight, insider trading data is a high-caliber tool. It's about seeing what those in the know are doing with their own money - and doing so before the rest of the market catches on. By using an Insider Trade Statistics API analysts and portfolio managers can spot subtle but powerful signals: a CFO's confident buy, a cluster of board members quietly accumulating shares, or an unusual surge in selling by top execs.
We've shown how these signals often precede stock moves, and how straightforward it is to pull this data and set up alerts. The result is a more proactive investment strategy - one that can anticipate inflection points rather than just react to headlines.
As you incorporate insider trading analysis into your process, remember to blend it with other research (fundamentals, earnings, technical trends). Insider signals shine brightest when viewed in context. And thanks to modern APIs and automation, tracking insider activity no longer requires tedious research - it updates itself daily, flagging only what matters.
FAQs
What does insider buying or selling signal about a stock's future?
Insider buying is generally seen as a bullish signal, because it suggests those closest to the company (management and directors) are confident in the company's prospects. They often buy when they believe the stock is undervalued or good news is coming. Studies confirm that when insiders as a group are net buyers, their companies tend to outperform subsequently. Insider selling can be a bearish signal if it's large or cluster-like - it might mean insiders think the stock's price has peaked or that challenges loom. However, context is key: insiders may sell for personal liquidity or diversification reasons. It's most telling when there's unusual selling (many insiders selling at once or volumes far above normal).
What is the Financial Modeling Prep Insider Trade Statistics API and what does it provide?
It's an API endpoint that provides quarterly statistics on insider trading activity for a given stock. Instead of listing every individual trade, it summarizes the insider trades by quarter. Key data points include: the number of insider purchase transactions, number of insider sale transactions, the ratio of purchases to sales, total shares insiders bought, total shares they sold, and related metrics for that period. Essentially, it transforms raw insider trading filings into an easy-to-read trend report. For example, you can quickly see if in a certain quarter insiders were net buyers (more buy transactions than sells, high buy/sell ratio) or net sellers. The API is simple to use - you just supply a stock ticker symbol and your API key, and it returns a JSON array of these stats per quarter.
How can I set up an alert to notify me of insider trading activity?
You can set up an insider trading alert system in a few steps, even without expensive software. First, decide what you want to be alerted on - for example, when insiders turn from net selling to net buying in a quarter, or when a very large insider purchase occurs. Next, use an API call to retrieve insider data on a schedule. For instance, you could run a small script every day that checks the latest quarter's stats for your stocks. Many users utilize Python or JavaScript for this, but even a Google Sheet with a script can work. Then implement logic: “if condition X is met, send alert”. The alert could be an email or SMS. For example, using Python you might use an SMTP library to email yourself: “Alert: Insider buy ratio for Company ABC is above 1.5 this quarter (insiders buying heavily)”. If you're not a coder, you might use FMP's Google Sheets add-on to highlight certain values. The key is automation - schedule the data fetch, evaluate it, and notify you so it's hands-free.
As a concrete starting point, consider monitoring the acquiredDisposedRatio and totalAcquired/totalDisposed. A sharp change or an extreme value in those could be your trigger. Over time, you can refine the thresholds to balance sensitivity (catching true signals) vs. noise.
How reliable are insider trading signals? Should I trade solely based on insider data?
While insider activity is a well-regarded indicator, it's not infallible, and it shouldn't be the sole basis for trading decisions. Insiders, despite their better knowledge, aren't always correct about stock direction - sometimes they buy and the stock still falls due to unforeseen events or broader market conditions. Also, not all insider selling is predictive of trouble; insiders might sell for innocuous reasons (new house, tax bill, etc.).
That said, historically, patterns of insider buying have shown a tendency for positive abnormal returns, meaning there is informational value there. The best practice is to use insider signals as one input in a mosaic of information: combine it with fundamentals (are insiders buying ahead of a strong earnings report?), technicals (does the stock's chart show a bottom while insiders buy?), and other data like analyst opinions or macro trends.
Which FMP subscription plan do I need to effectively track insider trading?
It depends on your scope. For basic needs - say you want to track a few companies and don't require extensive history - the free Basic plan (250 API calls/day) is often sufficient. You can pull insider stats for a handful of tickers every day. If you need to track many stocks (dozens or more) or want richer data (like historical insider data for backtesting), a paid plan is beneficial. The Starter plan allows more calls per minute and additional years of historical data, which might help if you want to analyze trends over the past 5+ years. For professional or heavy usage, the Premium or Ultimate plans are designed for scale - they offer high call volumes (hundreds to thousands of calls per minute) and global coverage with decades of history. These plans are suitable if you're building a comprehensive system (for example, screening the entire market for top insider buy signals, or running systematic strategies off insider data). One advantage of higher tiers is access to real-time endpoints and faster updates.
Can I combine insider trading data with other datasets for better insights?
Absolutely - in fact, it's highly recommended. Insider trading data on its own tells you what insiders are doing, but combining it with other data can tell you why and what to do about it. For example, you might merge insider data with fundamental data (using FMP's financial statements or ratios API). If insiders are buying heavily while the company's revenue and earnings are improving, that double-confirmation is powerful. Or, if insiders are selling but you see the stock's valuation is extremely high relative to peers, it could reinforce a decision to trim that position.
Another fruitful combination is with earnings or analyst estimates: FMP's Earnings Calendar API could tell you if insider buying is occurring just before earnings - perhaps a bullish hint. On the technical side, overlaying insider transactions with stock price charts can be illuminating; you might notice, for instance, insiders tend to buy on dips (support levels) and sell after run-ups.
Some sophisticated investors even incorporate alternative data like social sentiment or macro indicators - for instance, if many insiders in an industry are selling, and at the same time macro data for that industry is weakening, it's a stronger signal of a sector-wide issue.

Top 5 Defense Stocks to Watch during a Geopolitical Tension
In times of rising geopolitical tension or outright conflict, defense stocks often outperform the broader market as gove...

Circle-Coinbase Partnership in Focus as USDC Drives Revenue Surge
As Circle Internet (NYSE:CRCL) gains attention following its recent public listing, investors are increasingly scrutiniz...

LVMH Moët Hennessy Louis Vuitton (OTC:LVMUY) Financial Performance Analysis
LVMH Moët Hennessy Louis Vuitton (OTC:LVMUY) is a global leader in luxury goods, offering high-quality products across f...

