FMP
Mastering 13F Filings: FMP APIs for Smart Money Tracking
Jan 17, 2026
Mastering 13F Filings: FMP APIs for Smart Money Tracking
Form 13F filings are quarterly disclosures that reveal the equity holdings of large institutional investors, including hedge funds, mutual funds, and pension managers. These reports turn regulatory transparency into a repeatable research input, letting you track where so-called smart money is positioned and how it evolves over time. Since 13F disclosures are reported with a delay, they are best used to understand structural shifts and directional conviction rather than to generate real-time trade signals.
Financial Modelling Prep's 13F endpoints suite is not limited to a single generic endpoint. Instead, it offers a focused suite of institutional ownership APIs for filings discovery, dates, detailed holdings, and performance analytics. This article shows how to combine these endpoints into a practical workflow for research, screening, and strategy prototyping.
What you should know about 13F Submissions
SEC Rule 13f-1 requires institutional investment managers with over $100 million in Section 13(f) securities to file Form 13F four times a year. Filings are due 45 days after each quarter end, typically landing around Feb 14, May 15, Aug 14, and Nov 14. They're submitted through EDGAR, which is also where we'll pull the data from in the workflow below.
A few constraints matter. 13F is a delayed snapshot, so holdings can change between quarter end and publication. It also excludes shorts and much of the derivatives exposure, may omit some positions under confidential treatment, and quarter-end reporting can create a slightly “cleaned up” view. But if you treat it as a structural footprint instead of a real-time signal, it's still extremely useful for screening, monitoring, and institutionally focused research.
Endpoints overview
FMP provides a suite of endpoints for the 13F filings. Let's take a look at them.
1. Institutional Ownership Filings API:
This API provides a list of all the latest filings.
Use this when: you want a rolling feed of new 13F submissions to monitor, backfill, or build a filing index.
|
url = f'https://financialmodelingprep.com/stable/institutional-ownership/latest' querystring = {"apikey":token, "page":0, "limit":100} resp = requests.get(url, querystring).json() resp[0] |
Let's take a look at what it returns.
|
{'cik': '0001054257', 'name': 'ADIRONDACK TRUST CO', 'date': '2025-12-31', 'filingDate': '2026-01-08 00:00:00', 'acceptedDate': '2026-01-08 15:23:04', 'formType': '13F-HR', 'link': 'https://www.sec.gov/Archives/edgar/data/1054257/000105425726000001/0001054257-26-000001-index.htm', 'finalLink': 'https://www.sec.gov/Archives/edgar/data/1054257/000105425726000001/SGSE123A.xml'} |
|
Field |
Description |
Example / Value |
|
cik |
Unique 10-digit SEC identifier for the filer |
0001054257 (Adirondack Trust Co) |
|
name |
Full legal name of the institutional investment manager |
Adirondack Trust Co |
|
date |
End of the reporting quarter for portfolio holdings |
2025-12-31 (Q4 2025) |
|
filingDate |
Scheduled/public due date for submission |
2026-01-08 |
|
acceptedDate |
Exact timestamp the SEC system processed the filing |
2026-01-08 15:23:04 |
|
formType |
Document type (official quarterly holdings report) |
13F-HR |
|
link |
URL to the primary SEC EDGAR index page |
[SEC Index Page] |
|
finalLink |
Direct URL to the XML data containing holdings |
[XML Data Link] |
2. Form 13F Filings Dates API:
This helper API identifies the most recent filing dates for specific institutional investors, streamlining access to their latest 13F-HR submissions.
Use this when: you already know the CIK and want the valid year and quarter values before calling extract.
|
url = f'https://financialmodelingprep.com/stable/institutional-ownership/dates' querystring = {"apikey":token, "cik":"0001067983"} resp = requests.get(url, querystring).json() resp[0] |
With the first item in the response
|
{'date': '2025-09-30', 'year': 2025, 'quarter': 3} |
We can see that Berkshire Hathaway Inc.'s latest filing was for the third quarter of 2025. Since the code was executed in early January 2026, it is clear from our discussion that the last quarter of 2025 will only be available by mid-February.
3. Filings Extract API:
This API reveals the core information we're after. This is the primary extraction step in the workflow. It gives you the actual quarter-level holdings table for a manager, which is what everything else in this article builds on.
Use this when: you want to pull the raw positions for analysis, then run sizing, concentration, and change detection on top of it.
|
url = f'https://financialmodelingprep.com/stable/institutional-ownership/extract' querystring = {"apikey":token, "cik":"0001067983", "year":2025, "quarter":3} resp = requests.get(url, querystring).json() resp[0] |
The return is a list of dictionaries, so let's examine the first one
|
{'date': '2025-09-30', 'filingDate': '2025-11-14', 'acceptedDate': '2025-11-14', 'cik': '0001067983', 'securityCusip': '166764100', 'symbol': 'CVX', 'nameOfIssuer': 'CHEVRON CORP NEW', 'shares': 122064792, 'titleOfClass': 'COM', 'sharesType': 'SH', 'putCallShare': '', 'value': 18955441549, 'link': 'https://www.sec.gov/Archives/edgar/data/1067983/000119312525282901/0001193125-25-282901-index.htm', 'finalLink': 'https://www.sec.gov/Archives/edgar/data/1067983/000119312525282901/46994.xml'} |
For some of the fields we have already discussed, and some are self-explanatory, so let's see the rest
|
Field |
Description |
Value |
|
securityCusip |
Unique 9-character security identifier |
166764100 |
|
symbol |
Stock ticker symbol |
CVX |
|
nameOfIssuer |
Full legal name of the issuer |
CHEVRON CORP NEW |
|
shares |
Total number of shares held |
122,064,792 |
|
titleOfClass |
Classification of the security |
COM (Common Stock) |
|
sharesType |
Type of unit (SH = Shares) |
SH |
|
putCallShare |
Options indicator (blank = long position) |
— |
|
value |
Market value in USD (rounded to thousands) |
$18,955,441,549 |
Once you have this table, you can do most of the practical work people care about. You can screen for the largest positions across managers, measure concentration using top-10 weights, flag new buys and full exits by comparing quarter snapshots, and track which names are consistently showing up across “quality” holders. That is usually where 13F goes from interesting to usable.
4. About Holder Performance Summary API:
This is a very important API that aggregates a manager's historical filings into a quarter-by-quarter performance summary.
Use this when: you want a quick profile of how a manager behaves over time, including turnover, holding period, and relative performance.
|
url = f'https://financialmodelingprep.com/stable/institutional-ownership/holder-performance-summary' querystring = {"apikey":token, "cik":"0001067983"} resp = requests.get(url, querystring).json() resp[0] |
The first dictionary on the list, is the latest filing
|
{'date': '2025-09-30', 'cik': '0001067983', 'investorName': 'BERKSHIRE HATHAWAY INC', 'portfolioSize': 41, 'securitiesAdded': 1, 'securitiesRemoved': 1, 'marketValue': 267334501955, 'previousMarketValue': 257521776925, 'changeInMarketValue': 9812725030, 'changeInMarketValuePercentage': 3.8104, 'averageHoldingPeriod': 20, 'averageHoldingPeriodTop10': 30, 'averageHoldingPeriodTop20': 29, 'turnover': 0.0488, 'turnoverAlternateSell': 5.311, 'turnoverAlternateBuy': 2.1783, 'performance': 18188168826, 'performancePercentage': 7.0628, 'lastPerformance': 872745594, 'changeInPerformance': 17315423232, 'performance1year': 20541689306, 'performancePercentage1year': 7.9581, 'performance3year': 148986085480, 'performancePercentage3year': 60.5055, 'performance5year': 180946412191, 'performancePercentage5year': 86.7761, 'performanceSinceInception': 257186897786, 'performanceSinceInceptionPercentage': 192.2505, 'performanceRelativeToSP500Percentage': -0.7299, 'performance1yearRelativeToSP500Percentage': -8.111, 'performance3yearRelativeToSP500Percentage': -26.0305, 'performance5yearRelativeToSP500Percentage': -12.108, 'performanceSinceInceptionRelativeToSP500Percentage': -135.902} |
Again, let's see the most important fields:
|
Category |
Field |
Value / Detail |
Decision Relevance |
|
Portfolio Composition |
portfolioSize |
41 Securities |
Indicates a concentrated vs. diversified strategy. |
|
securitiesAdded |
1 Position |
Low activity; suggests high conviction in current holdings. |
|
|
securitiesRemoved |
1 Position |
Minimal selling; confirms a long-term outlook. |
|
|
Market Value |
marketValue |
$267.33B |
Total capital under management (AUM). |
|
changeInMarketValue |
$9.81B (↑ 3.81%) |
Growth in total assets since last quarter. |
|
|
Behavior & Strategy |
turnover |
4.88% |
High Importance: Confirms a classic "Buy and Hold" style. |
|
averageHoldingPeriod |
20 Quarters (5 yrs) |
Measures patience; Top 10 held even longer (30 quarters). |
|
|
Performance |
performance |
$18.19B (7.06%) |
The raw "bottom line" for the current period. |
|
changeInPerformance |
$17.32B |
Shows significant acceleration vs. the prior period. |
|
|
Benchmarks |
vs. S&P 500 |
1, 3, 5 Year & Inception |
Determines if the manager is actually adding value (Alpha). |
5. Filings Extract With Analytics By Holder API:
This is an analytics-layer endpoint. Instead of only telling you “who holds this stock,” it adds the computed context that usually takes the most effort to build yourself. Position weight, quarter over quarter changes, ownership shifts, and performance are already calculated in a consistent format, which matters a lot once you move from one ticker to hundreds.
Use this when: you want to answer “which institutions own this stock, how did their position change, and what did that change do to performance.”
|
url = f'https://financialmodelingprep.com/stable/institutional-ownership/extract-analytics/holder' querystring = {"apikey":token, "symbol":"AAPL", "year":2025, "quarter":3, "page":0, "limit":10} resp = requests.get(url, querystring).json() resp[0] |
The first result in the list returned shows how Vanguard (one of the largest providers of ETFs) performed in the third quarter of 2025 with Apple.
|
{'date': '2025-09-30', 'cik': '0000102909', 'filingDate': '2025-11-07', 'investorName': 'VANGUARD GROUP INC', 'symbol': 'AAPL', 'securityName': 'APPLE INC', 'typeOfSecurity': 'COM', 'securityCusip': '037833100', 'sharesType': 'SH', 'putCallShare': 'Share', 'investmentDiscretion': 'DFND', 'industryTitle': 'ELECTRONIC COMPUTERS', 'weight': 5.3341, 'lastWeight': 4.7022, 'changeInWeight': 0.6319, 'changeInWeightPercentage': 13.4379, 'marketValue': 356336138233, 'lastMarketValue': 290506933377, 'changeInMarketValue': 65829204856, 'changeInMarketValuePercentage': 22.6601, 'sharesNumber': 1399427162, 'lastSharesNumber': 1415932804, 'changeInSharesNumber': -16505642, 'changeInSharesNumberPercentage': -1.1657, 'quarterEndPrice': 254.63, 'avgPricePaid': 37.69, 'isNew': False, 'isSoldOut': False, 'ownership': 9.3903, 'lastOwnership': 9.5011, 'changeInOwnership': -0.1108, 'changeInOwnershipPercentage': -1.1657, 'holdingPeriod': 83, 'firstAdded': '2005-03-31', 'performance': 70032036485, 'performancePercentage': 24.1068, 'lastPerformance': -23757412120, 'changeInPerformance': 93789448605, 'isCountedForPerformance': True} |
This is an exhaustive list, so it is better to discuss the returns grouped by nature
|
Category |
Key Metrics Included |
|
Filing & Identification |
Quarter-end date, filer CIK, filing date, investor name, security details (symbol, CUSIP, type, industry). |
|
Portfolio Weighting |
Current weight in portfolio, previous weight, absolute/percentage change in weighting. |
|
Market Value Changes |
Current market value, prior value, absolute/percentage increase in position value. |
|
Share Position Changes |
Current shares held, prior shares, absolute/percentage reduction (net selling). |
|
Pricing & Cost Basis |
Quarter-end price, average purchase price paid, new/sold-out flags. |
|
Ownership Metrics |
Overall ownership % of company, prior ownership %, change metrics, holding duration since first purchase. |
|
Performance Metrics |
Absolute performance gain, percentage return, comparison to prior quarter's performance. |
How is Berkshire investing
We have already shown how to get the latest filing date of an investor. So let's plot in a pie chart how Berkshire has its portfolio distributed. We will plot as “Other” all the assets that have a weight of less than 1% so we don't get overwhelmed.
|
url = f'https://financialmodelingprep.com/stable/institutional-ownership/extract' querystring = {"apikey":token, "cik":"0001067983", "year":2025, "quarter":3} resp = requests.get(url, querystring).json() df_holdings = pd.DataFrame(resp) # Calculate the weight of the value for each row relative to the total value df_holdings['weight'] = (df_holdings['value'] / df_holdings['value'].sum()) * 100 # Group holdings with weight less than 1% into "Other" threshold = 1.0 mask = df_holdings['weight'] < threshold plot_df = df_holdings[~mask].copy() other_weight = df_holdings[mask]['weight'].sum() if other_weight > 0: other_row = pd.DataFrame({'nameOfIssuer': ['Other'], 'weight': [other_weight]}) plot_df = pd.concat([plot_df, other_row], ignore_index=True) # Sort for better visualization in the pie chart plot_df = plot_df.sort_values(by='weight', ascending=False) # Plot in a pie chart import matplotlib.pyplot as plt plt.figure(figsize=(10, 10)) plt.pie(plot_df['weight'], labels=plot_df['nameOfIssuer'].fillna('N/A'), autopct='%1.1f%%', startangle=140) plt.title('Portfolio Weight Distribution (Holdings < 1% grouped as Other)') plt.show() |
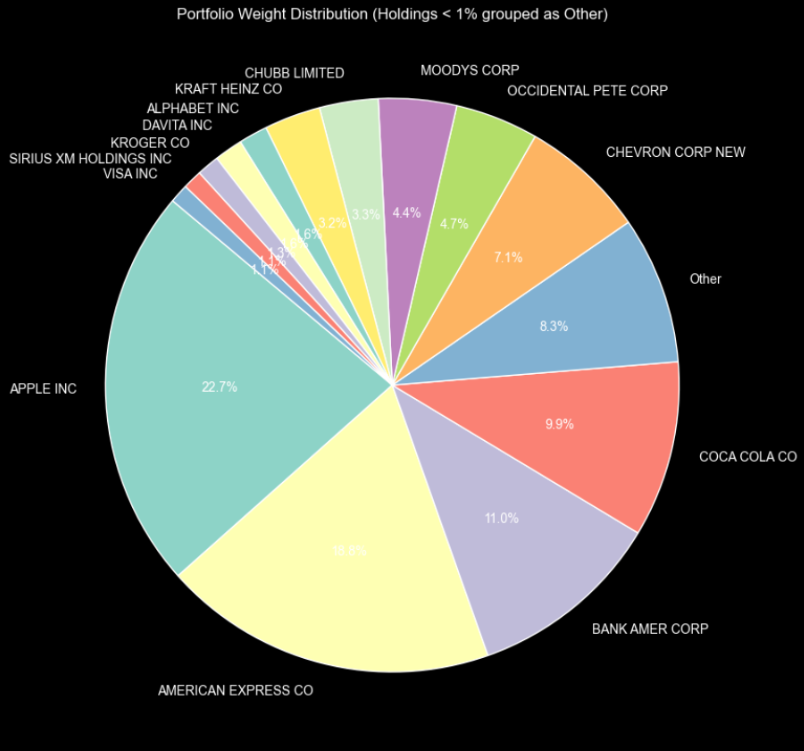
The pie chart indicates that Berkshire Hathaway's portfolio predominantly includes Apple Inc (27%), Coca Cola (11%), American Express (9%), Chevron (8%), along with a grouping labelled " Other " that includes Bank of America. Additionally, Moody's, Occidental Petroleum, Kraft Heinz, Visa, and Kroger are also notable holdings. The combined value of holdings under 1% is represented as "Other," highlighting Buffett's focus on concentrated value investments in consumer, financial, and energy sectors. His statement about avoiding complex technology stocks he doesn't understand clearly reflects his investment philosophy.
But who is investing in a certain stock?
Tracking institutional ownership of a stock is crucial, as it indicates where "smart money" is investing, reflecting confidence in the stock's prospects. For quants, ownership data enhances factor models based on momentum, value, and sentiment. For fundamental investors, it helps confirm whether their thesis aligns with the flow of professional capital. Let's examine Apple's stock investors. Using the Filings Extract With Analytics By Holder API, we will compile all institutional investors of Apple into a dataframe named df_all_holders.
|
all_data = [] page = 0 url = f'https://financialmodelingprep.com/stable/institutional-ownership/extract-analytics/holder' while True: querystring = {"apikey": token, "symbol": "AAPL", "year": 2025, "quarter": 3, "page": page, "limit": 100} resp = requests.get(url, querystring).json() if not resp: break all_data.extend(resp) page += 1 df_all_holders = pd.DataFrame(all_data) |
And by sorting by sharesNumber, we can get the top holders
|
# Sort by shares in descending order and select the top 10 top_10_holders = df_all_holders.sort_values(by='sharesNumber', ascending=False).head(10) # Display the investor name and the number of shares top_10_holders[['investorName', 'sharesNumber', 'weight']] |
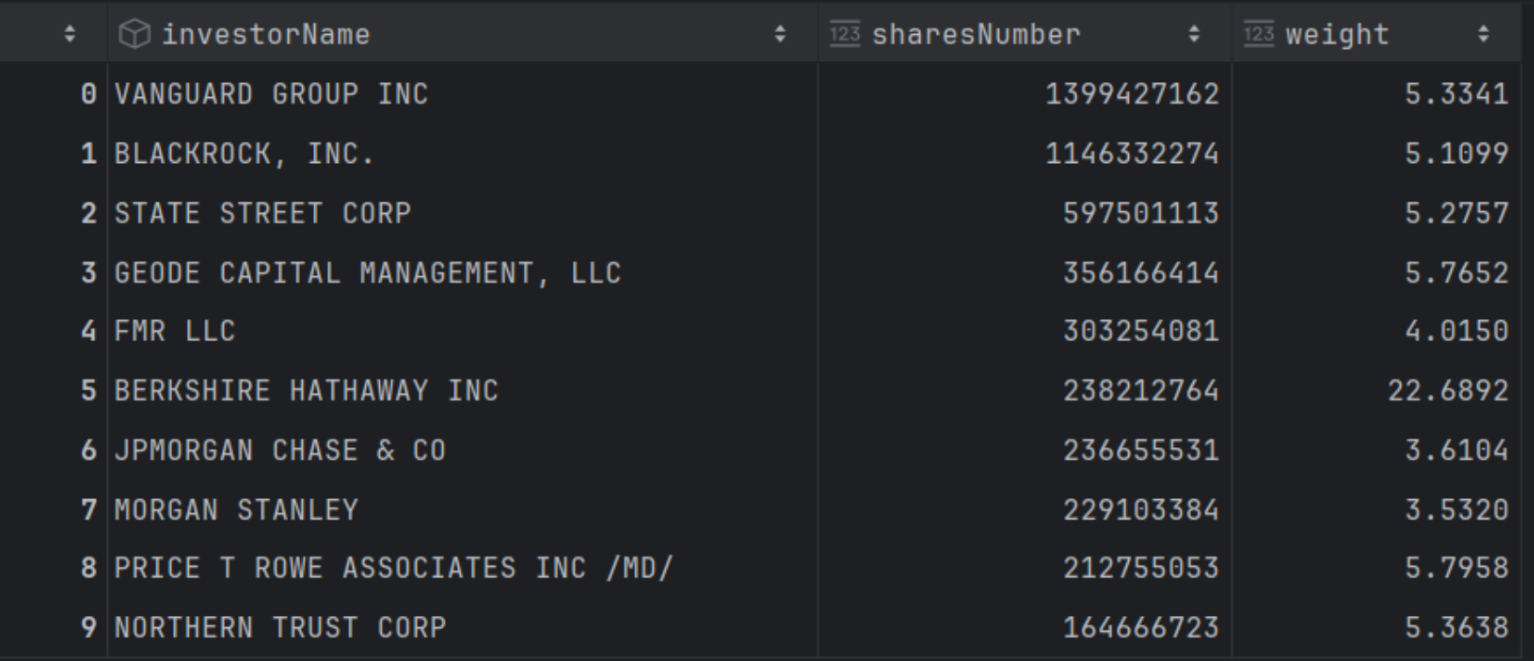
Vanguard is the largest institutional investor in Apple, which is expected since it's one of the biggest ETF providers. However, Berkshire has the highest percentage of its portfolio invested in Apple, at 22%. Now, let's identify which investors have Apple as the main component of their portfolios. We can do this by sorting the data by investment weight.
|
# Sort by shares in descending order and select the top 10 top_10_holders_weight = df_all_holders.sort_values(by='weight', ascending=False).head(10) # Display the investor name and the number of shares top_10_holders_weight[['investorName', 'weight']] |
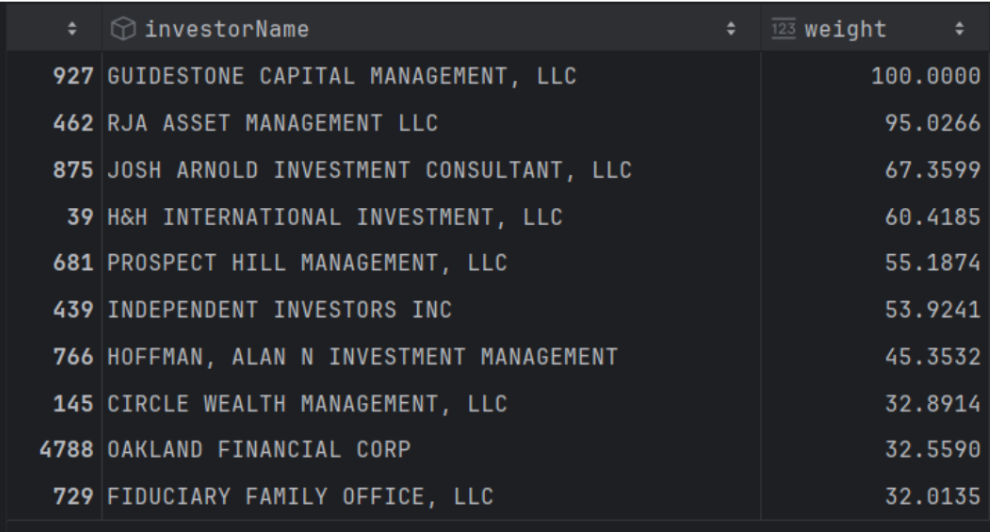
This result shows that several institutional investors have invested more than 30% of their portfolios in Apple. This information can be useful for your research on specific investors you wish to monitor. For example, if you believe someone has made significant profits from a particular stock, your investing profile can track that to generate ideas for specific investments.
This endpoint provides additional interesting information, such as the gain of the institutional investor over time in the specific asset and the average holding period. So, let's plot how the top 10 holders of Apple compare with this information.
|
import matplotlib.pyplot as plt # Calculate the % gain using the provided formula top_10_holders['pct_gain'] = (top_10_holders['quarterEndPrice'] - top_10_holders['avgPricePaid']) / top_10_holders[ 'avgPricePaid'] * 100 # Plot scatter chart: X = % gain, Y = averageHoldingPeriod plt.figure(figsize=(10, 6)) plt.scatter(top_10_holders['pct_gain'], top_10_holders['holdingPeriod'], color='tab:blue', alpha=0.7) # Add labels for each point (investor names) for i, row in top_10_holders.iterrows(): plt.annotate(row['investorName'], (row['pct_gain'], row['holdingPeriod']), fontsize=8, alpha=0.8) plt.title('Top 10 Holders: % Gain vs. Holding Period') plt.xlabel('% Gain (quarterEndPrice - avgPricePaid / avgPricePaid)') plt.ylabel('Holding Period (Quarters)') plt.grid(True, linestyle='--', alpha=0.6) plt.tight_layout() plt.show() |
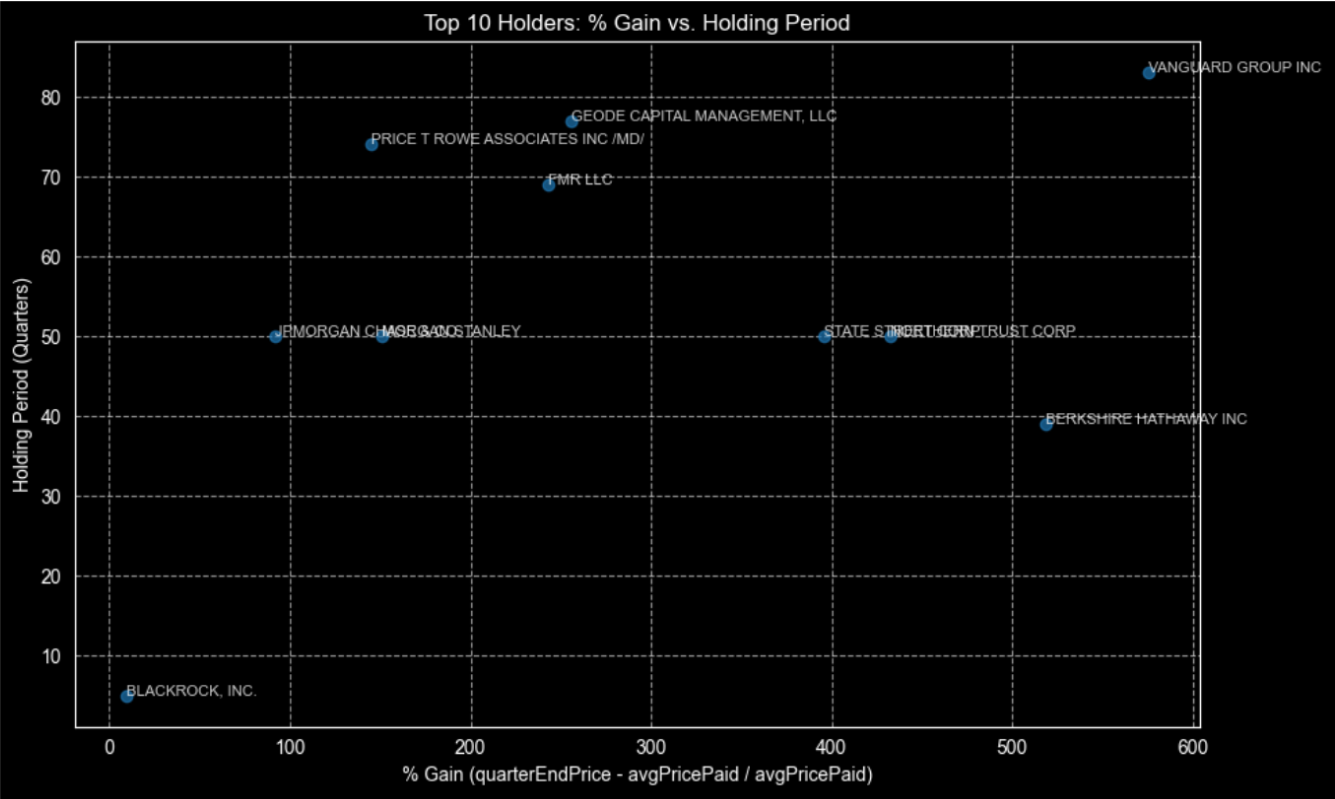
This plot is a clean way to compare holding period versus outcome across the top holders, but it's descriptive, not causal.
Here, BlackRock sits on the shorter holding-period end, while Vanguard and Berkshire show longer holding windows and higher percentage gains in this quarter-based view. Morgan Stanley clusters around mid-range holding periods with more modest gains. The value of this chart is pattern-spotting, then validating it across multiple quarters and contexts, not treating it as proof that “conviction creates alpha.”
You can also follow FMP's blog, where (among other things) you can find interesting analyses for Berkshire's investments, like the “Apple Inc. Stock Analysis and Berkshire Hathaway's Strategic Shift”, or even a general one for Berkshire, “Berkshire Hathaway Inc. Showcases Strong Financial Performance.”
Does Berkshire's portfolio go along with its price?
This is a bit of an optional, exploratory detour rather than a core 13F workflow, but it's a useful sanity check. Berkshire is both an institutional filer and a publicly traded company, so we can compare the historical market value of its reported 13F portfolio against BRK.B's stock price over time.
First, we'll pull Berkshire's historical portfolio market value using the Holder Performance Summary endpoint and stitch together every page of results.
|
all_performance_data = [] page = 0 url = f'https://financialmodelingprep.com/stable/institutional-ownership/holder-performance-summary?' while True: querystring = {"apikey": token, "cik": "0001067983", "page": page} resp = requests.get(url, querystring).json() if not resp: break all_performance_data.extend(resp) page += 1 df_performance_summary = pd.DataFrame(all_performance_data) df_performance_summary = df_performance_summary.drop_duplicates() df_performance_summary['date'] = pd.to_datetime(df_performance_summary['date']) df_performance_summary = df_performance_summary.sort_values(by='date') df_performance_summary = df_performance_summary.set_index('date') |
After that, we will obtain the stock price (symbol BRK-B) from the earliest date available in the 13F filings.
|
symbol = 'BRK-B' url = f'https://financialmodelingprep.com/api/v3/historical-price-full/{symbol}' min_ts = (df_performance_summary.index.min() - pd.DateOffset(months=1)).strftime('%Y-%m-%d') querystring = {"apikey":token, "from":min_ts} resp = requests.get(url, querystring).json() df_prices = pd.DataFrame(resp['historical'])[['date', 'adjClose']] df_prices['date'] = pd.to_datetime(df_prices['date']) df_prices = df_prices.set_index('date') |
And finally, we will plot them.
|
# Join the DataFrames on the date index and handle missing values by forward filling df_combined = df_performance_summary[['marketValue']].join(df_prices[['adjClose']], how='outer') df_combined = df_combined.sort_index().ffill() # Create the plot with twin y-axes fig, ax1 = plt.subplots(figsize=(14, 7)) # Plot Market Value on the left Y-axis color_mv = 'tab:blue' ax1.set_xlabel('Date') ax1.set_ylabel('Market Value', color=color_mv) ax1.plot(df_combined.index, df_combined['marketValue'], color=color_mv, label='Market Value') ax1.tick_params(axis='y', labelcolor=color_mv) ax1.grid(True, linestyle='--', alpha=0.5) # Create a second y-axis for Adjusted Close ax2 = ax1.twinx() color_adj = 'tab:red' ax2.set_ylabel('Adj Close', color=color_adj) ax2.plot(df_combined.index, df_combined['adjClose'], color=color_adj, label='Adj Close (BRK-B)') ax2.tick_params(axis='y', labelcolor=color_adj) plt.title('Berkshire Hathaway: Portfolio Market Value vs. Stock Price Over Time') fig.tight_layout() plt.show() |
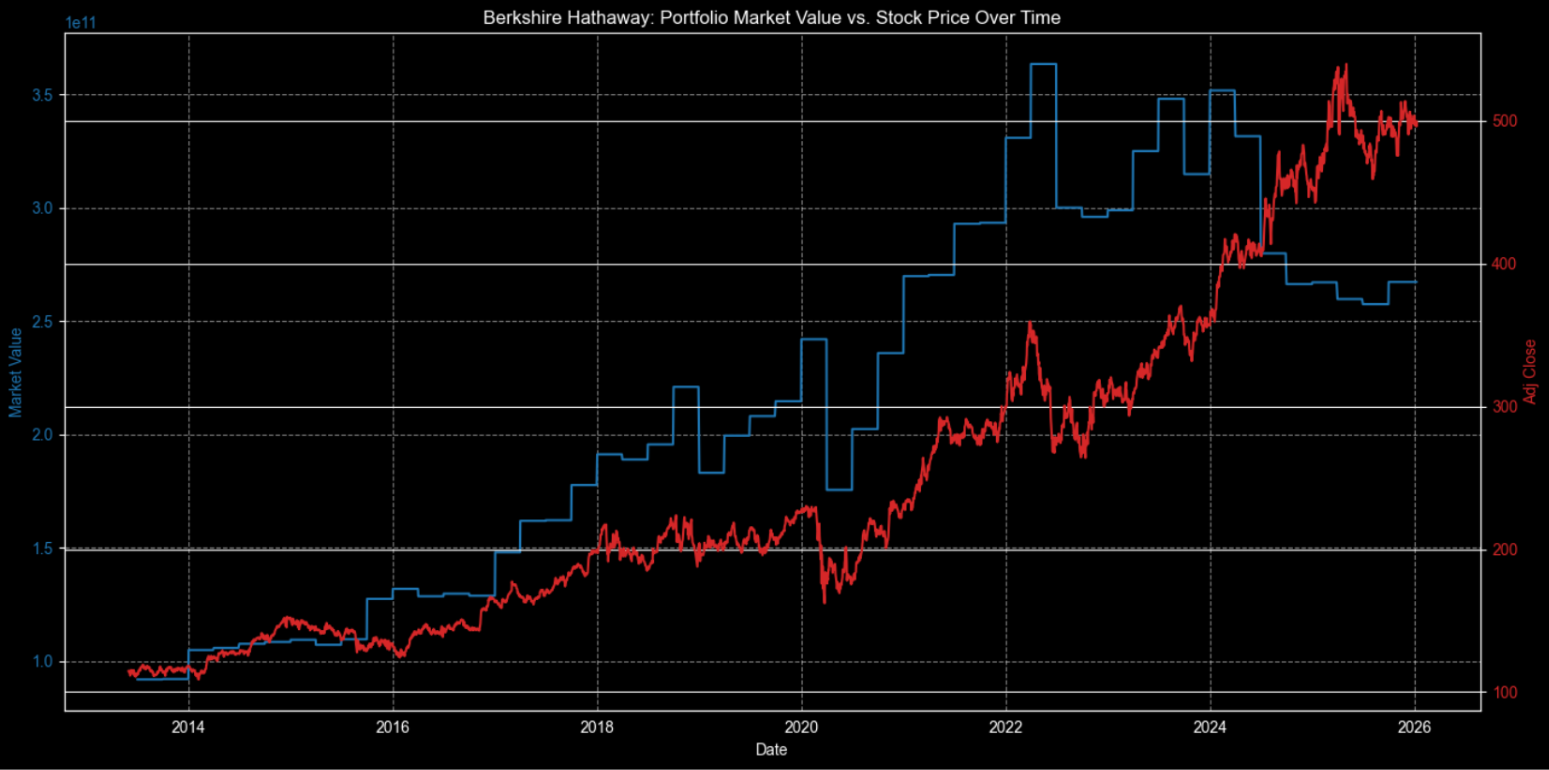
Early on, the portfolio outpaces the stock thanks to compounding from dividends and smart adds in undervalued names. But post-mid-2024 reversal happens and most probably this is because of what we all read over that news that Buffett keeps massive cash (~$350B+ by 2025) and selling stocks amid high valuations, parking in T-bills for yield while waiting for deals, dragging portfolio growth below the surging equity market.
EDGAR Database
At the beginning of the article, we assumed the CIK of Berkshire Hathaway, so it will be useful to show you an easy way to obtain this. And this can be found from the EDGAR system where all this information resides.
First, you will need to go to the Company Search page (https://www.sec.gov/search-filings) and input “Berkshire Hathaway”
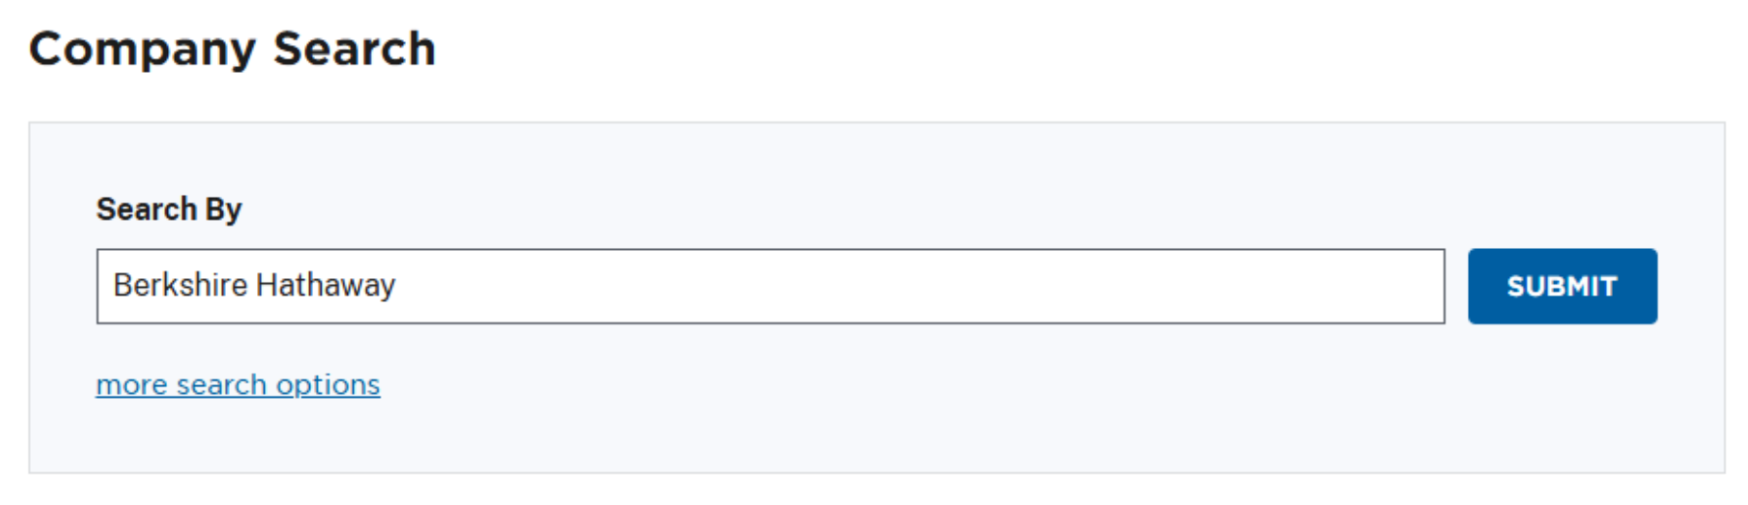
This will bring you all the institutional investors with this in text in their name
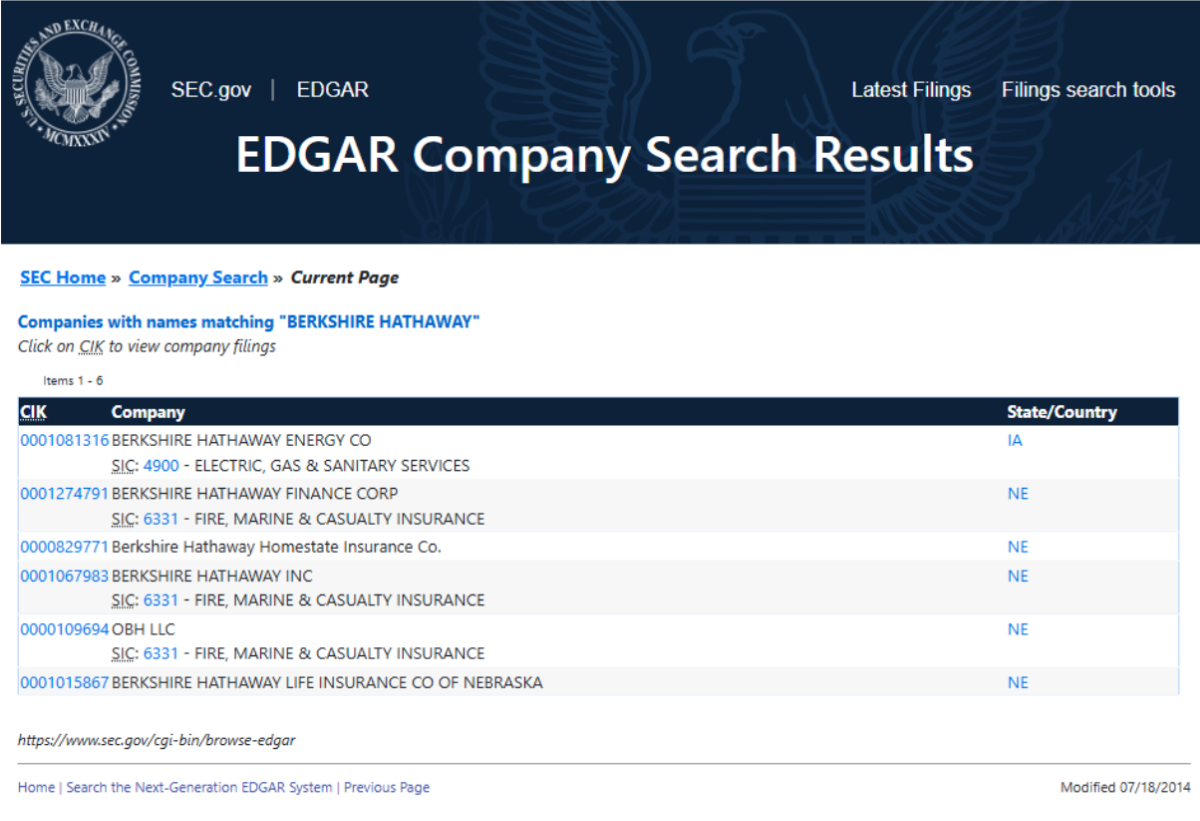
There, you can easily locate the “BERKSHIRE HATHAWAY INC” which is the proper instrument. Of course, you will see other peripheral subsidiaries of the same company, but the main one is the one with CIK 0001067983.
Final thoughts
FMP's 13F APIs provide institutional-level insights derived from SEC filings, enabling developers to track hedge fund positions, understand portfolio changes, and measure conviction through turnover data. These endpoints simplify the process from EDGAR discovery to developing robust analytics pipelines.
Use these APIs within quantitative screening systems to detect crowding trends and momentum indicators. Although filings are reported with a 45-day delay, combining ownership signals with price and volume filters uncovers structural biases that sustain alpha across different market conditions.
FAQs
1) What is a 13F filing and why do investors track it?
A 13F is a quarterly SEC disclosure that shows the long U.S. equity positions held by large institutional managers. Investors track it to understand how major funds are positioned, spot concentration, and see how portfolios evolve across quarters. It is best used for structural, directional insight since it is reported with a lag.
2) How often are 13F filings updated and how delayed is the data?
13F filings are reported quarterly, and they can be filed up to 45 days after the quarter ends. That lag means you are looking at a snapshot, not a real-time signal, so the value comes from studying trends, persistence, and portfolio shifts rather than trying to trade the filings directly.
3) Which FMP endpoints should I use to build a full 13F tracking workflow?
A practical workflow usually starts with the latest filings list, then uses filing dates to select the right quarter, then extracts holdings for portfolio composition. After that, the performance summary and analytics endpoints help you quantify changes, compare periods, and scale the analysis across many filers or many stocks.
4) What is the difference between raw holdings extraction and the analytics layer endpoints?
Holdings extraction tells you what a manager owned and how much they held at quarter end. Analytics layer endpoints add precomputed metrics like changes in weight, ownership, performance, and holding period, which makes it easier to run consistent comparisons across hundreds of filers without rebuilding the calculations from scratch.
5) What are the main limitations of 13F data that I should account for in my analysis?
13F data is lagged, it does not include shorts, many derivatives, or non-U.S. securities, and it can miss smaller positions. Because of that, it should be treated as a partial view of exposure. The best use is building repeatable research workflows that focus on concentration, change detection, and long-horizon positioning patterns.

Top 5 Defense Stocks to Watch during a Geopolitical Tension
In times of rising geopolitical tension or outright conflict, defense stocks often outperform the broader market as gove...

Circle-Coinbase Partnership in Focus as USDC Drives Revenue Surge
As Circle Internet (NYSE:CRCL) gains attention following its recent public listing, investors are increasingly scrutiniz...

LVMH Moët Hennessy Louis Vuitton (OTC:LVMUY) Financial Performance Analysis
LVMH Moët Hennessy Louis Vuitton (OTC:LVMUY) is a global leader in luxury goods, offering high-quality products across f...

