Assess Refinancing Risk Across Corporate Portfolios Using Financial Statement Data

Debt risk is easy to overstate when analysis starts and ends with total debt.
In a higher-rate environment, the more useful question is not which companies carry debt. Most large public companies do. The better question is whether debt burden is supported by liquidity, free cash flow, interest coverage, and refinancing capacity.
That distinction matters for portfolio and risk teams.
A company with high debt may still have manageable refinancing pressure if cash balances are strong, operating cash flow is stable, and interest coverage remains healthy. Another company with a lower debt balance may still need closer review if cash generation is weakening, liquidity is thin, or debt service is becoming harder to absorb.
This article builds a practical refinancing risk review using Financial Modeling Prep data through Claude MCP. The goal is to move beyond simple debt screening and create a structured way to compare debt burden, liquidity support, cash flow strength, coverage pressure, and similar-company context across a selected list of companies.
The system does not predict defaults or credit events. It also does not replace a debt maturity schedule. It is a refinancing pressure screen, not a full maturity wall model, because actual maturity buckets, covenant terms, and instrument-level debt schedules require additional filing or credit-data review.
FMP APIs Used for the Analysis
Refinancing pressure analysis needs more than one debt number. The review needs data that shows how much debt a company carries, how much liquidity it has, whether the business generates enough cash flow, and whether debt service is becoming harder to absorb.
For this analysis, Claude can use the following Financial Modeling Prep datasets through MCP:
|
Analytical Role |
FMP Dataset |
|
Debt and liquidity position |
|
|
Cash generation and repayment support |
|
|
Leverage and valuation context |
|
|
Coverage and solvency checks |
|
|
Similar-company comparison |
|
|
Sector or industry grouping |
|
|
Historical trend review |
|
|
Maturity-wall limitation |
These datasets do not provide a full debt maturity wall on their own. Actual maturity buckets, instrument-level debt schedules, covenant terms, revolver maturity, and secured versus unsecured debt details require additional review of filings, notes to financial statements, credit documents, or specialized fixed-income data. |
These datasets help the analysis move beyond a simple debt screen. Balance sheet data shows debt, cash, liabilities, and equity. Cash flow statement data shows whether the business can internally support repayment or refinancing needs. Key metrics and ratios add leverage, coverage, and solvency context.
The selected companies should be treated as a portfolio watchlist, not a single clean peer group. Ford and General Motors, Carnival and Royal Caribbean, and Expedia and Booking Holdings operate with different business models, capital structures, and debt profiles. The Company Peers API can provide supporting context within relevant comparison groups, but the model should not treat all six companies as direct peers.
The goal is not to pull every available metric or claim full bond-by-bond debt coverage. The review uses FMP datasets to evaluate refinancing pressure from debt burden, liquidity, free cash flow, leverage, and coverage. It does not retrieve full coupon schedules, covenant terms, revolver availability, secured versus unsecured debt detail, or complete maturity schedules without additional filing or credit-data review.
Why Debt Alone Does Not Show Refinancing Risk
A debt screen can quickly show which companies carry large obligations, but it does not explain whether those obligations are manageable.
This is where refinancing risk becomes more nuanced. A company with high total debt may still have enough cash, operating cash flow, and interest coverage to manage repayments or refinance on acceptable terms. In that case, debt is a balance sheet item, but not necessarily an immediate refinancing concern.
The opposite can also be true. A company with a lower debt balance may still face pressure if cash generation is weakening, liquidity is limited, or interest expense is consuming more of its operating income. In that situation, the problem is not the size of debt alone. The problem is whether the company has enough financial capacity to carry or refinance that debt.
This is why refinancing risk should be reviewed as a relationship between obligations and support. In this model, “obligations” refers to balance sheet debt and debt-service indicators, not a complete debt maturity schedule. If actual near-term maturities are available from filings, debt footnotes, or credit-data sources, they should be reviewed separately before drawing conclusions about maturity-wall risk.
The analysis needs to answer a few practical questions:
- Is the company's debt burden rising?
- Does it have enough cash or liquidity support?
- Is free cash flow strong enough to reduce refinancing dependence?
- Is interest coverage stable or weakening?
- Does the company look weaker than similar companies?
These questions help separate companies that simply use debt from companies where debt may create future refinancing pressure.
Refinancing Risk Framework
The refinancing risk framework reviews whether a company has enough financial support to carry, repay, or refinance its debt obligations.
The goal is not to label every high-debt company as risky. The goal is to separate normal leverage from situations where debt, liquidity, cash flow, and coverage are moving in the wrong direction.
Debt burden
The first step is to review the size of the debt position. Total debt, debt-to-equity, and net debt measures show whether the company is carrying a heavy balance sheet load.
This does not create a risk signal on its own, but it sets the starting point for the review.
Maturity schedule review
A true maturity-wall analysis requires knowing when debt comes due, not only how much debt appears on the balance sheet. Total debt, net debt, and debt-to-equity can show the size of the obligation, but they do not show whether a company faces a concentrated refinancing window in the next one, two, or three years.
If maturity schedule data is not included in the MCP run, Claude should avoid making maturity-wall conclusions. In that case, the output should treat maturity timing as analyst review required and clearly state that debt footnotes, filing disclosures, credit documents, or specialized fixed-income data are needed to review actual maturity buckets.
Liquidity support
The next step is to compare debt pressure with available liquidity. Cash and cash equivalents can reduce refinancing pressure, especially when operating performance remains stable and the company has enough financial flexibility to manage debt service or future refinancing needs. This is why refinancing review often overlaps with working capital and liquidity analysis, where short-term financial flexibility becomes central to the risk assessment.
Thin liquidity increases the need for external financing, asset sales, or tighter capital allocation.
Free cash flow support
Free cash flow shows whether the business can internally support debt reduction or future refinancing needs.
A company with stable free cash flow has more flexibility. A company with weak or negative free cash flow may depend more heavily on capital markets when debt obligations come due.
Interest coverage
Interest coverage helps show whether debt service is becoming harder to absorb.
If interest coverage is stable, the company may still have room to manage higher rates. If coverage is weakening, refinancing pressure can rise even before total debt changes meaningfully.
Comparison with similar companies
The final step is comparison. A company may look leveraged in isolation, but that leverage may be normal for its industry. Another company may look moderate on debt, but weak compared with similar companies. This is where a company peer comparison layer helps separate industry-level leverage from company-specific refinancing pressure.
This comparison helps avoid false signals and highlights names where refinancing pressure appears company-specific.
The framework can classify each company into one of five review categories:
|
Risk Category |
Directional classification criteria |
|
Manageable |
Debt appears supported by liquidity, free cash flow, and interest coverage. The company may still carry debt, but the available indicators do not show clear refinancing pressure under this screen. |
|
Watchlist |
One or more indicators are weakening, such as lower cash flow support, thinner liquidity, rising leverage, or softer coverage. The company does not appear stressed, but it needs continued monitoring. |
|
Stressed |
Debt burden is high and support from free cash flow, liquidity, or interest coverage appears limited. The company may depend more heavily on refinancing access, asset sales, or tighter capital allocation. |
|
Critical |
Multiple indicators point to high refinancing dependence, such as heavy debt burden, weak liquidity, negative or limited free cash flow, and poor coverage support. This category should be used cautiously and only when several signals align. |
|
Review required |
Data is missing, reporting periods are misaligned, or business-model-specific debt makes the comparison unreliable. This category should also be used when maturity schedule data is unavailable but the analysis would require actual maturity-wall conclusions. |
Before assigning a category, the model should check whether balance sheet data, cash flow data, key metrics, and ratios are from aligned reporting periods. If important metrics are missing or inconsistent, the company should be marked as review required instead of forcing a risk label.
Accessing FMP Data Through Claude MCP
Financial Modeling Prep supports access through the FMP MCP Server, which allows Claude to connect with FMP datasets directly through the Model Context Protocol.
In Claude, the setup follows this path:
Settings → Connectors → Add custom connector
After adding the FMP MCP connector, Claude can retrieve financial data from FMP during the analysis instead of relying on manually downloaded files or separate API calls.
Before running the full watchlist, it is useful to validate the setup with one company and one dataset. For example, ask Claude to retrieve the most recent annual balance sheet or financial ratios for Ford Motor Company. This quick check confirms that the MCP connector, API key, reporting period, and expected fields are working correctly before Claude generates the full refinancing risk table.
For this refinancing risk review, Claude can use the connector to pull balance sheet data, cash flow data, key metrics, financial ratios, and peer information. The analyst still controls the review logic. Claude uses the framework defined in the prompt and applies it across the selected companies.
This makes the analysis easier to repeat across a portfolio watchlist. The same setup can be reused to review another sector, sector-paired watchlist, or portfolio list without rebuilding the data collection process each time.
Running the Refinancing Risk Analysis
For this example, the analysis uses a focused portfolio watchlist rather than a broad market screen. A smaller company list keeps the output readable and makes it easier to compare debt burden, liquidity, free cash flow, and coverage quality across different business models.
The selected companies are:
- Ford Motor Company (F)
- General Motors (GM)
- Carnival Corporation (CCL)
- Royal Caribbean Group (RCL)
- Expedia Group (EXPE)
- Booking Holdings (BKNG)
This is a cross-sector watchlist, not a single direct peer group. Ford and General Motors provide an auto-sector pair, Carnival and Royal Caribbean provide a cruise-sector pair, and Expedia and Booking Holdings provide an online travel pair. The goal is to show how refinancing pressure can vary across companies with different business models, capital intensity, debt structures, and cash-flow profiles.
Because the companies are not all direct peers, the analysis should avoid treating all six names as one comparable peer set. Company peer or sector data can support context within each relevant group, but the final interpretation should remain a portfolio-level refinancing pressure review.
|
Use Financial Modeling Prep data through MCP to analyze refinancing pressure across the following portfolio watchlist:
Objective: Use the following FMP datasets where available:
Data rules:
Calculation rules:
Business-model caution:
Maturity schedule limitation:
Start by showing a data table with the following fields:
After showing the data table, compare the companies across these areas:
Classify each company into one of the following refinancing risk categories:
Use the following directional criteria:
For each classification, provide:
Important:
|
Example Claude Output Structure
After Claude retrieves the relevant FMP datasets through MCP, the output can be reviewed in four stages.
A useful MCP output should move from evidence to interpretation: first the complete source metric table, then the classification summary, then company-level rationale, and finally a text-based classification table that readers can review without relying on screenshots.
The first stage is the complete source metric table generated by Claude. It should be reproduced in full, preserving every company, reporting period, metric, calculated value, and missing or unavailable field exactly as returned by the MCP run.
The second stage is the classification summary, which applies the refinancing risk framework to the source metrics and assigns a category, confidence level, and analyst follow-up action to each company.
A useful MCP output should move from evidence to interpretation: first the source metrics, then the classification summary, then company-level rationale, and finally a text-based table that readers can review without relying on screenshots.
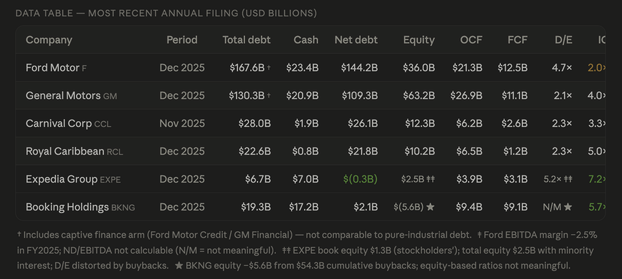
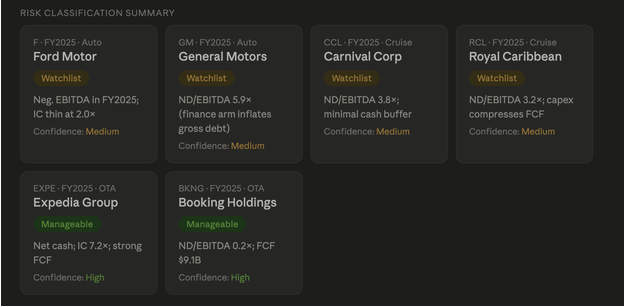
Example MCP output showing refinancing risk classification and most recent annual balance sheet, cash flow, leverage, and coverage fields. Values reflect one MCP run and may change as new filings, restatements, or updated FMP datasets are added.
The third stage is the company-level interpretation. These cards explain why selected companies were classified as manageable or watchlist based on the available indicators.
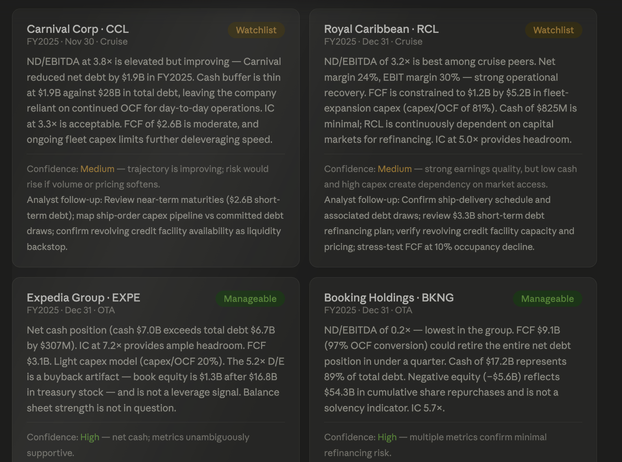
Example company-level interpretation cards showing why selected companies were classified as manageable or watchlist. These cards support analyst review and should not be treated as credit ratings, investment recommendations, or default predictions.
The MCP output can also be summarized in a text-based classification table so readers can review the final result without relying only on screenshots.
|
Company |
Ticker |
Reporting Period |
Total Debt ($B) |
Cash & Equivalents ($B) |
Net Debt ($B) |
Total Equity ($B) |
Operating Cash Flow ($B) |
Free Cash Flow ($B) |
Debt/Equity |
Interest Coverage |
Net Debt/EBITDA |
Missing/Unavailable Fields |
|
Ford |
F |
FY2025 (Dec 31, 2025) |
167.57 |
23.36 |
144.22 |
35.95 |
21.28 |
12.47 |
4.66x |
2.02x |
Not meaningful (EBITDA negative) |
Industrial-vs-finance debt split not available |
|
General Motors |
GM |
FY2025 (Dec 31, 2025) |
130.28 |
20.95 |
109.33 |
61.12 |
26.87 |
11.07 |
2.13x |
4.00x |
5.93x |
Industrial-vs-finance debt split not available |
|
Carnival |
CCL |
FY2025 (Nov 30, 2025) |
27.99 |
1.93 |
26.07 |
12.28 |
6.22 |
2.61 |
2.28x |
3.32x |
3.77x |
Maturity/covenant detail |
|
Royal Caribbean |
RCL |
FY2025 (Dec 31, 2025) |
22.64 |
0.83 |
21.81 |
10.04 |
6.47 |
1.24 |
2.26x |
4.95x |
3.16x |
Maturity/covenant detail |
|
Expedia |
EXPE |
FY2025 (Dec 31, 2025) |
6.67 |
6.98 |
-0.31 (net cash) |
1.28 |
3.88 |
3.11 |
5.19x |
7.23x |
Net cash (-0.11x) |
Debt/equity distorted by buyback-reduced equity base |
|
Booking Holdings |
BKNG |
FY2025 (Dec 31, 2025) |
19.29 |
17.20 |
2.09 |
-5.58 (negative) |
9.41 |
9.09 |
Not meaningful (negative equity) |
5.74x |
0.23x |
Debt/equity not usable due to negative equity |
This table is a watchlist summary, not a ranking. The categories should be read as research labels for follow-up review, not as credit ratings or investment conclusions.
Interpreting the Claude Output
The output should not be read as a ranking based on total debt. Its value comes from separating debt size from refinancing pressure by reviewing liquidity, free cash flow, interest coverage, leverage, and business-model-specific limitations together.
In this MCP run, Ford Motor Company, General Motors, Carnival Corporation, and Royal Caribbean Group were classified as Watchlist with Medium confidence. Expedia Group and Booking Holdings were classified as Manageable with High confidence. These categories are research labels for follow-up review, not credit ratings, default predictions, or investment conclusions.
The source metrics show that each classification is driven by a different combination of financial indicators and analytical limitations.
Ford reports the largest debt and net debt balances in the watchlist, along with debt-to-equity of 4.66x and interest coverage of 2.02x. Its net debt-to-EBITDA ratio is not meaningful because EBITDA is negative. The reported debt also includes financing activities that cannot be separated from industrial debt using the available data. These limitations support a Watchlist classification, but they also reduce confidence in direct comparisons with non-financial operating companies.
General Motors also carries a large reported debt balance. Its operating cash flow, free cash flow, and interest coverage provide more support than Ford's, but net debt-to-EBITDA remains elevated at 5.93x. As with Ford, the available data does not separate industrial debt from financial-services debt. The Watchlist classification therefore reflects both leverage and the need for segment-level debt review.
Carnival and Royal Caribbean both generate positive operating cash flow and free cash flow, and their interest coverage remains positive. However, cash balances are small relative to reported debt, leaving less immediate liquidity support. The source table also does not include maturity or covenant details. Their Watchlist classifications indicate that the available annual metrics do not show critical refinancing pressure, but actual maturity schedules, covenant requirements, and refinancing activity still need analyst review.
Expedia's classification requires a different interpretation. The company has a small net cash position, positive free cash flow, and interest coverage of 7.23x. Its debt-to-equity ratio appears high at 5.19x, but the table identifies that measure as distorted by a buyback-reduced equity base. The Manageable classification should therefore rely primarily on net cash, cash generation, and coverage rather than debt-to-equity in isolation.
Booking Holdings also shows why individual ratios cannot be interpreted without accounting context. Its equity is negative, making debt-to-equity not meaningful. However, the company reports limited net debt, strong free cash flow, interest coverage of 5.74x, and net debt-to-EBITDA of 0.23x. These indicators support the Manageable classification even though the equity-based leverage ratio cannot be used.
The table therefore highlights three important interpretation rules. Headline debt for Ford and General Motors requires separation between industrial and financing operations. Equity-based leverage ratios can be misleading when buybacks reduce equity or push it below zero. Positive cash flow and coverage can support a manageable or watchlist classification, but they do not replace a review of actual maturity schedules.
This is why the classification output is only a starting point. Analysts still need to review debt maturity buckets, covenant terms, revolver availability, secured versus unsecured debt, and recent refinancing activity before drawing stronger maturity-wall conclusions.
The purpose of the model is to prioritize attention. A Manageable classification does not mean that refinancing risk is absent, and a Watchlist classification does not imply imminent credit stress. The output helps identify which indicators support the classification and where additional analyst review is required.
Where Analyst Review Is Still Needed
This review helps identify companies where financial conditions may increase refinancing pressure, but it should not be treated as a default prediction model.
The system can compare debt, liquidity, free cash flow, coverage, and similar-company context. It can also flag companies where the classification depends on missing data, unusual balance sheet structure, or business-model-specific debt. But some refinancing risks still require analyst judgment.
Analysts should review these additional items before drawing stronger refinancing or maturity-wall conclusions. True debt maturity wall analysis requires these details because balance sheet debt and coverage ratios do not show when each obligation comes due.
- Debt maturity schedules by year or maturity bucket
- Secured versus unsecured debt
- Covenant requirements
- Credit ratings and outlook changes
- Revolver availability
- Recent refinancing history
- Management commentary
- Capital market access
- One-time cash flow or restructuring items
This is especially important when the company has complex debt structure. For example, auto manufacturers with captive finance arms may report large debt balances that need to be separated between industrial operations and financing activity. Without that split, the model may overstate or misread refinancing pressure.
The strongest use case for this approach is prioritization. Credit risk teams can use it to identify names that need review. Equity research teams can use it to compare balance sheet pressure across similar companies. Portfolio teams can use it to maintain a refinancing watchlist and refresh the analysis as new financial statement growth data becomes available.
The output should guide analyst attention, not replace analyst judgment.
Using Refinancing Pressure to Prioritize Review
Refinancing risk is not visible from debt alone. It becomes clearer when debt is reviewed alongside liquidity, free cash flow, interest coverage, leverage, and relevant sector context. This type of review can complement broader financial health scoring, especially when teams need a faster screen before deeper analyst review.
Using Financial Modeling Prep data through Claude MCP makes this review easier to repeat across a selected portfolio watchlist. The analyst defines the framework, Claude retrieves the relevant FMP datasets, and the output helps separate companies with supported debt profiles from companies that need closer review.
The classification should be read as a research label for follow-up review, not as a credit rating, default forecast, buy/sell signal, or investment recommendation. It also does not replace filing-level debt maturity analysis, because actual maturity buckets, covenant terms, revolver availability, and instrument-level debt schedules require additional review.
Teams that want to run this type of refinancing pressure screen across larger watchlists can review the available FMP pricing plans based on their data coverage, API usage, and research needs.
The goal is not to predict credit events. The goal is to build a practical refinancing pressure review process that helps analysts focus their attention where balance sheet pressure may be increasing.

Financial APIs, Claude MCP, and AI-driven research workflows
Pranjal Saxena writes technical content focused on financial data APIs, Claude MCP workflows, AI-driven research systems, and Python-based market analysis. For FMP, his work centers on turning structured financial data into practical, workflow-driven content for developers, analysts, and fintech teams. He combines experience in data science, NLP, generative AI, and financial API workflows to show how APIs, automation, and AI-assisted systems can support modern financial research and analysis.
Related



Financial data for every need
Real-time quotes and 30+ years of historical data, including prices, fundamentals, and insider transactions — all accessible via API.
Create Free Account