
FMP
Crossject Société Anonyme
ALCJ.PA
EURONEXT
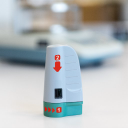
Crossject Société Anonyme develops needle-free injection systems. The company develops ZENEO, a needle-free, prefilled, and single-use auto-injector. Its clinical stage drugs comprise Sumatriptan, which is used for of treatment migraines and cluster headaches; Adrenaline for treating anaphylactic shock; Hydrocortisone that is used for treatment of acute adrenal crisis; Midazolam for treating epileptic seizure; Naloxone used for treatment of overdose; Apomorphine, for treating temporary paralysis in parkinson's disease; Methotrexate used for treatment of rheumatoid arthritis; and Terbutaline, for treating severe asthma crisis. The company was founded in 1997 and is based in Dijon, France.
2.1 EUR
-0.2 (-9.52%)


