FMP
How to Quantify the “Green Premium” Using ESG Scores and Returns
Sep 22, 2025
Is investing in companies with strong ESG scores just a matter of ethics, or does it deliver a measurable financial edge? This is the core question behind the "green premium" debate — the idea that companies with superior Environmental, Social, and Governance (ESG) performance can generate higher returns, lower volatility, or both.
In this article, we'll take a data-driven approach to that question. You'll see a side-by-side comparison of ESG leaders and laggards on returns and volatility, along with a backtested case study. Using simple explanations and charts, we'll show portfolio managers and research analysts how to systematically test whether a “green premium” truly exists.
What is the "Green Premium"?
The "green premium" is the theoretical excess return or lower risk achieved by investing in companies with strong Environmental, Social, and Governance (ESG) performance. The core hypothesis is that ESG factors are not just ethical considerations but material business drivers that lead to better long-term financial results.
The Core Hypothesis
Companies with high ESG scores may have:
- Lower Risk: Better governance and environmental practices can lead to fewer fines, lawsuits, and operational disruptions. This often translates to a more stable stock price and a lower cost of capital.
- Operational Alpha: Strong social and environmental policies can improve a company's brand value, help it attract top talent, and drive innovation in new product categories.
- Investor Demand: A growing pool of capital is dedicated to sustainable investing, which can create a sustained demand for ESG-aligned stocks, potentially driving up their prices over time.
The Analytical Framework: Measuring ESG Alpha
This section outlines a repeatable, three-step process for a systematic analysis of ESG-linked outperformance, avoiding technical coding details.
Step 1: Defining ESG Leaders and Laggards
The first step is to categorize companies into two groups for a fair comparison.
- Method: Use a data API to retrieve ESG scores for a broad universe of companies, like the S&P 500.
- API to use: The ESG Search API provides specific ESG scores (Environmental, Social, Governance) for individual companies. This data is the foundation for classifying companies as either "leaders" or "laggards" based on their scores.
- Context is key: To ensure the comparison is valid, categorize companies relative to their industry. The ESG Benchmark API provides average ESG scores across various sectors, allowing you to define a "leader" as a company with a score in the top quartile of its specific sector, not just the overall market.
Sector-Specific ESG Scores and Benchmarks
ESG performance is not uniform across industries. Companies in a sector like Oil & Gas will face different environmental risks and have a different ESG profile than those in Software. For this reason, it is crucial to use a sector-specific benchmark to evaluate a company's ESG performance.
The data provided by ESG Benchmark API show that each sector has its own average scores for environmental, social, and governance factors.
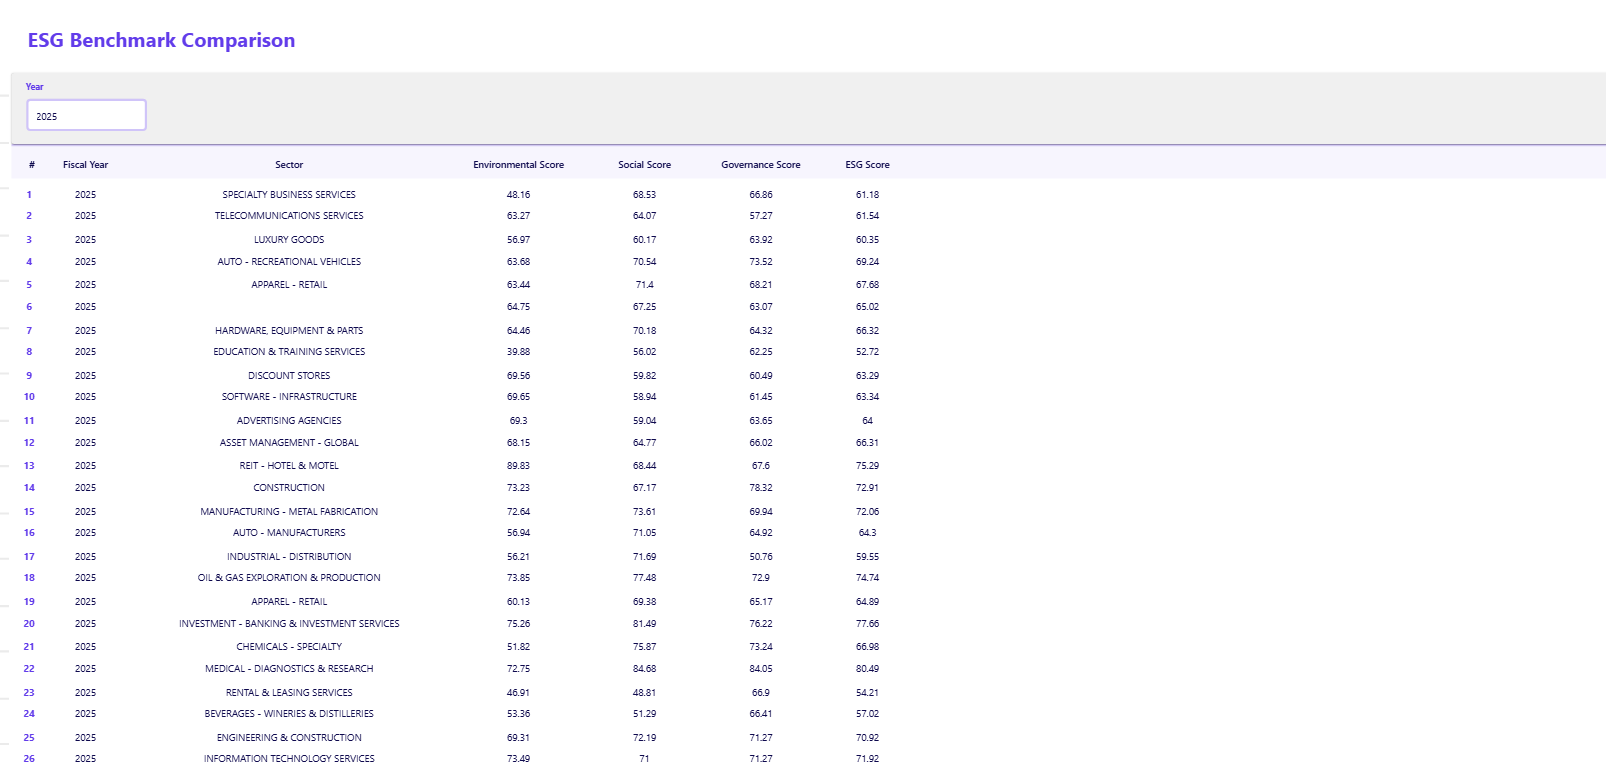
For example, in 2025, the Software sector had an average environmental score of 69.32 and a governance score of 61.45. In contrast, the Luxury Goods sector had an environmental score of 56.97 and a governance score of 69.65. This illustrates that a single, market-wide benchmark would be misleading.
Identifying Leaders and Laggards
Because a company's ESG score must be evaluated relative to its peers, a "leader" or a "laggard" is defined differently in each sector.
- An ESG leader is a company that ranks in the top percentile of its specific industry.
- An ESG laggard is a company that ranks in the bottom percentile of its specific industry.
For example, a score of 65 might be considered an ESG leader in the Automotive sector, but the same score could classify a company as a laggard in the Information Technology sector, where the industry average is much higher.
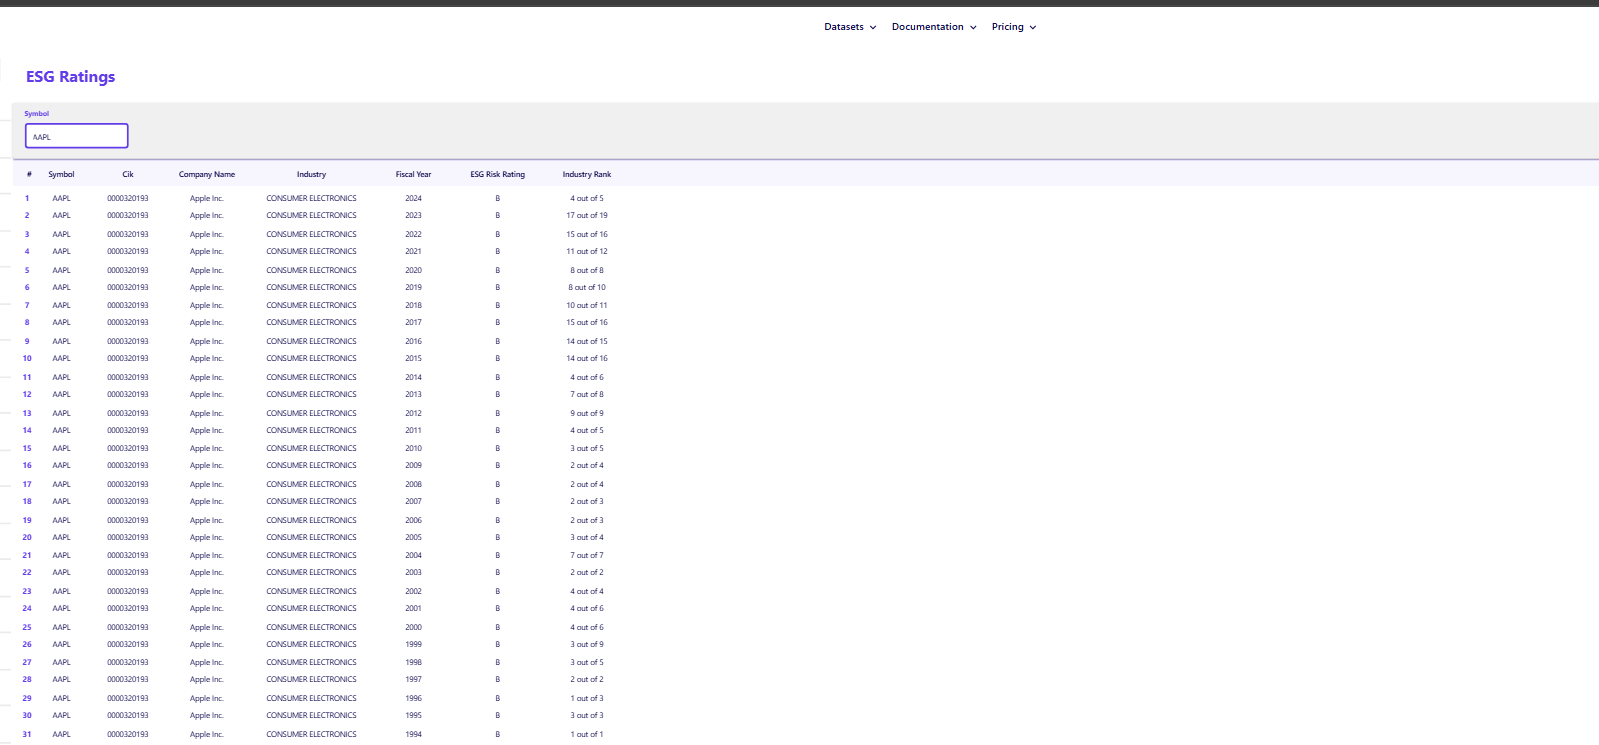
The ESG Ratings API shows Apple Inc. with an ESG risk rating of "B" and an "Industry Rank" of 4 out of 19 in 2024, indicating its specific standing within its industry. This contextual ranking is essential for a fair comparison and for a systematic backtest.
Step 2: Portfolio Construction & Backtesting
Once companies are categorized, two hypothetical portfolios are constructed for a backtested comparison.
- The "ESG Leader" Portfolio: Composed of companies with consistently high ESG scores.
- The "Non-ESG" Portfolio: Composed of companies with consistently low ESG scores.
- Process: The portfolios are analyzed over a significant period (e.g., 5-10 years) to compare their historical performance.
Step 3: Performance Analysis & Visualization
This is where the results are made tangible. Use plain-language explanations and charts to illustrate the findings.
- Chart 1: Cumulative Returns: A line chart showing the total returns of the "ESG Leader" portfolio versus the "Non-ESG" portfolio over the backtest period.
- Chart 2: Volatility Comparison: A bar chart comparing the annualized standard deviation (a measure of volatility) for each portfolio. This shows whether the "ESG Leader" portfolio exhibited less risk.
- Financial Implications: The analysis should focus on what the data means for investors, such as demonstrating quantifiable outperformance or a meaningful reduction in risk.
A Hypothetical Backtest in Action
Before diving into formal research, let's illustrate how this framework works with a simple example.
Imagine a backtest comparing two hypothetical portfolios over five years (2018-2023):
- ESG Leaders Portfolio: Companies in the top 20% of their sector's ESG score.
- Non-ESG Laggards Portfolio: Companies in the bottom 20% of their sector's ESG score.
|
Metric |
ESG Leaders Portfolio |
Non-ESG Laggards Portfolio |
|
Cumulative Return (5-yr) |
48% |
36% |
|
Annualized Volatility |
12.1% |
14.5% |
This simple illustration shows both a "green premium" in returns and a reduction in volatility, providing a clear visual of the framework's potential insights.
Case Study: Academic Research on ESG Alpha
The hypothetical example is supported by real-world academic research.
According to a 2024 S&P Global research paper titled "Charting New Frontiers:
The S&P 500® ESG Index's Outperformance of the S&P 500," the S&P 500 ESG Index has delivered a cumulative outperformance of 17.5% against the S&P 500 since its inception. The paper attributes this outperformance primarily to stock selection rather than sector weighting
[Source: S&P Dow Jones Indices LLC, "Charting New Frontiers," 2024].
This finding provides concrete evidence that a portfolio screened for ESG factors can outperform a standard market benchmark. The fact that the outperformance was driven by stock selection not just being overweight in certain high-performing sectors is a powerful argument for the value of an ESG-integrated investment process.
Strategic Takeaways for Portfolio Managers
The ability to quantify the "green premium" is a critical strategic advantage that transforms theory into an actionable strategy.
- Investment Justification: A backtested analysis provides the verifiable data needed to justify your investment theses. You can use the proven outperformance of ESG leaders to build a powerful case for your strategy with clients.
- Risk Management: The data shows that a focus on ESG can lead to tangible risk reduction. If your analysis demonstrates that ESG leaders exhibit lower volatility, this provides concrete evidence that sustainable investing can lead to a more resilient portfolio.
- Systematic Approach: Move beyond qualitative assumptions by establishing a repeatable framework for analyzing ESG data. This allows you to consistently identify the companies that offer both a return premium and a reduction in risk, creating a competitive advantage.
A Data-Driven Era for Sustainable Investing
While the debate over the "green premium" will continue, the ability to conduct a systematic analysis has never been more accessible. By leveraging modern APIs to test investment hypotheses, portfolio managers can move past speculation and build a repeatable framework to identify and quantify potential ESG-linked outperformance.
Beyond ESG, analysts are now using these same data-driven methods to identify other forms of market alpha, such as post-earnings announcement drift. This allows a holistic approach to creating robust and evidence-based investment strategies.
FAQs
What is a "green premium" in finance?
It refers to the extra return or reduced risk that a portfolio might achieve by investing in companies with strong ESG (Environmental, Social, and Governance) performance.
How do you find ESG scores for companies?
ESG scores can be retrieved from financial data APIs that collect and normalize this information from various providers.2
Does a "green premium" exist in all markets?
No, research on the topic is mixed. The existence and magnitude of a green premium can vary by market, industry, and time period, which is why systematic analysis is crucial.
Why is it important to compare companies within the same sector?
It ensures a fair comparison by accounting for differences in business models and capital intensity across different industries.
How do APIs make this analysis easier?
APIs automate the data collection process, allowing analysts to quickly pull ESG scores and historical returns for thousands of companies, which would be impossible to do manually.3
What is the difference between alpha and a green premium?
Alpha is any return generated in excess of the market benchmark. The "green premium" is a specific type of alpha that is theorized to be driven by a company's strong ESG performance.

WACC vs ROIC: Evaluating Capital Efficiency and Value Creation
Introduction In corporate finance, assessing how effectively a company utilizes its capital is crucial. Two key metri...

BofA Sees AI Capex Boom in 2025, Backs Nvidia and Broadcom
Bank of America analysts reiterated a bullish outlook on data center and artificial intelligence capital expenditures fo...

Pinduoduo Inc. (PDD) Q1 2025 Earnings Report Analysis
Pinduoduo Inc., listed on the NASDAQ as PDD, is a prominent e-commerce platform in China, also operating internationally...

