FMP
How Oil Price Volatility Impacts Airline Stocks: A Data Walkthrough
Oct 03, 2025
In 2008, when crude oil prices surged above $140 per barrel, billions were wiped off airline valuations in weeks. While oil currently trades in the $80-$95/bbl range, this volatility remains the single most critical swing factor. For capital allocators and analysts, oil is the first input to scrutinize in any airline earnings model.
This article examines how oil price volatility directly affects airline stocks—through costs, margins, and ultimately valuations. We'll use real-time commodity data, historical case studies, and an analyst-style walkthrough to show how this sector risk can be modeled with precision, providing strategic depth for CFOs, CIOs, and quant leaders.
Why Oil Prices Matter More to Airlines Than Most Industries
Jet fuel is not just a cost for airlines; it is the dominant variable expense. Typically, it accounts for 20% to 30% of a major airline's total operating expenses. This is why airlines are uniquely exposed to commodity price movements compared to other sectors. For instance, in most heavy manufacturing or logistics industries, energy costs rarely exceed 10% of total operating costs, whereas for airlines, this figure can easily top 30%.
Jet Fuel and Airline Profitability
The unique structure of an airline's cost base magnifies the impact of fuel price changes. CFOs must focus intently on this lever for margin optimization.
- Thin Margins: The airline sector is notorious for its compressed operating margins. When a key input like fuel experiences a cost shock, the margin erosion is magnified, immediately challenging net profitability and debt covenants.
- The Cost Buckets: The three major cost buckets are fuel, labor, and maintenance. Labor and maintenance are relatively fixed in the short term, making fuel the primary driver of quarter-over-quarter EPS (Earnings Per Share) volatility and surprises.
- Limited Flexibility: Airlines face intense fare competition. They often have limited flexibility to raise ticket prices instantly to offset rising fuel costs without impacting passenger demand.
Table: Fuel as a Share of Airline Operating Costs
|
Major Carrier |
Approximate Fuel % of Total OpEx (Pre-Hedging) |
|
Delta Air Lines |
25% |
|
Southwest Airlines |
30% |
|
United Airlines |
23% |
Source: IATA, Company Filings (Note: Figures vary based on fleet age, routes, and crude price levels).
Historical Episodes of Oil Price Shocks and Airline Valuations
Analyzing past crises reveals that oil price shocks rarely act in isolation; their ultimate impact hinges on simultaneous market conditions, particularly passenger demand. This is a critical lesson for Heads of Strategy.
Case Studies in Volatility
- 2008 Oil Spike ($140+/bbl): The surge in oil prices led to immediate operational and financial crises. High fuel costs combined with the onset of the Great Financial Crisis resulted in massive losses, numerous bankruptcies, and industry consolidation. This episode is the defining example of a catastrophic supply-side shock.
- 2014 Oil Collapse (below $50/bbl): The rapid drop in crude became a significant financial tailwind. Since global travel demand remained robust, the sudden cost relief allowed operating profit margins to expand sharply, fueling a multi-year rally in many airline equities.
- 2020 COVID Demand Crash: Oil prices plunged, briefly turning negative, yet airlines still suffered. The unprecedented collapse in travel demand (the demand-side shock) completely offset the fuel cost benefit. Stock prices plummeted as revenue disappeared, demonstrating that weak demand neutralizes the benefit of cheap fuel.
Looking across these episodes, the lesson is that oil shocks rarely act in isolation—demand conditions determine whether airlines sink or soar. A sophisticated strategy team must constantly balance commodity supply risk with macro-economic travel sentiment.
Using Real-Time Commodity Data for Sector Risk Analysis
For CIOs managing sector allocations and Quant Leaders building predictive models, access to instant, reliable commodity data is essential for maintaining E-E-A-T (Experience, Expertise, Authoritativeness, and Trust) in their models.
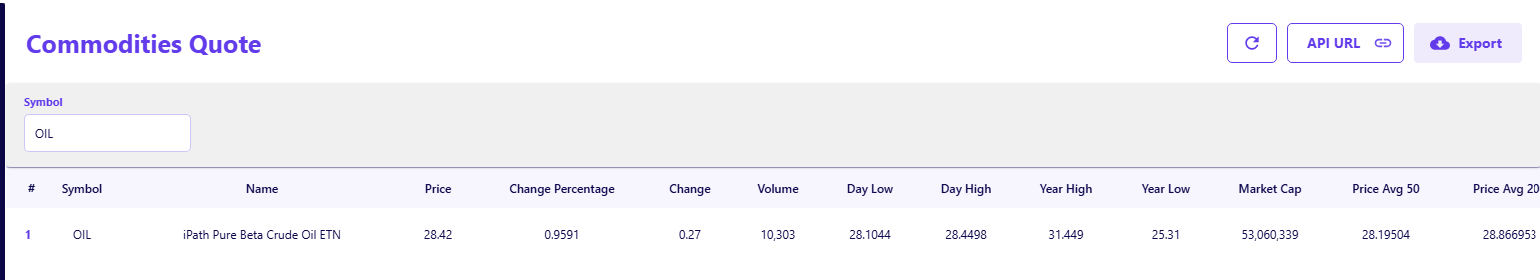
The FMP Commodities Quote Short API provides instant quotes, price changes, and trading volume data—ideal for analysts modeling near-term sector risks and building high-frequency alerts.
Practical Analyst Workflow Example
As of the latest query, the price of the OIL (iPath Pure Beta Crude Oil ETN) is at $28.42. This real-time figure is the base for sensitivity modeling.
- Connecting Price to Costs: Consider a recent scenario where the crude oil price settles at $85 per barrel. Due to conversion and refining spread, this might translate to a jet fuel price of ∼$2.75 per gallon. A carrier like United Airlines might see its non-fuel Cost per Available Seat Mile (CASM) remain constant, but its fuel CASM rises by ∼$0.012 compared to a $75 baseline. This increase, amplified across billions of available seat miles, can quickly translate into a 10-15% erosion in Quarterly EPS forecasts, depending on the carrier's hedging profile. This grounds the API in a practical, repeatable analyst workflow.
Deeper Insights with the FMP Commodities Quote API
The extended FMP Commodities Quote API dataset includes 52-week highs/lows, market capitalization, and daily averages, offering crucial context. Comparing the current spot price of a commodity with its 50-day or 200-day moving average helps analysts identify whether the recent movement is a short-term correction or a significant directional shift that requires a re-pricing of sector risk ahead of upcoming earnings.
Test live oil price signals using the FMP Commodities Quote API to see how shifting costs could immediately alter airline valuation models in your own research environment.
Modeling Airline Earnings Sensitivity to Oil
A 10% increase in jet fuel prices can significantly erode EPS (Earnings Per Share) forecasts for airlines. With operating margins already thin, valuation multiples can compress quickly as investors re-price sector risk and anticipated earnings stability.
Consider the valuation impact: If a consensus forecast assumes $4.00 EPS at stable oil prices, and the oil price rises to a level that cuts projected EPS by 15% to $3.40, an airline stock trading at a 12× forward P/E (Price-to-Earnings) multiple is suddenly trading at a 14.1× multiple. The market will react by lowering the stock price to restore the historical multiple or increasing the risk premium applied to the sector.
How Analysts Build Oil Sensitivity Models
CFOs rely on these models for hedging decisions, while analysts use them for valuation targets.
- Construct Scenarios: Financial analysts establish base, bull, and bear oil price cases (e.g., $80, $90, and $100 crude).
- Model Linkages: They directly link the cost of the commodity input (jet fuel cost) into the airline's detailed cost structure, projecting the change in CASM (Cost per Available Seat Mile).
- EPS Impact: The projected change in cost is used to recalibrate operating income and, subsequently, the forecast for quarterly and annual EPS.
- Multiple Adjustment: Finally, analysts adjust sector valuation multiples based on the modeled EPS impacts and the perceived risk profile to arrive at a target price.
Investment and Strategic Implications for Finance Executives
The data-driven analysis of oil price volatility provides clear, actionable directives for senior finance leaders focused on capital allocation and risk mitigation.
- CFOs (Margin Optimization): Utilize effective hedging strategies and treasury risk controls to stabilize reported earnings and provide margin predictability.
- CIOs (Portfolio Risk): Treat airline stocks as high-beta, cyclical assets. Adjust sector allocations dynamically based on real-time commodity data and macro demand signals.
- Strategy Heads (Competitive Positioning): Assess competitive advantage based on rivals' hedging sophistication and fleet fuel efficiency to anticipate market share movements during oil shocks.
- Quants (Data Signals): Measure the correlation between oil futures (e.g., Brent or WTI) and specific airline stock returns to refine risk-adjusted return calculations. For a deeper understanding of factor-based analysis, Quant Leaders often utilize models that backtest portfolio performance using earnings surprises to isolate true alpha signals.
Capital Allocation and Commodity Risk
Oil remains the dominant swing factor for airline earnings and valuations. With access to real-time commodity data and the ability to construct structured sensitivity models, finance executives can anticipate margin shifts and valuation risks before the wider market fully prices them in. Integrating robust commodity tracking into your sector analysis provides a sharper, faster decision-making edge.
Explore additional financial datasets on FMP to deepen your sector analysis and integrate new predictive signals into your investment models.
FAQs
Why do oil prices impact airline stocks so heavily?
Fuel is the largest variable cost, typically making up 20% to 30% of operating expenses. Given the industry's thin margins, small price movements ripple directly into profitability and, consequently, stock valuations.
How can analysts track oil price changes in real time?
By using the FMP Commodities Quote Short API to monitor price swings, trading volume, and volatility instantly, which aids in high-frequency risk modeling and scenario testing.
Do airlines hedge fuel costs effectively?
Hedging is a common practice used to provide cost stability and predictability, but it is typically partial. Contracts are time-bound, leaving carriers exposed to spot market volatility when contracts roll over.
What happened to airlines during the 2008 oil spike?
Margins collapsed due to high fuel costs. This, combined with the financial crisis, led to massive losses, bankruptcies, and a wave of industry consolidation.
Is cheap oil always good for airline stocks?
No. While cheap fuel lowers costs, a rapid decline in oil prices often signals weaker global economic activity and reduced travel demand, which can ultimately offset the cost savings.
How do quants measure oil's impact on airlines?
They run time-series regressions on oil futures against airline stock returns to calculate an oil beta—a key metric for measuring the stock's systematic risk exposure to commodity price changes.
What's the best API for commodity and sector risk analysis?
The FMP Commodities Quote Short API delivers concise, real-time quotes, while the full FMP Commodities Quote API provides extended data points and historical averages for deeper, contextual risk modeling.

How an Economic Moat Provides a Competitive Advantage
Introduction In the competitive landscape of modern business, companies that consistently outperform their peers ofte...

Apple’s Slow Shift from China to India: Challenges and Geopolitical Risks
Introduction Apple (NASDAQ: AAPL) has been working to diversify its supply chain, reducing dependence on China due to...

MicroStrategy Incorporated (NASDAQ:MSTR) Earnings Preview and Bitcoin Investment Strategy
MicroStrategy Incorporated (NASDAQ:MSTR) is a prominent business intelligence company known for its software solutions a...