FMP
How to Calculate Post-Fee Alpha & Predict Manager Skill: Mutual Fund vs. Active ETF Due Diligence
Oct 17, 2025
An overwhelming 86% of active U.S. large-cap equity funds underperformed the S&P 500 over the past 10 years, according to SPIVA. For finance executives tasked with optimal capital allocation, this statistic demands rigorous scrutiny: is the premium fee of an actively managed mutual fund justifiable when stacked against the structural and cost advantages of an actively managed ETF?
This analysis moves beyond superficial trailing returns, providing a professional framework for dissecting the true alpha (post-fee, post-tax) of active strategies. We guide CIOs, quant leaders, and senior analysts through the multi-factor analysis required to isolate verifiable manager skill, leveraging transparent data for superior manager due diligence and portfolio construction.
Deconstructing Post-Friction Alpha: The True Cost of Active Management
The premise of active management rests on a fund manager's ability to generate alpha excess return relative to the market benchmark, adjusted for risk. However, the value of that alpha is eroded by layers of friction, often making the investment proposition untenable for a discerning financial executive focused on margin optimization.
For a meaningful comparison of a Mutual Fund vs. ETF, you must calculate Post-Friction Alpha, which considers three critical cost layers beyond the published performance data:
- Explicit Cost (Total Expense Ratio - TER): The obvious annual fee. A high TER creates a significant headwind against the passive benchmark.
- Implicit Trading Costs: Costs generated by high portfolio turnover, including brokerage commissions, the bid-ask spread, and market impact cost (the price change caused by the trade itself). These costs are not included in the TER but are netted from the fund's assets.
- Tax Drag (Capital Gains Distributions): The unique structure of most mutual funds forces them to distribute realized capital gains to shareholders, creating an immediate tax liability in taxable accounts.
Post-Friction Alpha=Fund Return−TER−Trading Costs−Tax Drag−Benchmark Return
The primary advantage of the actively managed ETF structure is its efficiency in mitigating implicit trading costs and, crucially, tax drag. Active ETFs often utilize an in-kind creation/redemption mechanism where shares, not cash, are exchanged, dramatically limiting the taxable capital gains passed to investors. For a CFO modeling long-term, taxable institutional wealth, this structural difference presents an undeniable advantage.
Quantifying Hidden Transaction Costs
To assess the implicit friction, analysts must meticulously analyze a fund's Turnover Ratio alongside its expense ratio. A high turnover fund incurs greater trading costs, directly eroding net asset value (NAV).
- Low Turnover: Suggests a buy-and-hold philosophy, minimizing implicit costs.
- High Turnover (e.g., >100%): Can consume an additional 0.5% to 1.5% of assets annually in hidden transaction costs, forcing the manager to clear a much higher performance hurdle.
Manager Due Diligence: Isolating Skill from Market Luck
The core task of a CIO or Head of Strategy is to determine if an active manager's outperformance stems from true, repeatable skill or merely favorable factor tilts or luck during a specific market cycle. Manager due diligence requires a multi-factor regression analysis, moving well beyond the basic single-factor CAPM (Capital Asset Pricing Model) to isolate the idiosyncratic alpha.
Metrics That Predict Persistent Manager Skill
- Information Ratio (IR): This metric is superior to the Sharpe Ratio for evaluating active managers. It measures the fund's excess return (alpha) relative to its tracking error (the volatility of the difference between the fund's return and its benchmark's return).
- IR > 0.5: Indicates decent skill.
- IR > 0.75: Suggests high skill with persistent outperformance.
- Active Share and Concentration: An actively managed fund must have a high Active Share (the percentage of its holdings differing from the benchmark) to justify its fees. High Active Share combined with a high R-squared (the percentage of a fund's movements explained by the benchmark) is an immediate red flag for closet indexing.
- Investment Style Consistency: Did the fund achieve alpha through consistent factor exposure (e.g., a sustained value tilt) or through genuine, stock-specific selection? Inconsistent style or style drift often signals a reactive, rather than strategic, process.
Vetting Manager Stability and Strategy Changes
Predictive analytics demand data integrity, and a manager's track record is only relevant if the team and strategy remain consistent. A change in the lead portfolio manager often renders historical performance obsolete.
To vet managerial continuity, a senior analyst can leverage the Mutual Fund & ETF Disclosure Name Search API. This API allows the analyst to cross-reference the current portfolio manager's name against past and current regulatory filings. Analyst can use this to find the fund and then delve into manager turnover, historical performance against its true benchmark (not just the S&P 500), and fund strategy changes.
The Active ETF Structural Edge: Transparency and Risk Management
The modern active ETF is not merely a wrapper; it is a superior vehicle for active management, offering benefits that directly enhance portfolio risk management and data signals for a quant lead.
The structural advantages of the active ETF, which mitigate the primary drags on Mutual Fund vs. ETF performance, are numerous:
- Transparency: Most active ETFs disclose their holdings daily or near-daily, offering immediate insight into the manager's current positioning. This transparency is a powerful tool for risk management, allowing an investor to monitor exposures in real-time and model their impact on the broader portfolio.
- Liquidity: Active ETFs trade continuously on an exchange, offering intraday liquidity and price discovery that is unavailable to traditional mutual funds, which only price once daily at the market close.
- Tax Efficiency: As noted, the creation/redemption mechanism reduces the liability of capital gains distributions, dramatically improving after-tax alpha for a taxable account.
For a quant lead building sophisticated risk models, the transparent holding data is paramount. The ability to model the exact exposure of a fund's portfolio is a significant edge. Using the FMP ETF Asset Exposure API, for example, you can instantaneously retrieve the underlying asset breakdown (e.g., sector weighting, country exposure, fixed income duration) of thousands of active ETFs.
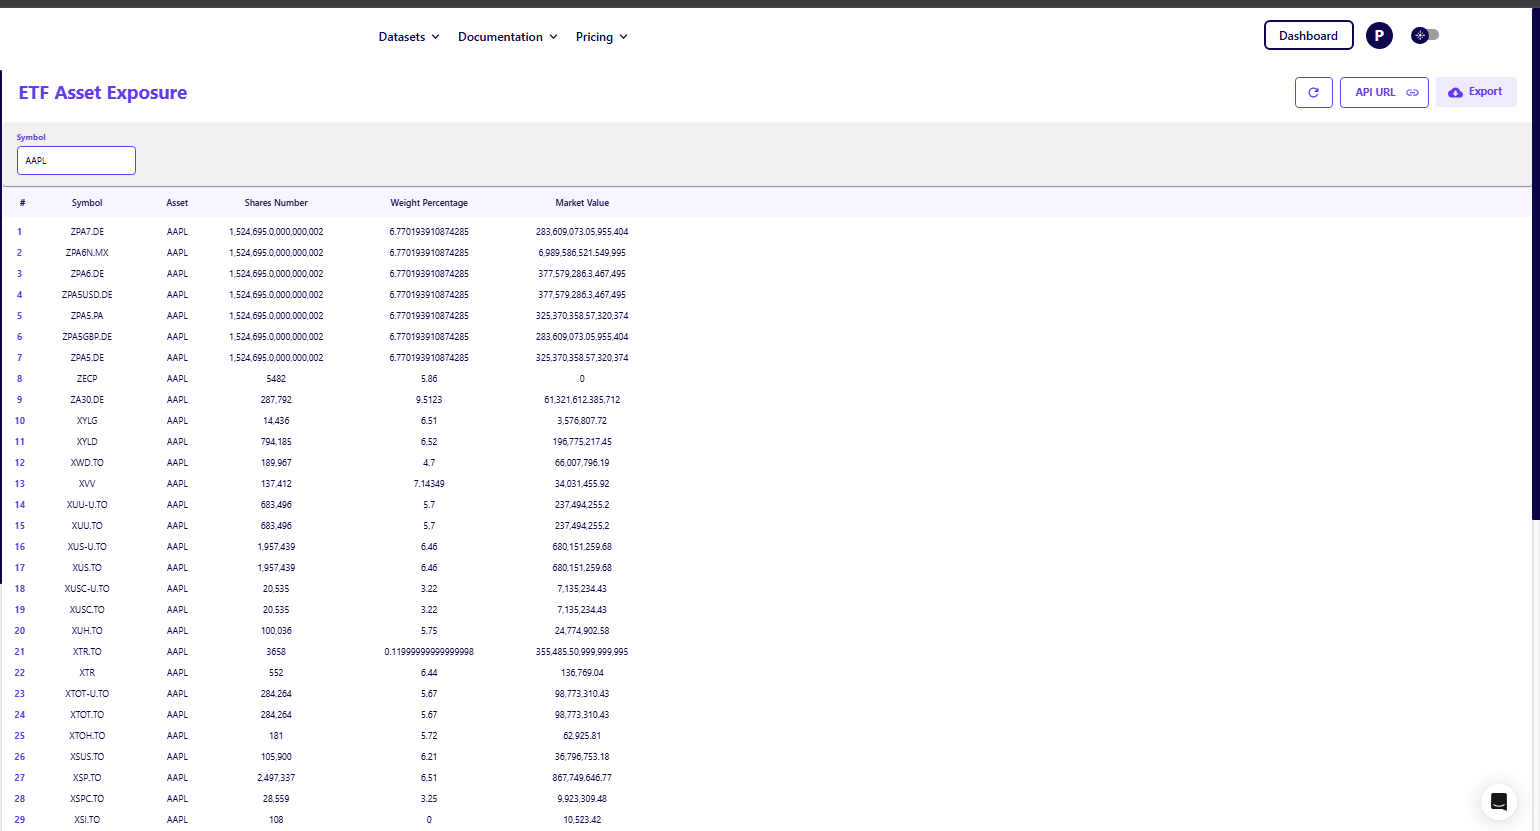
This real-time visibility allows for high-precision predictive analytics and avoids the blind spots inherent in delayed mutual fund disclosures.
Liquidity risk is another dimension of due diligence transparency helps mitigate. For concentrated, high-conviction strategies, a CIO must assess whether the fund's large positions can be liquidated without causing market impact.
A lack of transparent holdings can mask hidden liquidity risks in the underlying balance sheets of the companies held, making it impossible to model the impact of mass redemptions. Elite analysts go beyond simple portfolio risk to scrutinize the corporate balance sheet, focusing on assets and liabilities that signal potential illiquidity, a critical layer of risk management often overlooked until a crisis hits.
Strategic Allocation: Optimizing the Mutual Fund vs. ETF Mandate
The decision to allocate capital to an actively managed product whether a Mutual Fund vs. ETF must align with specific strategic and regulatory imperatives.
Actionable Framework for Allocation
|
Imperative |
Best Vehicle |
Rationale for Selection |
|
Taxable Accounts |
Active ETF |
Superior tax efficiency; no forced capital gains distributions. |
|
High-Conviction, Low-Turnover Strategies |
Either (with Low ER) |
Manager skill is the focus; low implicit trading costs. |
|
Tax-Deferred Accounts (e.g., 401k) |
Active Mutual Fund |
Tax efficiency is irrelevant; only focus on Post-Fee Alpha and manager skill. |
|
Real-Time Risk Monitoring |
Active ETF |
Daily holding transparency allows for intraday risk calculations. |
The key takeaway is that the active Mutual Fund vs. ETF decision is now driven by structure, not strategy.
Structural advantages particularly cost and tax efficiency favor the active ETF wrapper in almost all instances, especially for institutional and high-net-worth taxable portfolios where minimizing tax drag is an imperative. For a CFO, the consistent, structurally lower operating costs of an active ETF directly translate into higher net investor ROI and improved cost control.
Data-Driven Edge in Active Investing
The debate is settled: the burden of proof for the active manager to generate alpha has never been higher. For financial executives, a superficial review of historical returns is no longer sufficient. You must employ a rigorous, multi-factor analysis to calculate Post-Friction Alpha and isolate the true, persistent manager skill.
The active ETF structure has emerged as the superior, more efficient vehicle, offering lower costs, greater transparency, and unmatched tax efficiency. By leveraging granular data and API tools like FMP's, you move from relying on historical luck to predicting future performance based on verifiable manager actions and structural advantages.
Refine your firm's due diligence process. Integrate manager stability and portfolio exposure data directly into your analytical models. Deepen your firm's research on active fund holdings and strategies by exploring the extensive FMP API dataset for granular, security-level insight into manager positioning.
Frequently Asked Questions (FAQs)
What is the primary cause of tax drag in actively managed mutual funds?
The primary cause of tax drag is a mutual fund's requirement to distribute all realized capital gains to shareholders. When a manager sells an appreciated security, the resulting gain is distributed, creating a taxable event for the shareholder, even if they never sold their fund shares.
How does the Information Ratio differ from the Sharpe Ratio in manager evaluation?
The Sharpe Ratio measures a fund's excess return against its total risk (standard deviation). The Information Ratio measures the fund's excess return (alpha) against its active risk (tracking error). The IR is better for evaluating active managers because it focuses only on the risks taken relative to the benchmark, effectively quantifying the manager's active decision-making skill.
What is an "in-kind creation/redemption" and why is it important for active ETFs?
An in-kind creation/redemption is a transaction method where an ETF exchanges the underlying securities, not cash, with authorized participants (APs). This process generally avoids triggering a sale of appreciated assets at the fund level, which is why active ETFs can minimize or entirely avoid the capital gains distributions that plague mutual funds.
What does a low Active Share coupled with a high R-squared indicate?
It is a strong indication of closet indexing. A low Active Share means the portfolio is very similar to its benchmark. A high R-squared means its returns are highly correlated with the benchmark. Together, these metrics suggest the fund is charging high active fees for what is essentially a passive, index-like exposure.
Why is manager tenure and turnover data critical for predictive analytics?
Historical performance data is only relevant if the person or team responsible for those returns remains in place. High manager turnover renders past performance data unreliable for predictive analytics because the investment philosophy and execution can fundamentally change overnight.
Does the Mutual Fund & ETF Disclosure Name Search API provide real-time manager information?
The Mutual Fund & ETF Disclosure Name Search API provides highly timely information by tracking regulatory filings (e.g., N-PORT, Form 4) associated with fund managers and insiders. While it reflects the data available in the most recent public filing, this is generally the quickest way to verify official manager status, strategy changes, and insider activity outside of basic fund websites.
Which FMP API plan is required for deep-dive institutional due diligence and high-volume data access?
For rigorous institutional due diligence, specifically requiring ETF and Mutual Fund Holdings, and high API call volumes (up to 3,000 API Calls/Min), the Ultimate Plan is generally necessary. While the Basic and Starter plans offer foundational market data, the comprehensive detail required for advanced tasks like real-time portfolio analysis and enterprise data integration is consolidated within the Ultimate tier. You can compare the features and data access across all plans to align with your specific needs.

Apple’s Slow Shift from China to India: Challenges and Geopolitical Risks
Introduction Apple (NASDAQ: AAPL) has been working to diversify its supply chain, reducing dependence on China due to...

MicroStrategy Incorporated (NASDAQ:MSTR) Earnings Preview and Bitcoin Investment Strategy
MicroStrategy Incorporated (NASDAQ:MSTR) is a prominent business intelligence company known for its software solutions a...

WACC vs ROIC: Evaluating Capital Efficiency and Value Creation
Introduction In corporate finance, assessing how effectively a company utilizes its capital is crucial. Two key metri...