FMP
How to define investor confidence through US treasuries and one amazing bond trading strategy.
Jul 15, 2024(Last modified: Nov 18, 2025)
Investor confidence towards the stock market depends on many factors, including macro trends, larger companies' financial reports, corporate actions, and the cost of money. While it is clear for many investors how to track the dependency between corporate reports, macro and micro factors, and stock prices (the better the data, the more confidence it can bring to the stock market), it may be confusing for some investors to use the cost of money and US treasuries as an indication of confidence. Today, we will consider how to define investor confidence through the cost of money and examine the US treasury yield curve for that. Because the US treasury yield curve reacts directly to the cost of money and reflects rising or falling costs, it also mirrors investor confidence. First, we will examine the US treasury yield curve and explain how to read it properly to assess the health of the US stock market and investor confidence. In the second part, I will show you amazing bond trading strategy that you can get by analyzing the US treasury yield curve. Let's start.
We will be using the Financial Modeling Prep Treasury Rates API to access the US treasury yield curve. You can download US treasury yields to Google Sheets, Excel, or use your custom code, fetch the data, and build the graph. You need the graph to see visually how the US treasury yield curve changes. To plot the graph, take treasury yields against their maturities. After plotting the graph, you will have something like this.
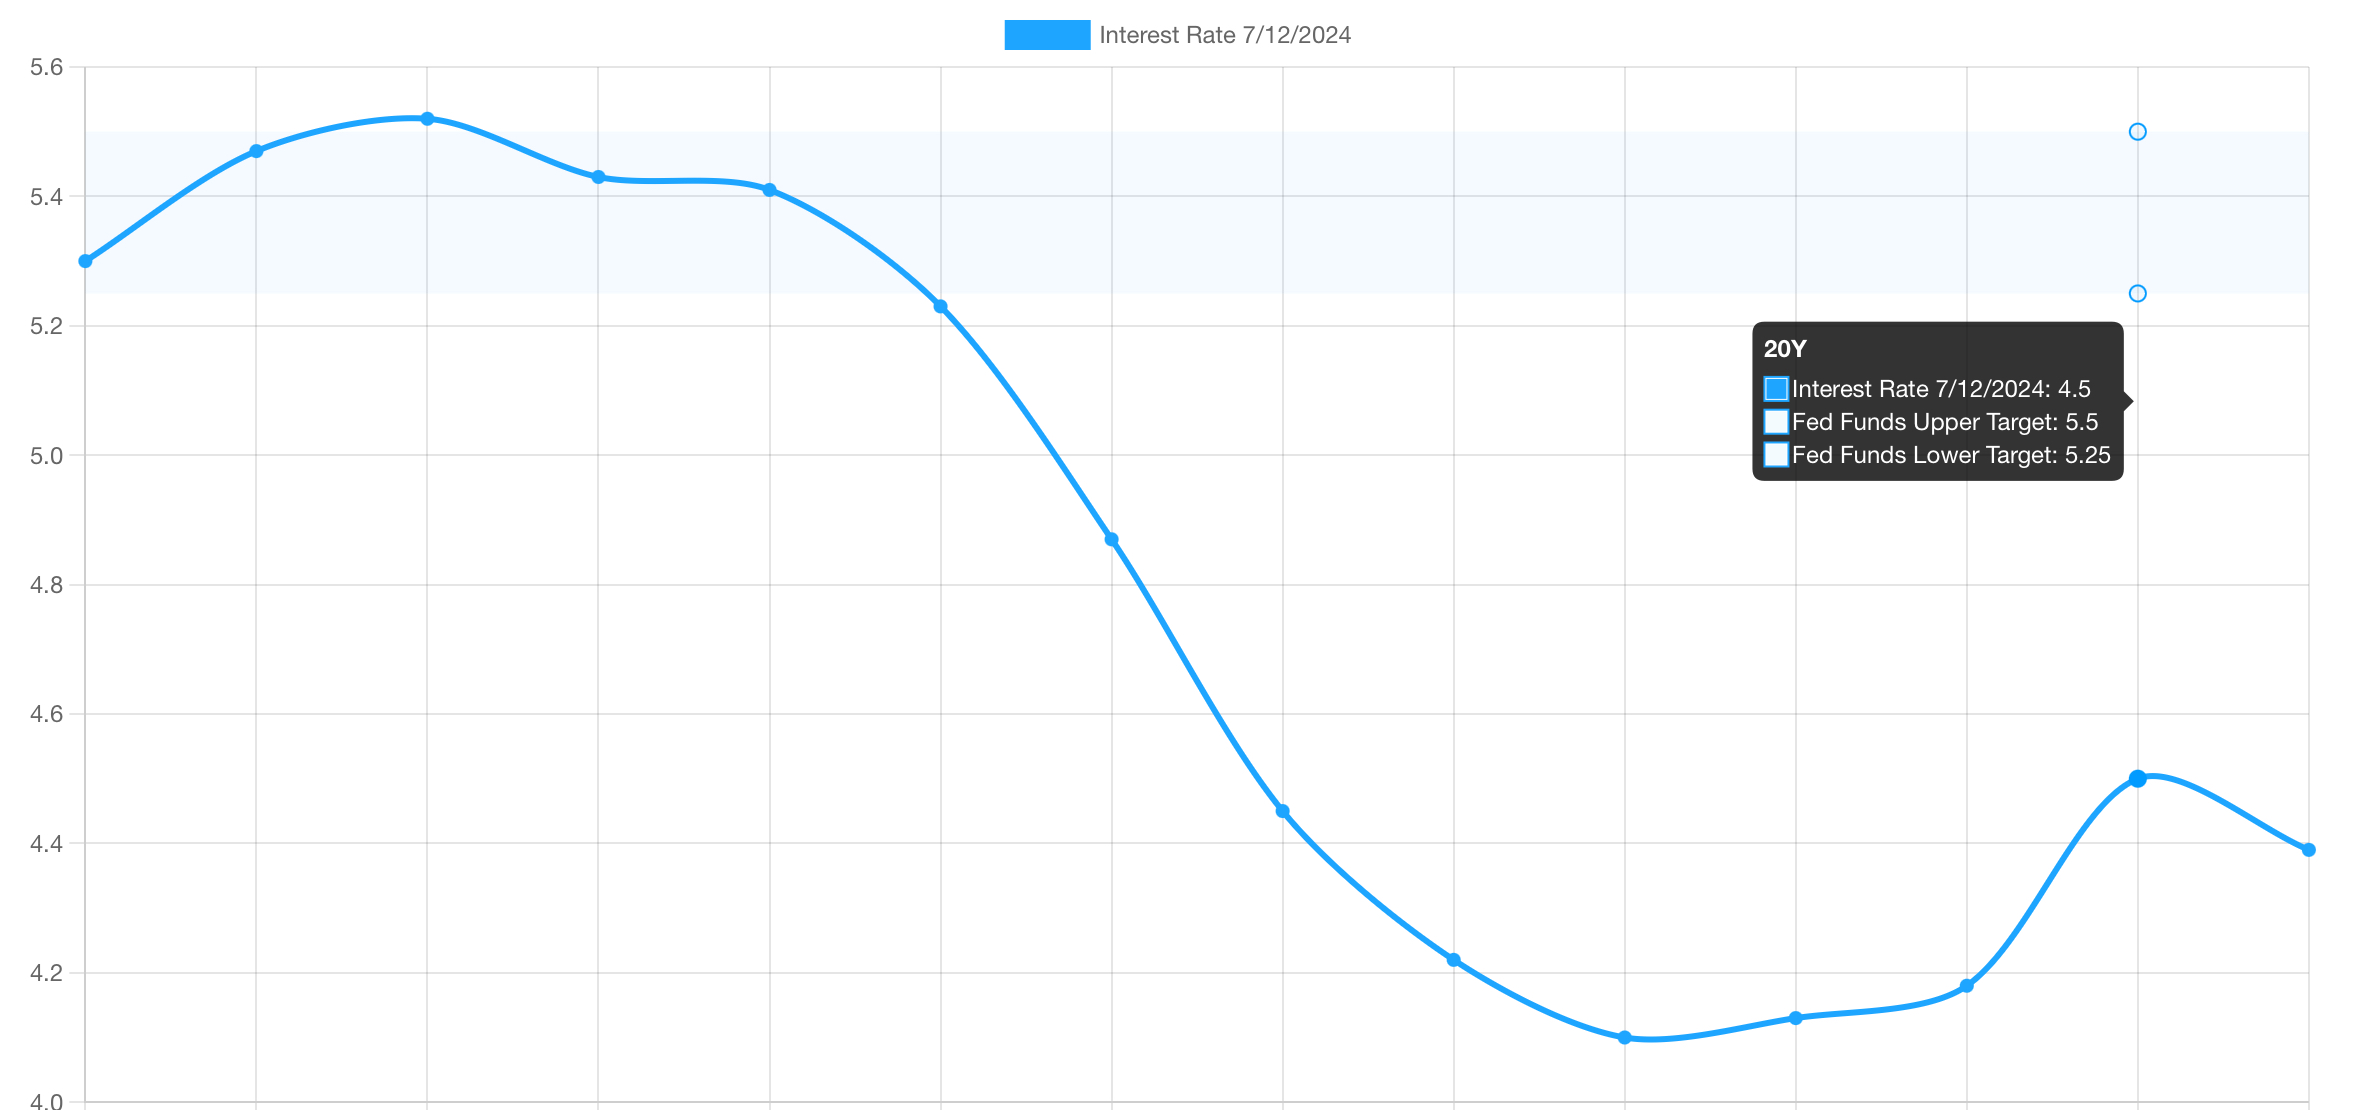
Analyzing the US treasuty yield curve.
You can have three different variations of the graph:
1. Normal yield curve: where the shorter-term yields are smaller than the longer-term yields.
2. Horizontal curve: where shorter-term yields are equal to longer-term yields.
3. Inverted yield curve: where the shorter-term yields are higher than the longer-term yields.
When investor sentiment is high and the economy is doing well, the stock market is rising confidently, and the US treasury yield curve is normal. This is because investors see higher risks in the future than now, and it is reflected in the yield. When the economy has problems, for example, rising inflation, the central bank decides to increase interest rates to absorb excess liquidity from the market and motivate people to save more money. That's where the market conditions become tough. Then the yield curve may become inverted. When the yield curve is inverted, investors see more risks now than in the future and require a higher premium for buying more risky assets now. This is where the US treasury shorter-term bonds are trading with more discount (higher yield). And speculative capital prevails on the stock market as investors find it expensive to borrow funds to invest in stocks for the longer term, and many people prefer shorter-term trades as high pessimism may lead to a stock market correction anytime. And when the US treasury curve is flat, it can tell that investors are waiting and not sure what direction the stock market may take. Investors have not decided yet, and risks are equally distributed across different maturities.
For example, as of the 15th of July 2024, the US treasury yield curve is inverted, given the high cost of money on the money market, and investors are expecting a stock market correction as many stocks look overvalued, and speculative capital prevails on the market. Investors bear higher risks now, and this is reflected in the US treasury yield curve. The confidence is low. But when the cost of money decreases, investors have more funding options, resources become cheaper, companies can borrow more money on development, which can have a direct positive effect on their production and profits. This will boost stock growth and increase investor confidence. Investors start requiring less premium and are willing to invest more in the shorter term. Monitor the US treasury yield curve quarterly/yearly and see how it changes as its slope gives you valuable hints on when the investor sentiment changes.
Bond trading strategies.
Now that you know how to track investor confidence, let's consider possible bond trading strategies. You will need the same data points as before: the US Treasury Rates API. Now extract the yields for 2-year US treasury and 10-year US treasury. You will need to extract 2Y and 10Y yields one year ago and now. When you use the Financial Modeling Prep data point, you can define the range; just make sure you extract yields now and 12 months ago to monitor how those yields changed. You should have the same table as shown in the picture below
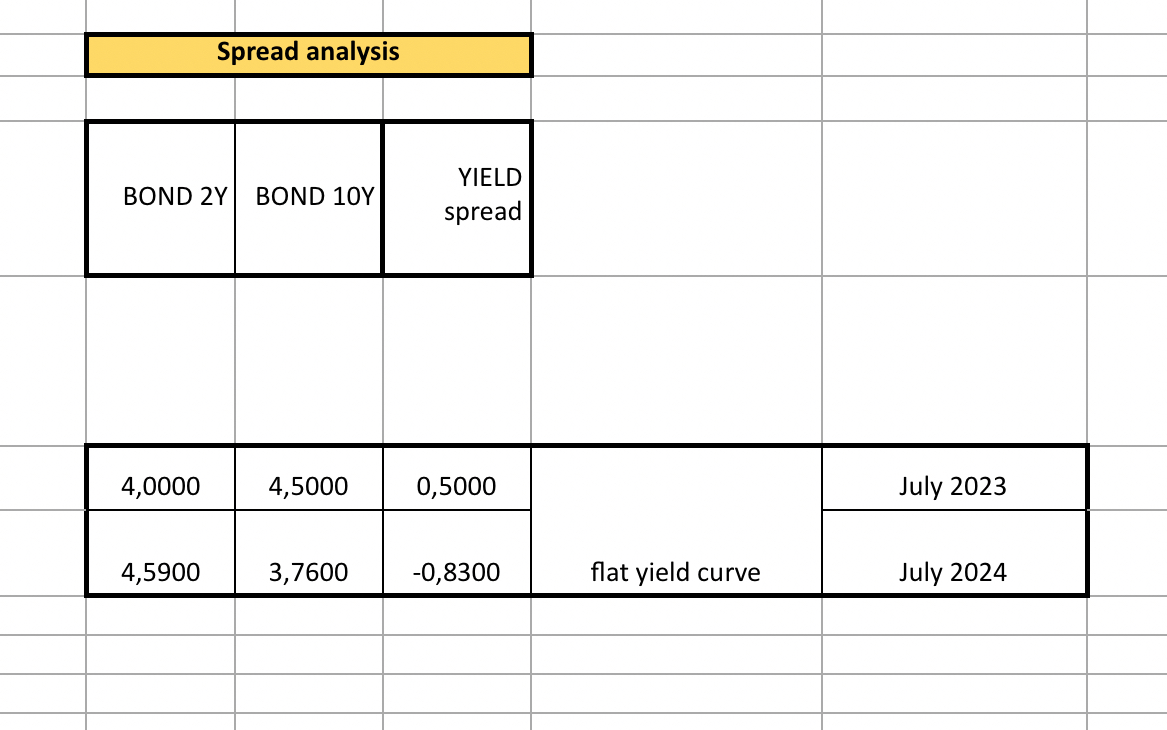
First, you extract the 2Y yield (for July 2023), then you extract the 10Y treasury yield (for July 2023), which is 4% and 4.5%, respectively. Then you do the same but for July 2024, which is 4.59% and 3.76%, respectively. Then you calculate the yield spread, the difference between 2Y and 10Y bonds in July 2023, and do the same for July 2024 (10Y yield - 2Y yield), which is 0.5 and -0.83 in our example. If the July 2024 yield spread is higher than the 2023 yield spread, then a good bond trading strategy would be to buy longer-term bonds and sell shorter-term bonds because the spread difference will narrow in the future. If the 2023 (previous year) spread is higher than the current year spread, then a good trading strategy would be to buy shorter-term bonds and sell longer-term bonds because the spread between longer and shorter bonds will grow. As in our current example, the current 2024 spreads are lower than the previous year's spread, which means that a good strategy would be to buy shorter-term bonds and sell longer-term. And indeed, the yield curve will be inverting back to normal soon as soon as rates start declining (the cost of money), and the price of the shorter-term bonds will grow while the longer-term bond prices will decline.
I hope my explanations were clear. Now you can use Financial Modeling Prep Treasury Rates API to come up with great bond trading strategies and monitor the health of the stock market and see when it will be improving.

MicroStrategy Incorporated (NASDAQ:MSTR) Earnings Preview and Bitcoin Investment Strategy
MicroStrategy Incorporated (NASDAQ:MSTR) is a prominent business intelligence company known for its software solutions a...

WACC vs ROIC: Evaluating Capital Efficiency and Value Creation
Introduction In corporate finance, assessing how effectively a company utilizes its capital is crucial. Two key metri...

BofA Sees AI Capex Boom in 2025, Backs Nvidia and Broadcom
Bank of America analysts reiterated a bullish outlook on data center and artificial intelligence capital expenditures fo...

