FMP

FMP

Enter

Before we jump to EPS extraction, let me explain what it is and why EPS is important. Then I will show you how to extract company EPS data, including estimates

EPS

EPS estimates

earnings

company earning

stock market

market app

web application

How to extract company EPS estimates, what they are, and why they are important.

-

twitterlinkedinfacebook
blog post cover photo

Image credit: social sentiment

Before we jump to EPS extraction, let me explain what it is and why EPS is important. Then I will show you how to extract company EPS data, including estimates and actuals, as well as the company's expected report dates. So, let's see what EPS is.

EPS, or earnings per share, is a company's net income divided by the average number of shares outstanding. EPS indicates a company's profitability by showing how much profit (or earnings) is generated for each outstanding share of its common stock. Higher EPS values generally indicate greater profitability. EPS allows investors to compare the profitability of different companies within the same industry or sector. By comparing EPS values, investors can assess which companies are more profitable relative to their peers. Investors also compare forecasted to actual EPS, and if a company posts better than expected data, its share price can go upwards as higher EPS (EPS surprise) shows rising investor confidence. Now let's see how you can extract EPS data.

In my previous articles, I showed you how to extract stock target price and how to extract social sentiment. Read these articles before you start reading the text below. This is important because I am building a fully functional web-based application and adding functionality, and today's article is the third part towards a fully functional app. During today's coding session, you will see how to extract earnings data, but the old code will also remain (from previous articles), which is why it is important to read those articles too. Also, before we start extracting data, let me make some changes to the design first. The code will continue from the earlier articles, so read them to get the code and understand how to download VSCode.

Let's start by adding some of the designs. As you can see, this is the old code from the previous article. Pay attention to the elements that I marked in red and green. I have added classes and assigned names to them, such as

, <div id="socialSentiment">
, and
. Put the old code between the div elements. Copy the code below to your existing HTML file. If you remember, we named the file 'Demo endpoint.html.

Now let's add some design to our app so it will look better. I will be writing styles in the same HTML file. Just add between the head tags, right below Stock Target Price as shown in the picture, and put the design code between the style tags. This is the design code:

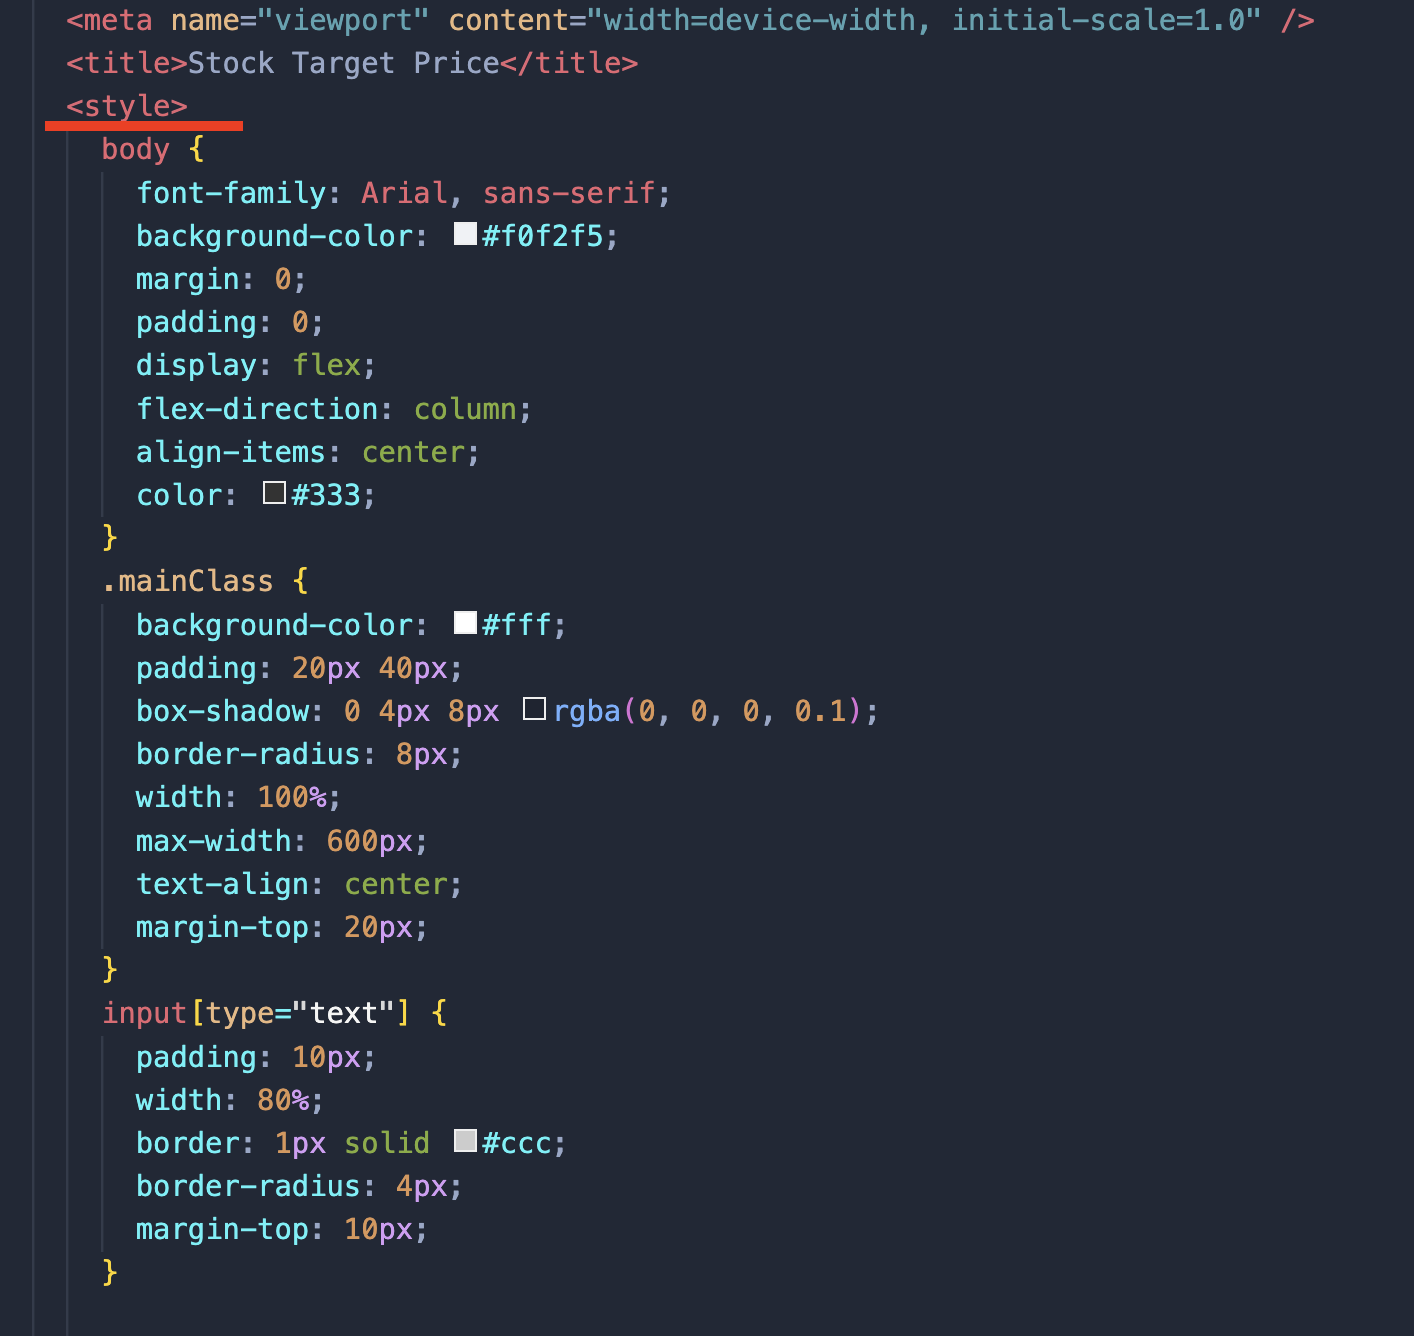
and also paste the following below:

button: hover {background-color: #0056b3;}

h1 {color:#007bff;

margin-top: 20px; font-size: 24px;}

  • targetPrice,
  • socialSentiment {
    background-color: #fff; padding: 20px 40px;
    box-shadow: 0 4px 8px Orgba(0, 0, 0, 0.1); border-radius: 8px; width: 100%; max-width: 600px; text-align: center; margin-top: 20px;}

label {font-size: 16px; font-weight: bold;}

After updating the HTML file, save everything and drag the HTML file to the open browser window. Your updated app should look nicely.

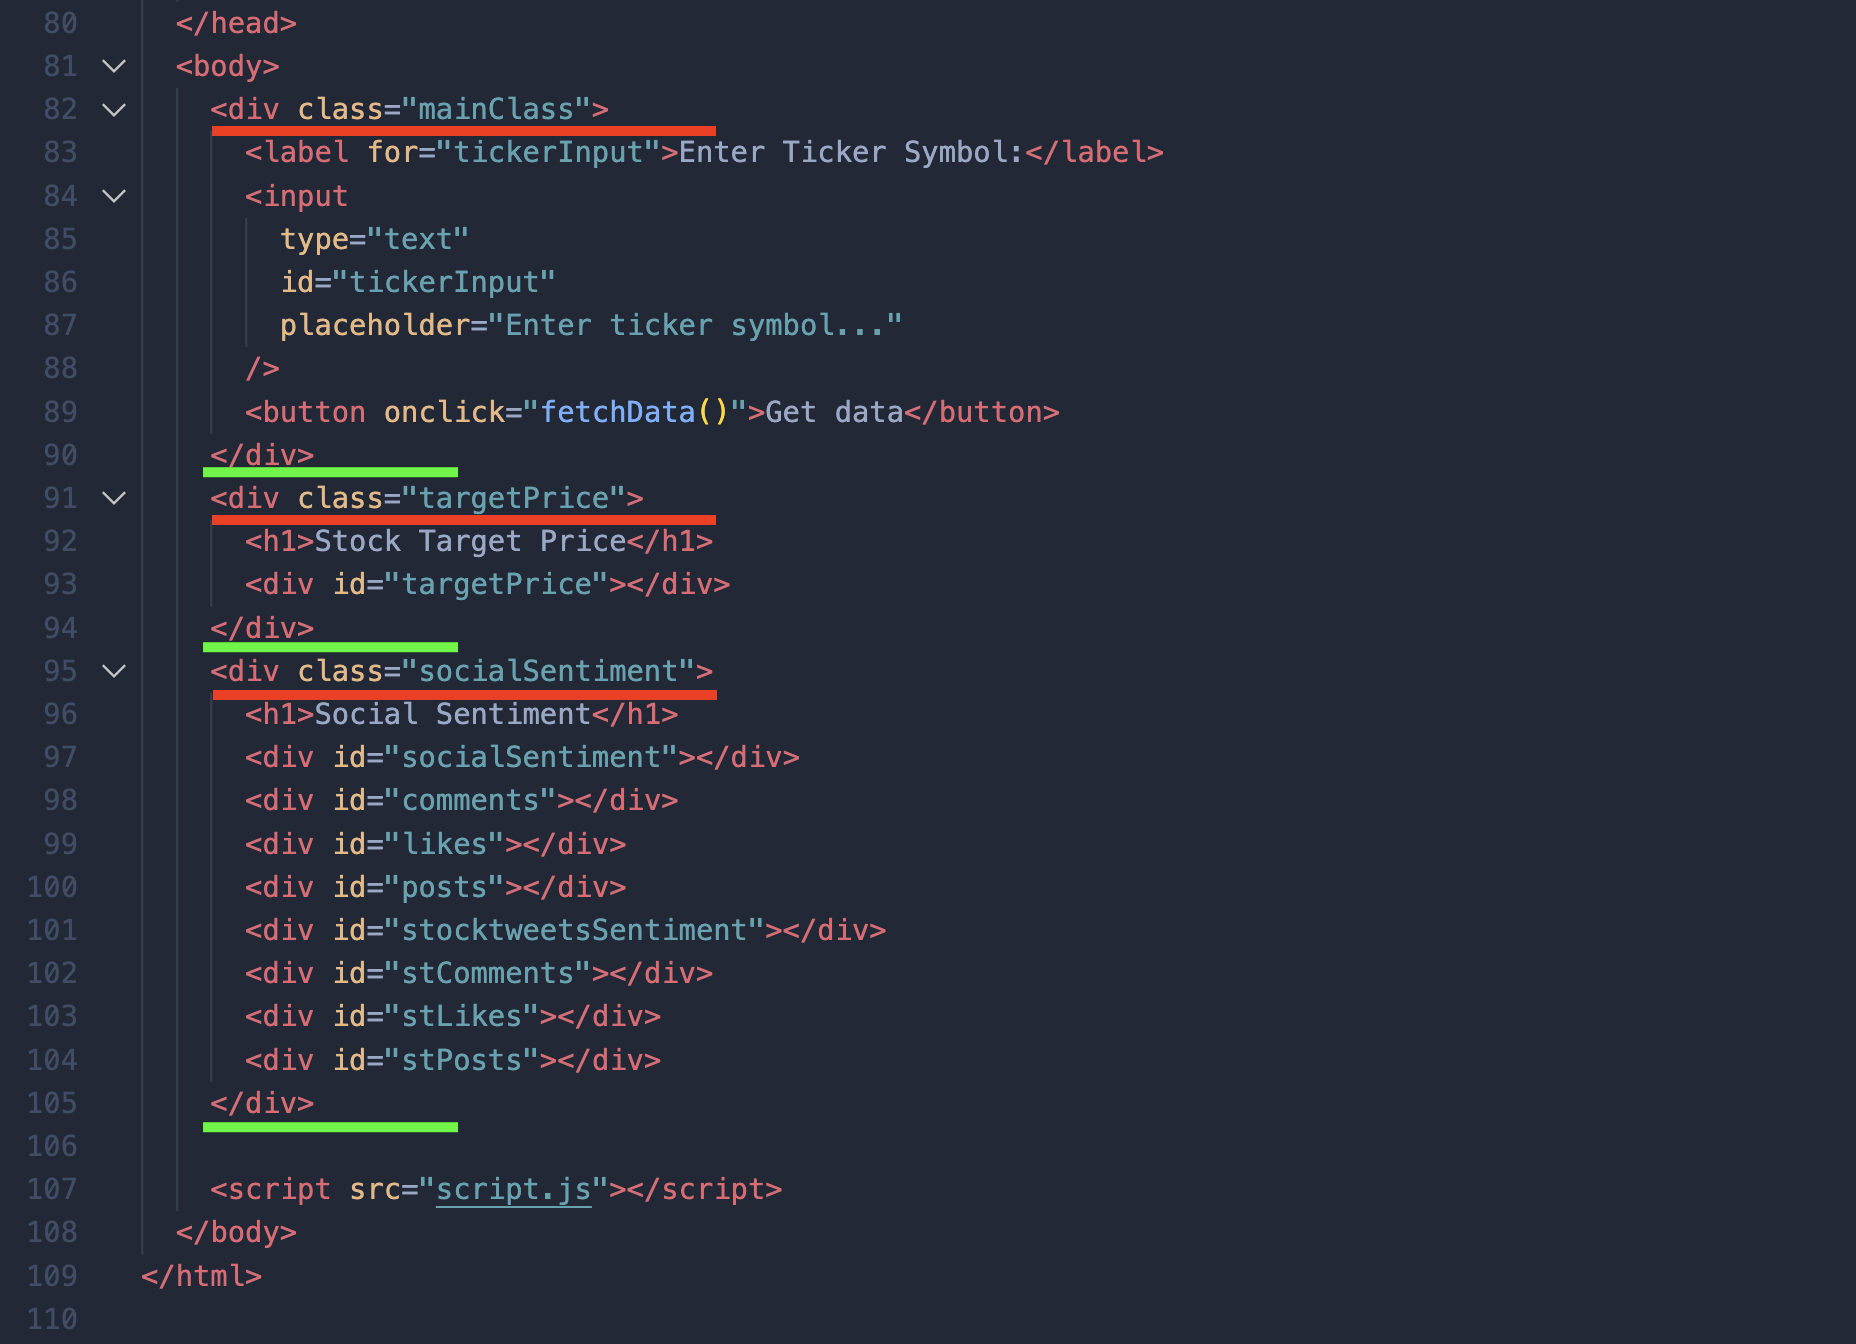
As you remember, this is the app we built in the previous step (read the previous article) and only updated the design. Now that we have improved the design, let's start with EPS data extraction. But first, let's create new elements in our HTML file.

stock market app eps html elements

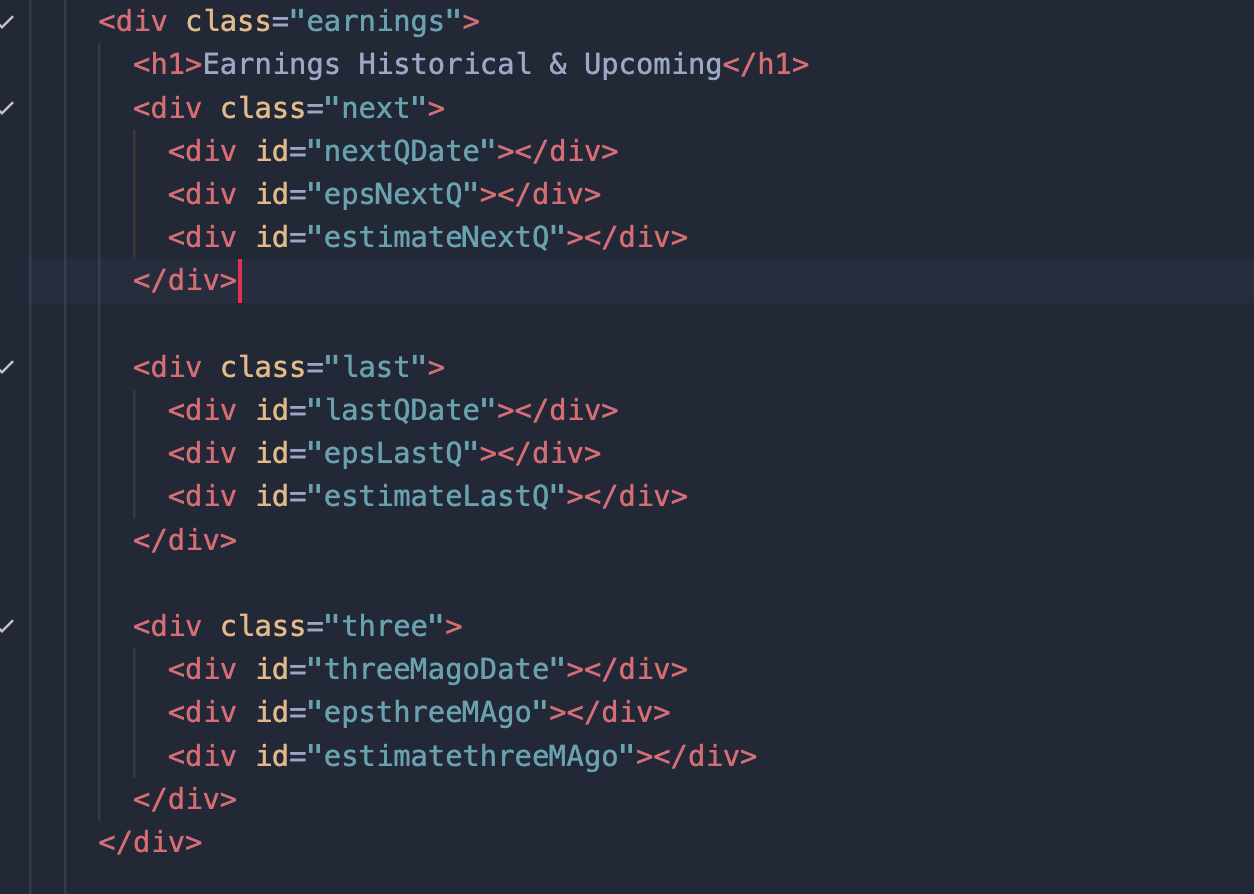
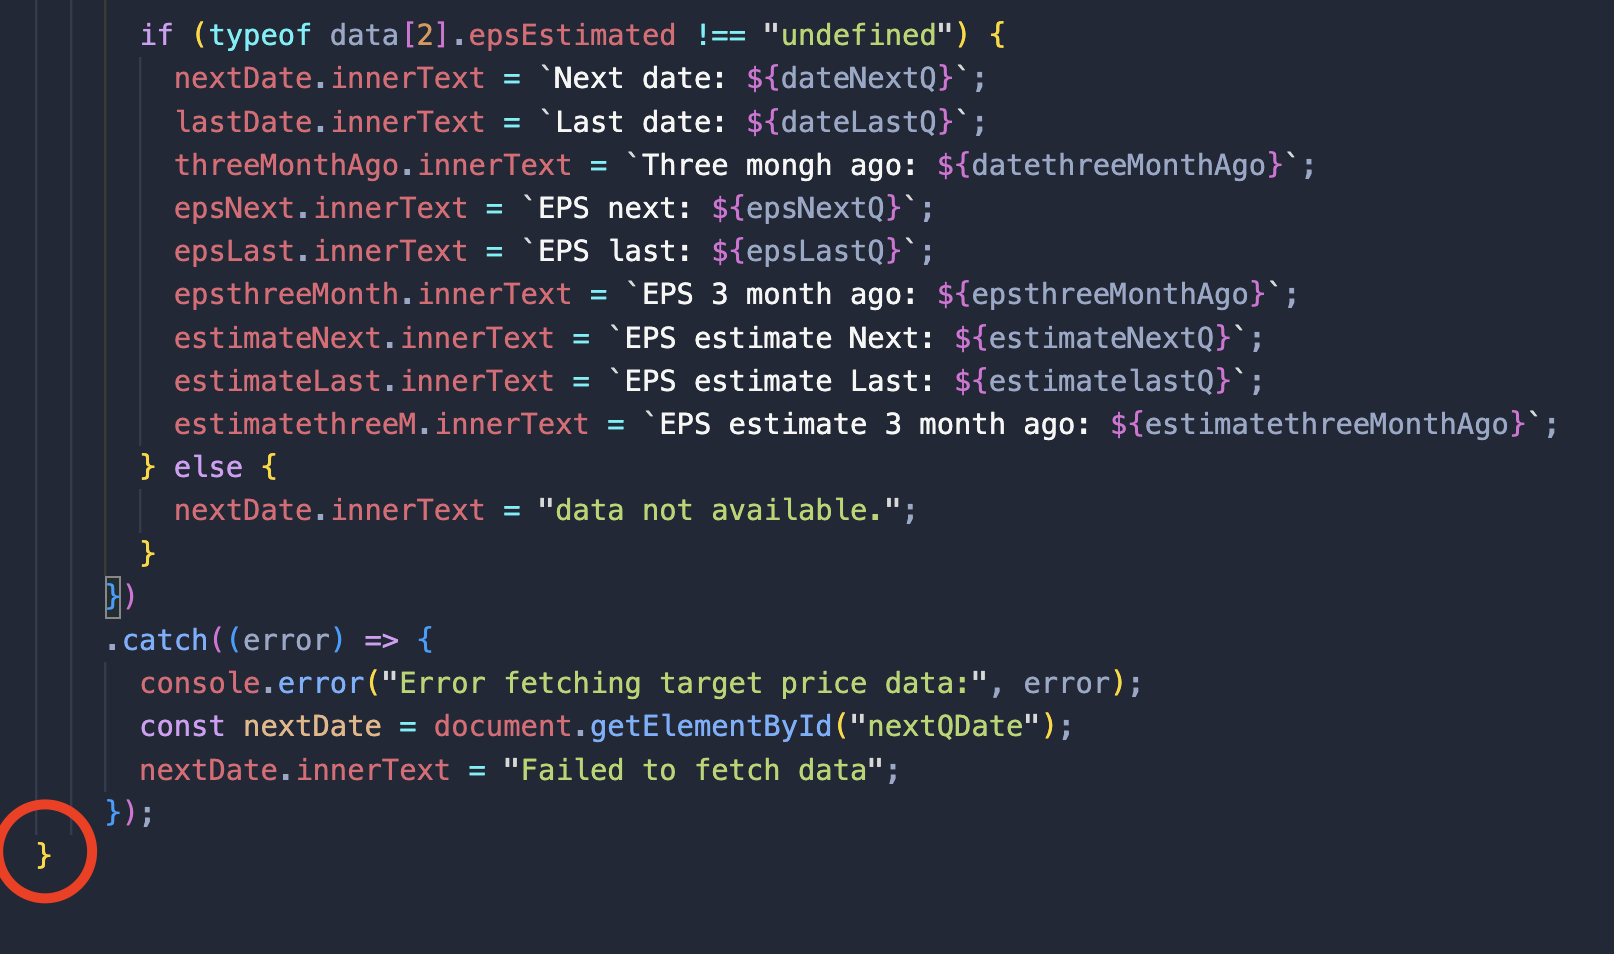
Copy the code and paste it into your existing file. As you can see, we added earnings and dates. Now let's work on the JavaScript code to populate this data. Open your JavaScript file in VSCode, which we named 'script.js.' Now add the code below to your script.js file, under your old code, but make sure you leave one bracket like this '}' outside.

stock market app eps extraction

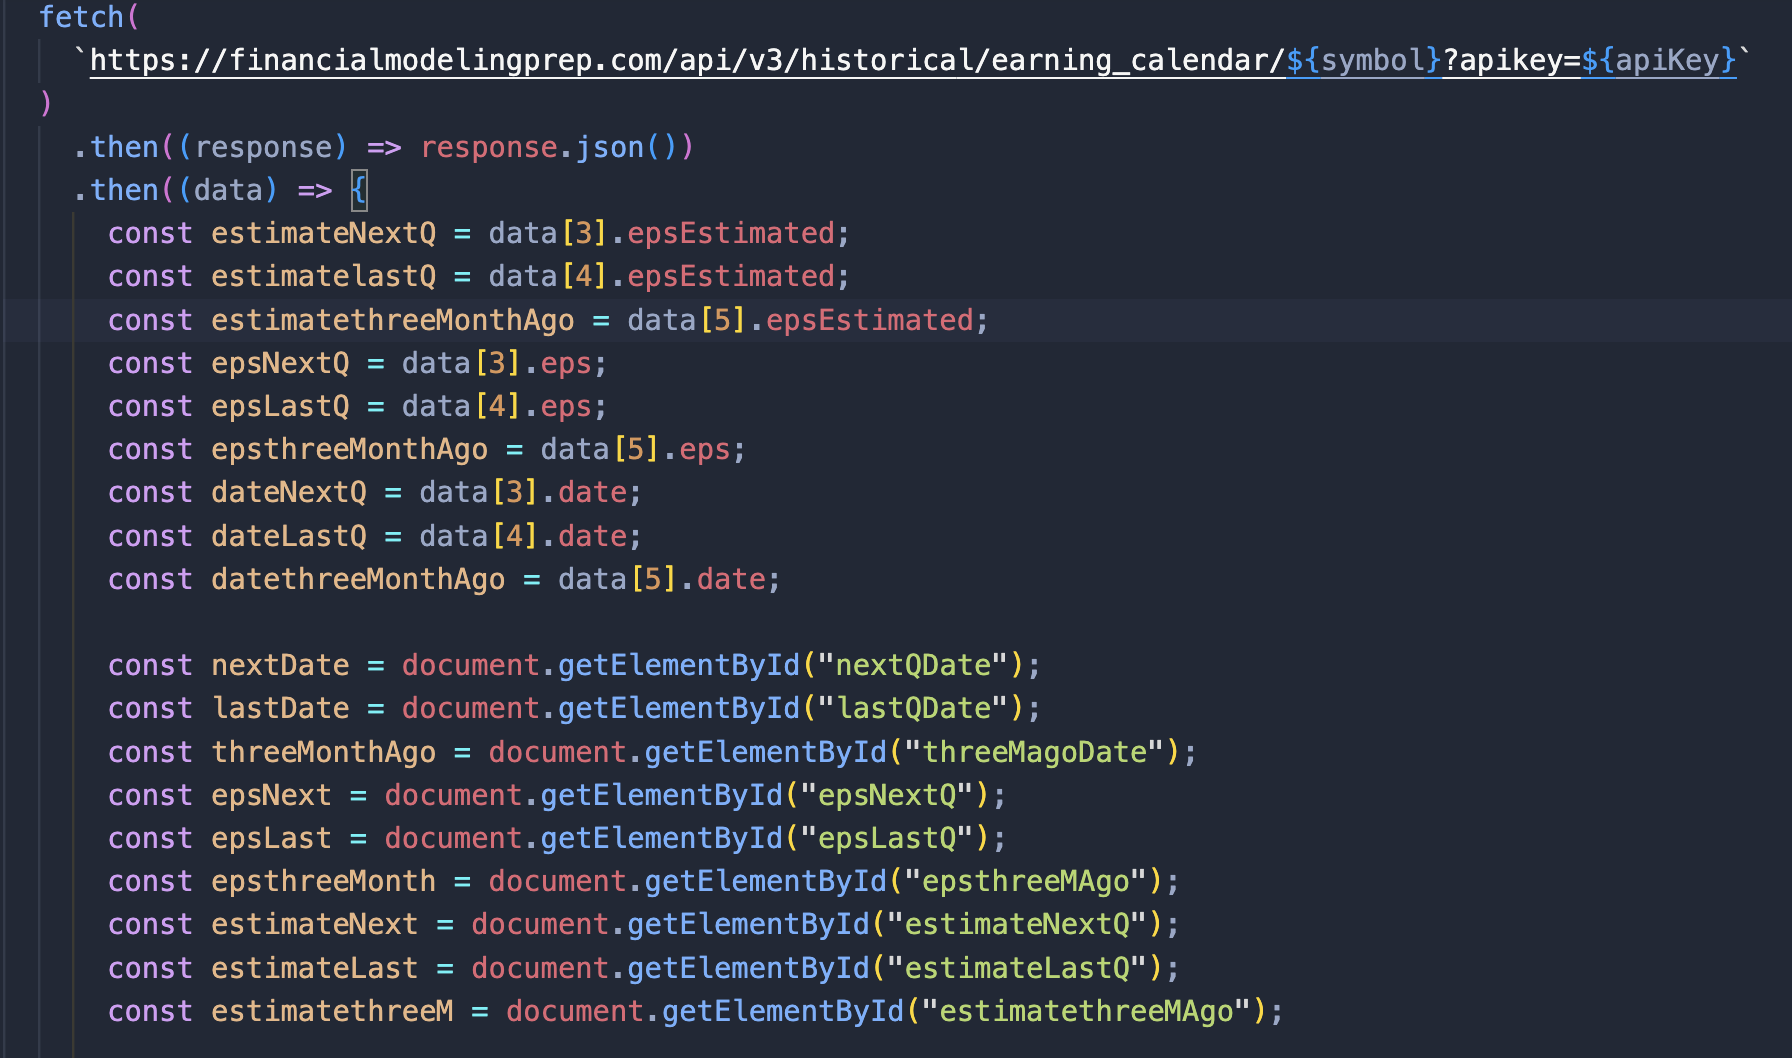
As you can see, we are extracting data using the FMP earnings API. The link is in the upper part of the code. We extract estimates, dates, and actual EPS data separately to display them on the screen. Then we connect our HTML file with the extracted data, which are the last six elements in the JavaScript code.

In the last step, we check that data exists and actually populate the HTML elements with the extracted data. As you can see, the last bracket '}' marked with a circle that I mentioned earlier is outside. This bracket is from the old code in the previous article. You should insert your code inside the brackets so that the last bracket remains the final element of the code.

stock market app earnings API

Now save your JavaScript file. We are not done yet. The final part is to add some designs. Paste the code below into the HTML file, inside the elements.

• next,

. last,

-three {

display: flex;

flex-direction: column;

align-items: center;

padding: 10px;

border: 1px solid L #ccc;

margin: 0 10px;

}

Save your HTML file and drag it from VSCode to the open browser window. If you have done everything correctly, you will see something like this:

stock market app final view with code

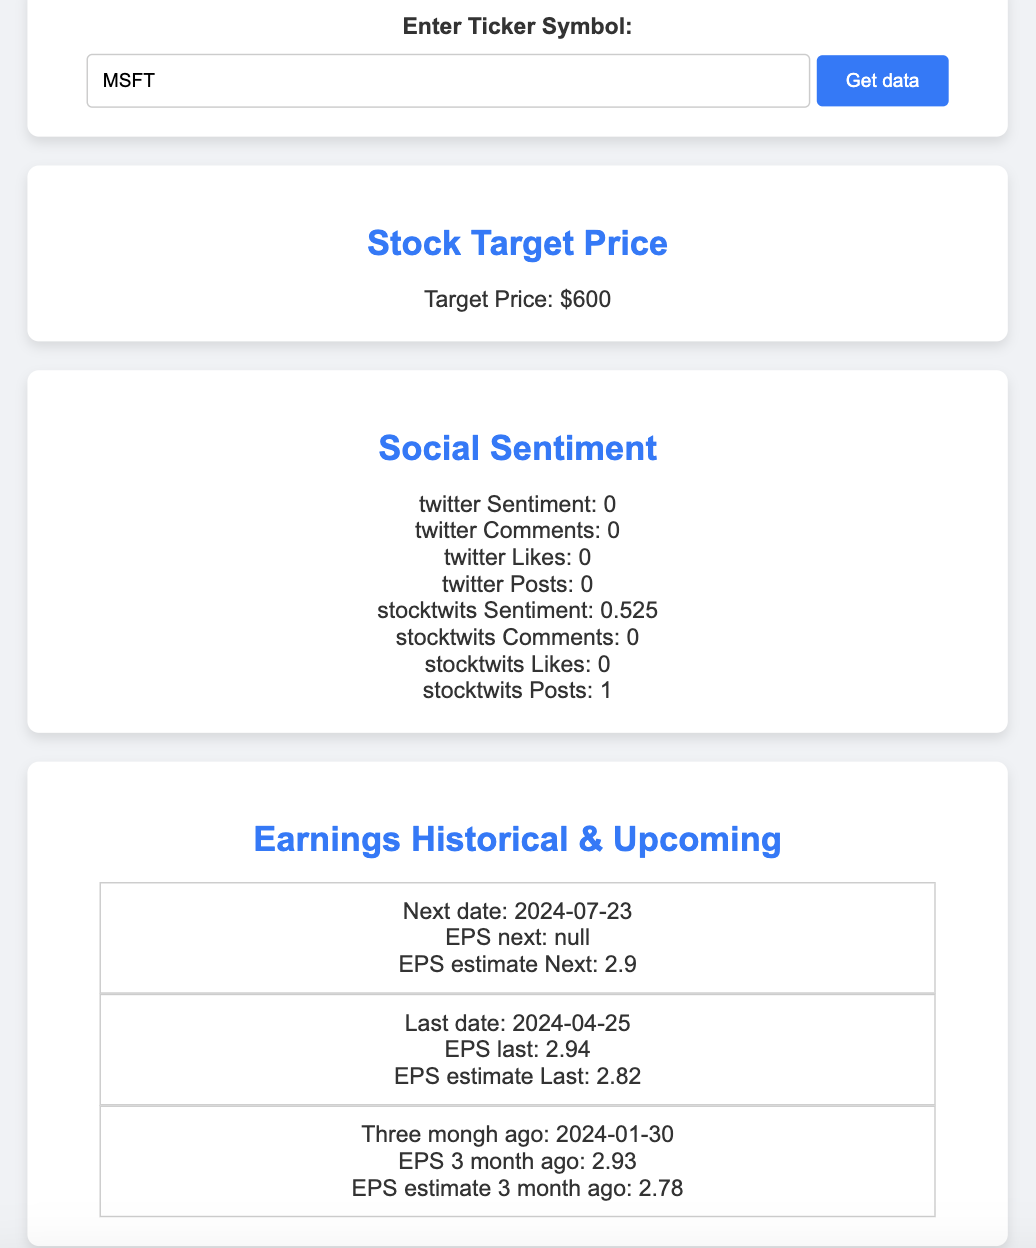
When I inputted my stock ticker, MSFT in this case, and pressed the 'get data' button, I saw the above results. The first two elements are from previous articles, and the last element, 'Earnings Historical & Upcoming,' is from today's article. As you can see, Microsoft (MSFT) consistently shows better EPS (actual EPS surpasses analysts' forecasts), which can give investors higher confidence during the next MSFT report and potentially boost the share price. To download the code and build your first stock market app, visit my GitHub repository.

Now, after building a simple application, your next step could be to develop your custom stock screener to find amazing stocks based on your risk appetite. Then, after selecting 8-10 stocks from your screener, input their tickers into the new simple app we just made to view your chosen stocks' target prices, social sentiment, and earnings expectations. By doing this, you can identify a great time to buy stocks if your new app indicates great growth potential (target price is higher than the current market price), amazing social sentiment, and significant EPS surprise (actual data surpassing the estimate). I hope my article was helpful to you. Thank you very much for reading it.

Other Blogs

Oct 31, 2023 8:03 AM - Parth Sanghvi

FCFF vs FCFE: What's the Difference?

Free cash flow to the firm (FCFF) and free cash flow to equity (FCFE) are two of the most important metrics used in financial modeling. Both metrics measure the amount of cash that is available to a company's shareholders and creditors, but there is a key difference between the two. FCFF measures...

blog post title

Nov 25, 2023 6:39 AM - Parth Sanghvi

DCF Valuation vs. Comparable Companies Analysis: Choosing the Right Valuation Method

Choosing the Right Valuation Method: DCF vs. Comparable Companies Analysis Introduction: Valuation methods play a pivotal role in determining the fair value of a company, aiding investors in making informed investment decisions. Two commonly used methods, DCF Valuation and Comparable Companies A...

blog post title

Dec 23, 2023 2:19 AM - Parth Sanghvi

Understanding the Limitations of DCF Analysis: A Guide to Overcoming Challenges

Introduction: Discounted Cash Flow (DCF) analysis stands as a cornerstone in valuing investments, yet its efficacy is contingent upon various assumptions and methodologies. While a powerful tool, DCF analysis comes with inherent limitations and challenges that investors must acknowledge to make i...

blog post title
FMP

FMP

Financial Modeling Prep API provides real time stock price, company financial statements, major index prices, stock historical data, forex real time rate and cryptocurrencies. Financial Modeling Prep stock price API is in real time, the company reports can be found in quarter or annual format, and goes back 30 years in history.
twitterlinkedinfacebookinstagram
2017-2024 © Financial Modeling Prep