


For multinational companies, international growth can look stable even when reported results are being reshaped by exchange rates.
A company may continue selling well across overseas markets, but translated revenue can still weaken when foreign currencies move against the reporting currency. Margin comparisons can also become harder when pricing, sourcing, and local costs do not move in the same direction. This is why global companies often need to be reviewed within a broader global market comparison framework, where regional exposure and currency context affect interpretation.
That is why foreign revenue concentration matters before earnings are reported. A company with large exposure to Europe, China, Japan, Latin America, or other overseas markets may carry more translation risk than headline revenue growth suggests.
The challenge is that FX exposure is not visible from revenue alone. Analysts need to connect geographic revenue segments with relevant currency pairs, recent FX movement, and simple shock scenarios. Even then, the output should be treated as an exposure estimate, not a precise hedging model.
Using Financial Modeling Prep data through Claude MCP, teams can turn segment disclosures and forex data into a structured FX exposure view. The system can identify major foreign revenue regions, connect them with relevant currency pairs, apply adverse FX scenarios, and classify exposure as high, moderate, low, or review required.
The goal is to make currency risk easier to interpret before earnings surprises, guidance revisions, or translation effects make the exposure obvious.
Turning Geographic Revenue Into FX Scenario Review
The FX exposure review starts by converting regional sales into a directional exposure map. The question is not only where a company sells, but which currency movements could influence reported results.
The review has three parts. It identifies the largest foreign revenue regions, links those regions to likely currency pairs such as EUR/USD, GBP/USD, JPY/USD, CAD/USD, or major emerging-market pairs, and then applies simple adverse FX scenarios to highlight where reported revenue may be more exposed.
This is not a revenue-at-risk model or a hedging-adjusted estimate. It does not assume that every euro, yen, pound, or peso of sales flows directly into reported revenue without offsets. The purpose is to create a directional exposure screen that helps analysts focus on the regions and currency pairs that deserve closer review.
For this article, a consumer multinational peer group such as Coca-Cola, PepsiCo, and McDonald's works well because all three companies have meaningful international exposure, recognizable business models, and regular investor discussion around currency translation. The group is also small enough for a cost-efficient Claude MCP run.
The output should help analysts answer a practical question: if currency moves against the reporting currency, which companies appear more exposed, which currency corridors matter most, and where should the analyst review hedging, pricing, invoicing, or local cost offsets?
Data Reliability Comes First
FX exposure analysis depends on how cleanly reported regions can be linked to currency assumptions. That link is useful, but it is rarely exact. This makes financial data quality especially important because broad segment labels can create false precision if they are mapped too aggressively.
A company may report revenue from Europe, but that does not mean every sale is exposed to EUR/USD. Some contracts may be priced in U.S. dollars. Some regions may include several currencies. Local operating costs may also offset part of the translation impact.
Segment labels need the same caution. “International,” “EMEA,” or “Rest of World” can combine countries with different currencies, growth rates, and pricing models. If the disclosure is too broad, the model should return a directional estimate rather than a high-confidence exposure score.
Hedging also limits precision. Two companies with similar foreign revenue exposure can report different earnings sensitivity if one hedges more actively or has stronger local cost offsets. Analysts may need to review the company's hedging disclosures and derivative instruments because derivatives can change how much currency movement flows through reported results.
The goal is not to build a treasury-grade hedging model. It is to identify the regions and currency pairs that deserve analyst attention.
FMP Data Inputs for FX Exposure Analysis
The analysis needs two evidence layers: where revenue is generated and how the relevant currencies are moving. The data should support a company-level exposure view, not a broad macro commentary.
|
Analytical Role |
FMP Dataset |
|
Geographic revenue exposure |
|
|
Current FX context |
|
|
Recent FX movement |
|
|
Currency pair validation |
|
|
Financial context |
Income Statement API, only when total revenue or profitability context is needed |
- Geographic revenue evidence comes from the Revenue Geographic Segments API. This is the core dataset because it shows how revenue is distributed across regions and helps Claude identify which markets drive foreign exposure.
- Currency market evidence comes from the Full Forex Quote API. This lets Claude retrieve current forex quotes for the relevant currency pairs instead of manually checking each pair one by one.
- Historical FX movement evidence can come from the Historical Forex Full Chart API. This is useful when the analysis needs to compare recent currency movement over a defined period before applying shock scenarios.
- Currency pair validation can come from the Forex Currency Pairs API. This helps Claude confirm which pairs are available before mapping regions to currencies.
- Financial context can come from the Income Statement API only when Claude needs total revenue or profitability context. The core analysis should remain focused on segment revenue, currency pairs, and scenario exposure.
Accessing FMP Data Through Claude MCP
To run this analysis inside Claude, users need an active Financial Modeling Prep API key and access to Claude's custom connector setup.
FMP provides a dedicated AI Agent MCP Server page for connecting its financial datasets to tools such as Claude, Cursor, or custom agents. In Claude, open Settings → Connectors → Add custom connector and add the FMP MCP endpoint:
|
https://financialmodelingprep.com/mcp?apikey=YOUR_FMP_API_KEY |
Once connected, Claude can coordinate company segment disclosures with market-based forex data. For this article, the task is to build a compact exposure map: major foreign regions, relevant currency pairs, recent FX movement, and adverse shock scenarios.
The output should stay short and reviewable. It should include a compact exposure snapshot, one directional FX exposure matrix, classification, confidence level, and analyst follow-up actions. It should not turn into a long currency commentary.
Turning Geographic Revenue Into FX Scenario Review
After the data is retrieved, the analysis moves from segment disclosure to scenario-based exposure review. The goal is to identify which companies may be more sensitive to adverse currency movement, not to produce a fully hedging-adjusted revenue-at-risk model.
Region mapping
Claude first identifies the largest foreign revenue regions for each company. A broad region such as Europe, Latin America, or Asia-Pacific should be mapped to the most relevant currency corridors, while also flagging cases where one segment includes several currencies.
Scenario design
The review then applies simple adverse currency moves, such as 5 percent, 10 percent, and 15 percent. These scenarios do not predict exchange rates or calculate precise revenue impact. They help show where reported revenue may be directionally exposed if foreign currencies weaken against the reporting currency.
Exposure classification
Claude can classify companies as high, moderate, low, or review-required exposure based on foreign revenue share, concentration in specific regions, recent FX movement, and scenario sensitivity.
Analyst review layer
The final layer is judgment. Analysts need to check whether the company hedges currency risk, prices in U.S. dollars, has local cost offsets, or reports regions too broadly for precise mapping.
This keeps the review practical. It turns regional revenue into an FX exposure screen without implying a fully quantified hedging-adjusted estimate.
Running the Claude MCP Prompt
The prompt should keep Claude focused on exposure mapping. It should retrieve only the data needed to connect geographic revenue with relevant currency pairs and build a directional revenue-at-risk screen.
Copy and paste the prompt below into Claude after connecting the FMP MCP server:
|
Use FMP MCP to assess foreign revenue concentration and currency risk for this peer group:
Separate reported segment data from analyst assumptions.
Create one decision-useful visual only:
Add a short "author interpretation notes" section to help convert the output into an article section. Keep it to 3-5 bullets only. Include:
Keep the written explanation short. Use bullets, not long paragraphs. Do not write a general macro or currency market summary.
|
Interpreting the Output and Analyst Review
Claude's output shows why FX exposure analysis should be treated as a directional revenue-at-risk screen, not a precise, probabilistic, or hedging-adjusted earnings model.
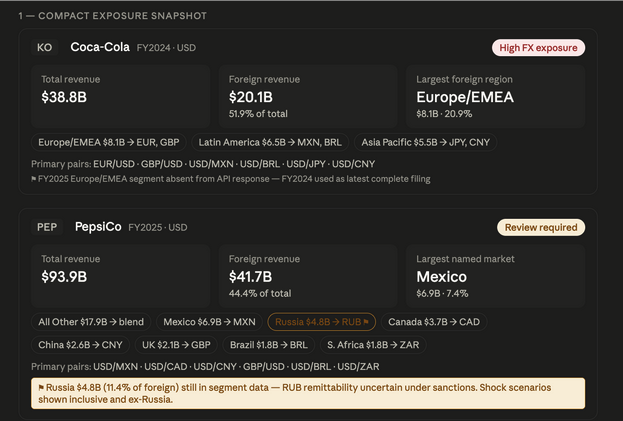
The first signal was data completeness. Coca-Cola's latest geographic segment output did not include a complete Europe or EMEA segment, so Claude used the most complete comparable year as the cleaner basis. That kept the analysis from forcing a high-confidence view from incomplete segment data.
PepsiCo produced the most important exposure flag. Its Russia revenue creates a different kind of FX question because the reported geography does not translate cleanly into normal RUB/USD sensitivity. In that case, the issue is not only currency movement. It is whether the reported revenue has the same economic value under sanctions and remittance constraints.
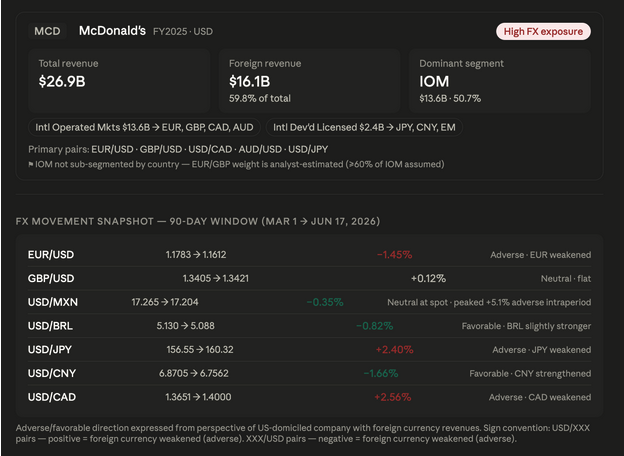
McDonald's showed why the FX window matters. A simple end-period currency move can understate pressure if a currency weakened materially during the period and then partially recovered. For companies with meaningful EUR or GBP exposure, analysts may need to review both closing-rate movement and intraperiod stress, which is where time-series analysis can help separate short-lived currency moves from more persistent pressure.
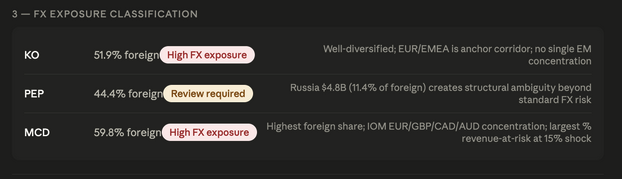
The main value of the output is ranking. Claude connects geographic revenue, currency corridors, and shock scenarios to show which companies deserve deeper FX review.
Where the System Needs Analyst Review
FX exposure mapping needs analyst review because reported geography is only a starting point.
Segment completeness is the first review condition. If a major region is missing, aggregated, or reported differently across years, the system should not force a clean exposure score. The better output is a review flag with the most complete comparable period clearly identified.
Currency mapping is the second review condition. A region such as Europe, Latin America, or Asia-Pacific may include several currencies. Mapping the entire region to one currency pair can support screening, but it should not be treated as exact exposure.
Hedging and invoicing also need review. A company may hedge part of its foreign revenue, invoice customers in U.S. dollars, or use pricing terms that reduce translation pressure. Without those disclosures, the scenario output should remain directional.
Local cost structures can also offset revenue translation risk. If a company earns revenue and incurs costs in the same local currency, the revenue impact may not flow directly into margins or earnings.
The system's role is to surface the exposure map quickly. Analysts then validate whether the risk is a reporting translation issue, a true economic exposure, a hedging question, or a segment disclosure limitation.
Turning FX Exposure Into a Pre-Earnings Risk View
Foreign revenue concentration becomes more useful when it is linked to currency movement before earnings are reported. Demand may remain stable, while reported growth changes because exchange rates move against major revenue regions.
Using FMP data through Claude MCP gives analysts a structured way to build that pre-earnings view. Segment data shows where revenue is generated. Forex data shows which currency corridors are moving. Scenario analysis shows where reported revenue may be more sensitive. Larger coverage universes may require more forex, fundamentals, and API capacity, so teams should match the workflow to the level of access they need before scaling the review.
The model is not meant to replace treasury disclosures or company-specific hedging analysis. Its value is prioritization. It helps analysts identify which companies have larger foreign exposure, which currencies matter most, and where reported results may need closer review.
For global equity research, portfolio monitoring, pre-earnings review, and macro-sensitive screening, this creates a practical directional FX exposure layer. The focus shifts from asking whether a company is global to asking which part of its revenue base is most exposed when currency conditions change.







