Detect Structural Margin Shifts Using Multi-Year Cost Decomposition Analysis

Margin direction alone does not explain business quality. A company can report higher margins because it has stronger pricing power, better revenue mix, or durable operating leverage. The same improvement can also come from temporary cost cuts, lower investment, accounting changes, or short-term cost relief.
That distinction matters for analysts. A margin expansion that comes from structural operating leverage may support stronger valuation assumptions. A margin expansion that comes from delayed spending or unusual expense movement may not be durable. The same logic applies to margin compression. It may reflect temporary cost pressure, or it may reveal deeper deterioration in the company's cost structure.
Multi-year cost decomposition helps separate these signals. Instead of looking only at gross margin or operating margin, analysts can track revenue growth, cost of revenue, SG&A, R&D, and operating income across several quarters or fiscal years. This is similar to broader cost structure and efficiency benchmarking, where margin architecture is evaluated across peers rather than viewed in isolation.
Using Financial Modeling Prep data through Claude MCP, teams can turn this review into a structured margin durability system. Claude can retrieve historical income statement data, decompose the major cost lines, identify inflection points, compare margin movement against peers, and classify whether the shift looks structural, cyclical, temporary, accounting-driven, or review-required.
The goal is not to label every margin change as good or bad. It is to understand what changed underneath the margin line and whether that change is likely to persist.
Why Margin Shifts Need Cost Decomposition
Margin movement becomes useful only when analysts can explain the driver. A higher operating margin may look positive, but the source of that improvement changes the interpretation.
If gross margin expands while revenue is also growing, the company may be benefiting from pricing power, better product mix, or scale advantages. If operating margin expands because SG&A or R&D falls as a percentage of revenue, the signal needs more review. It may reflect better cost discipline, but it may also reflect delayed hiring, reduced marketing, lower product investment, or temporary expense control.
Margin compression needs the same decomposition. A decline in gross margin may point to input cost pressure, discounting, weaker mix, or lower utilization. A rise in SG&A or R&D may reduce near-term margins but still support long-term growth if the spending is tied to expansion or product development.
This is why a margin durability review should not stop at profitability ratios such as gross margin or operating margin. Claude needs to break the change into revenue, cost of revenue, SG&A, R&D, and operating income, then determine which line item actually changed the margin profile.
The key question is not simply whether margins moved. It is whether the movement came from a durable business shift, a cyclical cost benefit, a temporary expense decision, or an item that needs analyst review.
Data Reliability Comes First
Margin decomposition depends on consistent financial statement structure. Revenue, cost of revenue, SG&A, R&D, and operating income must be pulled from the same reporting period before Claude compares margin movement across quarters or years.
The main risk is inconsistent line-item treatment. Some companies report R&D separately, while others include certain expenses inside broader operating expense categories. SG&A can also include different cost items across companies, which makes peer comparison less reliable if Claude treats every line as directly comparable.
Period alignment matters as well. Quarterly data is useful for spotting inflection points, but multi-year analysis should separate normal seasonal movement from a real change in the cost structure. This is especially important because financial ratios can break down across market cycles, where temporary demand shocks or cost pressure can distort margin interpretation. A single strong quarter should not be treated as structural improvement unless the driver persists across later periods.
Claude should flag cases where cost categories are missing, reporting periods are inconsistent, or margin changes appear to be affected by unusual items. In those cases, the right next step is analyst review, not a forced durability classification.
FMP Data Inputs for Margin Durability Analysis
Margin durability analysis starts with the income statement, but the evidence needs to be organized by analytical role rather than endpoint name. Claude has to connect revenue movement, cost-line behavior, operating profit, and peer context before assigning any durability classification.
|
Analytical role |
FMP dataset |
|
Cost structure evidence |
|
|
Income statement trend evidence |
|
|
Broader financial growth cross-check |
|
|
Profitability and margin validation |
|
|
Peer and sector context |
Cost structure evidence comes from the Income Statement API. This gives Claude the core fields needed for decomposition: revenue, cost of revenue, gross profit, SG&A, R&D, operating income, and net income.
Income statement trend evidence comes from the Income Statement Growth API. This helps Claude check whether revenue, profit, and expense changes are persistent across periods rather than isolated to one quarter.
Broader financial growth cross-checks can come from the Financial Statement Growth API. This is useful when Claude needs to compare margin movement with wider growth patterns instead of looking only at one cost line.
Profitability and margin validation can come from the Key Metrics API and Financial Ratios API. These APIs can help validate gross margin, operating margin, net margin, return metrics, and other profitability ratios, but they should support the analysis rather than replace the underlying cost decomposition.
Peer and sector context can come from the Company Profile Data API. This helps Claude separate company-specific margin change from broader peer or sector movement and keeps the comparison grounded in similar business models.
Accessing FMP Data Through Claude MCP
To run this analysis inside Claude, users need an active Financial Modeling Prep API key and access to Claude's custom connector setup.
FMP provides a dedicated AI Agent MCP Server page for connecting its financial datasets to tools such as Claude, Cursor, or custom agents. In Claude, open Settings → Connectors → Add custom connector and add the FMP MCP endpoint:
|
https://financialmodelingprep.com/mcp?apikey=YOUR_FMP_API_KEY |
Once connected, Claude can retrieve historical income statement data through FMP MCP and organize the analysis around cost decomposition. For this article, the key task is not simply calculating margins. Claude has to identify which cost line changed, whether that change persisted, and whether peers show the same pattern.
The output should stay compact. Claude should provide a limited source-data snapshot, a margin driver summary, one visual focused on the main margin shift, and a durability classification with analyst follow-up actions.
Turning Cost-Line Trends Into Margin Durability Signals
After Claude retrieves the data, the analysis moves from margin calculation to margin explanation. The goal is to understand which cost line changed, how long the change persisted, and whether peers show a similar pattern. The classification should support analyst review, not act as a final scoring model.
Structural Improvement
Structural improvement applies when revenue growth, gross margin, and operating margin improve together over multiple periods. This usually points to better scale, stronger pricing, favorable mix, or durable cost leverage.
Cyclical Improvement
Cyclical improvement applies when margins expand because of industry-wide cost relief, stronger demand conditions, or a temporary pricing cycle. The company may look better, but the improvement may not be fully company-specific.
Temporary Cost Effect
Temporary cost effect applies when margins improve mainly because SG&A, R&D, marketing, or hiring investment falls as a percentage of revenue. This can support short-term earnings but may not improve long-term business quality.
Structural Deterioration
Structural deterioration applies when margin compression is persistent and tied to weaker gross margin, rising operating costs, or reduced operating leverage.
Accounting or Quality Concern
Accounting or quality concern applies when the margin shift depends on unusual expense movement, reclassification, missing line items, or one-time accounting effects.
Review Required
Review required applies when the evidence is incomplete or the driver is unclear. Claude should use this category when the data does not support a confident durability label.
Running the Claude MCP Prompt
The prompt should keep Claude focused on margin drivers, not a long financial statement summary. It should retrieve only the fields needed for decomposition, show a compact source-data snapshot, and return one visual that explains the main margin shift.
Copy and paste the prompt below into Claude after connecting the FMP MCP server:
|
Use FMP MCP to analyze margin durability and cost-structure shifts for this peer group: NVDA, AMD, INTC Use quarterly income statement data for the last 6 reported quarters only. Keep the analysis cost-efficient and compact. Use the Income Statement API first. Use other FMP endpoints only if they are required to validate a specific issue. Retrieve only these fields: - Revenue - Cost of revenue - Gross profit - Selling, general and administrative expenses - Research and development expenses - Operating income - Net income Do not return full raw income statements. Show only a compact source-data snapshot with the latest quarter, earliest quarter, and major change over the period. Calculate: - Revenue growth - Cost of revenue as a percentage of revenue - Gross margin - SG&A as a percentage of revenue - R&D as a percentage of revenue - Operating margin Express margin changes in basis points where possible. Clearly state whether each comparison is latest-quarter versus earliest-quarter or a multi-period trend. Flag when six quarters may not be enough to separate seasonality, product-cycle timing, or short-term cost movement from a structural margin shift. Separate reported margin movement from unusual items or one-time charges. Do not normalize results unless the supporting data is clear. If normalization is not supported, keep the reported result and flag the item for analyst review. Identify the main margin driver for each company: - Revenue scale - Cost of revenue improvement or pressure - SG&A leverage or deleverage - R&D leverage or reduced investment - Operating income expansion or compression - Unusual or unclear expense movement Compare each company against peers and separate company-specific margin movement from broader sector movement. Classify each company into one category: - Structural improvement - Cyclical improvement - Temporary cost effect - Structural deterioration - Accounting or quality concern - Review required Create one decision-useful visual only: A compact margin driver heatmap showing: company, gross margin trend, SG&A leverage, R&D intensity, operating margin trend, main driver, classification, confidence, analyst follow-up. Do not create visuals for intermediate calculations. Keep the written explanation short. Use bullets, not long paragraphs. Target a response that can be generated in 2-3 minutes. Return only: - Compact source-data snapshot - Margin driver heatmap - Margin shift classification table - Brief analyst follow-up actions - Data quality or analyst review flags |
Interpreting the Output and Analyst Review
The values, classifications, and company-specific observations in this section come from the Claude MCP run used for this article and should be treated as example output from that run, not current company ratings or live margin durability classifications.
Claude's output separates margin direction from margin quality. That distinction is the main value of the analysis.
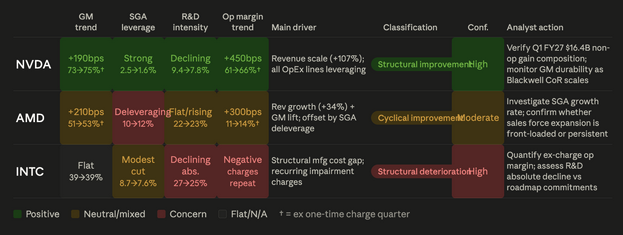
About The Image: Margin driver heatmap from the Claude run
In the sample semiconductor peer group, NVIDIA was classified as structural improvement in the Claude run. The heatmap points to revenue scale, gross margin expansion, and operating expense leverage as the main drivers. The output also flags that NVIDIA's gross margin durability still needs review as new product cycles scale, especially where one-time charges or non-GAAP adjustments affect comparability.
AMD showed improvement, but with a more cautious classification. The run classified AMD as a temporary cost effect with moderate confidence. Gross margin and operating margin improved, but SG&A moved unfavorably as a percentage of revenue, which made the improvement less clean than NVIDIA's. The follow-up question is whether higher sales and marketing expense reflects temporary go-to-market investment for AI accelerators or a more persistent cost burden.
Intel was classified as structural deterioration in the Claude run. The heatmap points to flat gross margin, repeated charges affecting operating margin, and declining R&D intensity. In this case, lower R&D intensity may not represent healthy operating leverage. It may require review because Intel is still trying to close a technology and manufacturing gap.
The useful part of the output is not the exact margin number in one quarter. Those figures will change as new filings arrive. The value is the driver map: which cost line changed, whether the movement persisted, whether peers showed the same pattern, and whether reported margin needs analyst review for one-time charges, non-GAAP adjustments, or unusual expense movement.
For analysts, the next step is different for each company. NVIDIA requires gross margin durability checks as new product cycles scale. AMD requires SG&A and segment-level review to determine whether the cost pressure is temporary investment or a more persistent burden. Intel requires normalized operating income analysis and a closer look at whether cost reductions are improving efficiency or reducing long-term investment capacity.
Where Margin Decomposition Needs Analyst Review
Margin decomposition can identify the driver of a margin shift, but some signals still need analyst review before they are used in a durability call.
One-Time Charges
One-time charges are the first review area. In the semiconductor example, the Claude run flagged unusual charge-related effects that influenced reported margin movement. Claude can surface these items, but analysts need to decide whether they are temporary, recurring, or part of a deeper cost-structure issue.
Non-Operating Gains
Non-operating gains also need separation from operating performance. If net income improves because of investment gains, divestiture proceeds, or accounting movements, it should not be treated as margin durability. Operating margin is usually the cleaner signal for this review.
Expense Reclassification
Expense reclassification is another review condition. If SG&A, R&D, or other operating expenses move unusually, analysts should verify whether the change reflects real cost discipline, business mix, or reporting treatment.
R&D Cuts
R&D cuts need careful interpretation. A falling R&D ratio may look like leverage when revenue is scaling. But if R&D is falling in absolute dollars, especially for a company trying to rebuild technology leadership, the signal may point to underinvestment rather than efficiency.
Cash Flow Review
In many cases, margin decomposition should also be compared with cash generation. Reported earnings can improve while cash flow tells a different story, especially when working capital movement, one-time charges, or accounting effects influence the period.
Claude's role is to surface these review points quickly. The analyst's role is to decide whether the margin shift reflects structural improvement, temporary cost movement, accounting noise, or weaker long-term investment quality.
Turning Margin Decomposition Into a Durability Check
Margin analysis becomes more useful when it explains the source of the change. A company with expanding margins is not automatically improving. The analyst still needs to know whether the improvement came from pricing power, scale, mix, lower input costs, reduced investment, or unusual accounting movement.
Using FMP data through Claude MCP gives teams a faster way to run that first-pass review. Claude can retrieve historical income statement data, calculate cost-line trends, compare the company with peers, and classify the margin shift based on the evidence behind it. For teams expanding this type of review across larger peer groups, the available FMP pricing plans can be reviewed based on coverage needs, API usage, and research scale.
The analytical value is the separation. Margin decomposition helps analysts distinguish durable operating leverage from temporary cost effects, accounting noise, or underinvestment. The focus shifts from asking whether margins went up or down to asking whether the margin shift is durable enough to matter.

Financial APIs, Claude MCP, and AI-driven research workflows
Pranjal Saxena writes technical content focused on financial data APIs, Claude MCP workflows, AI-driven research systems, and Python-based market analysis. For FMP, his work centers on turning structured financial data into practical, workflow-driven content for developers, analysts, and fintech teams. He combines experience in data science, NLP, generative AI, and financial API workflows to show how APIs, automation, and AI-assisted systems can support modern financial research and analysis.
Related




Financial data for every need
Real-time quotes and 30+ years of historical data, including prices, fundamentals, and insider transactions — all accessible via API.
Create Free Account