


Dividends and buybacks are often treated as signs of shareholder-friendly management. But the size of a capital return program does not automatically tell us whether it is creating value.
A company can pay steady dividends while free cash flow weakens. It can announce large buybacks while the share count barely moves. It can keep returning cash even as debt rises. In each case, the headline shareholder return may look attractive, but the quality of that return needs closer review.
This is why capital return analysis needs to go beyond dividend yield or repurchase volume. The better question is whether dividends and buybacks are supported by free cash flow, whether buybacks are reducing the actual share base, and whether the balance sheet remains disciplined while cash is being returned. In this workflow, shareholder yield refers to dividends plus buybacks relative to market value, then checked against free cash flow coverage, share count movement, and leverage trend. A broader shareholder yield view helps connect dividends, repurchases, and share-count movement instead of treating each signal separately.
In this article, we build a capital return quality model using Financial Modeling Prep data through Claude MCP. The goal is to evaluate total shareholder yield across dividends and buybacks, connect it with free cash flow coverage, check leverage movement, and separate genuine share reduction from simple dilution offset.
What Capital Return Quality Measures
Capital return quality measures whether dividends and buybacks are supported by the company's financial position, not just whether cash was returned. This is similar to reading dividend and payout signals, where the important question is whether the payout reflects durable cash generation or a weaker funding trade-off.
For this article, the model looks at three questions.
1. Is the return funded by free cash flow?
The first check is whether dividends and repurchases are covered by free cash flow. A company that consistently funds capital returns from internal cash generation has more flexibility than one relying on borrowing, asset sales, or balance sheet drawdown.
2. Did buybacks reduce the share count?
A buyback only creates a clear shareholder benefit when it reduces the ownership base or offsets dilution at a reasonable cost. If repurchase spending is high but the share count stays flat, the program may be absorbing stock-based compensation rather than improving per-share ownership. This matters because per-share value is ultimately tied to the ownership base behind metrics such as earnings per share.
3. Did leverage remain controlled?
Capital returns also need to be viewed against the balance sheet. If dividends and buybacks continue while debt rises or cash falls, the program may still be intentional, but it deserves closer analyst review.
Together, these checks separate capital return volume from capital return quality. A high shareholder yield is more useful when it is backed by free cash flow, real share count reduction, and balance sheet discipline. If those supports weaken, the same dividend or buyback program may require closer review, even when the headline return appears attractive.
FMP APIs Used for the Analysis
Capital return quality analysis needs more than dividend yield or buyback amount. The model needs data that shows how much cash was returned, whether the business generated enough free cash flow, whether buybacks reduced the share count, and whether leverage increased while capital was being returned.
For this analysis, Claude can use the following Financial Modeling Prep datasets through MCP:
|
Analytical Role |
FMP Dataset |
|
Capital return funding |
|
|
Payout and shareholder yield context |
|
|
Debt, cash, and balance sheet movement |
|
|
Share count reduction and dilution check |
Company Share Float & Liquidity API, using shares outstanding where available and float as supporting context only |
|
Dividend history and payment validation |
|
|
Market value denominator for yield estimates |
These datasets help the analysis move beyond a simple shareholder yield screen. Cash flow statement data shows dividends paid, repurchases, free cash flow, and financing activity. Balance sheet data shows whether debt or cash moved in the wrong direction while capital was returned. Shares outstanding data helps determine whether buybacks produced real share count reduction or mainly absorbed dilution. Share float can provide supporting context, but it should not replace shares outstanding unless the substitution is clearly labeled.
The model should also handle cash flow statement sign conventions carefully. Dividends paid and common stock repurchased may appear as negative financing cash flow items depending on the dataset format. The raw data table should preserve the original values, but payout, shareholder yield, and coverage calculations should normalize dividends and repurchases as positive cash outflows.
The goal is not to pull every available metric. The goal is to use the minimum data needed to compare capital return quality consistently across companies and periods.
Accessing FMP Data Through Claude MCP
Financial Modeling Prep supports access through the FMP MCP Server, which allows Claude to connect with FMP datasets directly through the Model Context Protocol.
In Claude, the setup follows this path:
Settings → Connectors → Add custom connector
After adding the FMP MCP connector and API key, Claude can retrieve the required financial data during the analysis instead of relying on manually downloaded files or separate API calls.
Before running the full company list, it is useful to validate the setup with one company and one dataset. For example, ask Claude to retrieve the most recent annual cash flow statement or key metrics for Apple. This quick check confirms that the MCP connector, API key, reporting period, and expected fields are working correctly before Claude generates the full capital return quality table.
For this capital return quality review, Claude can use the connector to pull cash flow data, key metrics, balance sheet data, share float data, dividend history, and market cap data. The analyst still controls the review logic. Claude applies the framework defined in the prompt and returns the calculations, classification, confidence level, and follow-up actions.
This makes the analysis easier to repeat across a portfolio watchlist, peer group, or management quality review without rebuilding the data collection process each time.
Data Alignment Comes Before Classification
Capital return quality depends on connecting multiple financial datasets across the same reporting periods. If the inputs are misaligned, the model may overstate the strength of a dividend or treat a buyback program as more value-creating than it actually is.
The most important check is period consistency. Cash flow data, balance sheet data, share count data, and market cap data should refer to the same fiscal year or quarter. A repurchase amount from one period should not be compared with a share count from another period.
There are also a few business-specific checks. Dividend data should be compared with cash flow dividends paid. Repurchase spending should be checked against actual share count movement. Debt changes should be reviewed alongside financing activity, because rising debt may reflect refinancing, acquisitions, or capital structure decisions rather than buybacks alone.
This step keeps the classification grounded. Before labeling a capital return program as high quality, mixed, or debt-supported, the system first needs to confirm that the evidence is complete, period-aligned, and suitable for comparison.
Building the Capital Return Quality Model
Once the data is aligned, the model can evaluate whether dividends and buybacks are financially supported and whether they improve shareholder ownership.
The analysis starts with four core calculations:
|
Metric |
What it shows |
|
Dividend payout |
Cash returned through dividends relative to free cash flow or earnings |
|
Buyback yield |
Repurchases relative to market value |
|
Total shareholder yield |
Dividends plus buybacks relative to market value |
|
Free cash flow coverage |
Whether free cash flow covers dividends and repurchases |
These metrics explain the size and funding support of the capital return program. But they are not enough on their own. Capital returns also need to be viewed as part of broader capital allocation, where management is choosing between reinvestment, acquisitions, debt reduction, dividends, and buybacks.
The second layer checks whether the return actually improved shareholder ownership. This is where share count movement becomes important. If buyback spending is high but the share count is flat or rising, the program may be offsetting dilution rather than reducing the ownership base.
The final layer checks balance sheet discipline. A company can fund capital returns through free cash flow, but if debt rises materially at the same time, the model should flag the program for analyst review.
The classification combines these three signals:
|
Classification |
Directional classification criteria |
|
High quality |
Capital returns are covered by free cash flow, shares outstanding decline over the review period, and leverage remains stable or improves. This is the cleanest signal because cash generation supports the return and buybacks reduce the actual share base. |
|
Sustainable |
Capital returns are mostly covered by free cash flow, with no major deterioration in leverage or share count. Buybacks may not reduce shares materially, but the program does not appear to weaken financial flexibility. |
|
Mixed |
Capital returns are meaningful, but the evidence is uneven. Examples include partial free cash flow coverage, limited share count reduction, rising dilution, or mild leverage pressure. |
|
Financially stretched |
Dividends and buybacks exceed free cash flow, reduce cash flexibility, or continue during a period of weaker cash generation. The program may still be intentional, but the funding support needs analyst review. |
|
Debt-supported |
Capital returns continue while leverage rises materially or cash balances weaken in a way that suggests debt or balance sheet capacity may be helping fund the program. |
|
Review required |
Data is missing, period alignment is unclear, cash flow sign conventions are not handled consistently, or share count inputs are not comparable. This category should also be used when float is available but shares outstanding is missing or unclear. |
This model avoids treating every buyback as positive. It separates the amount of capital returned from the quality of the return by checking whether cash generation funds the program, whether shares outstanding actually decline, and whether leverage remains controlled.
Claude Prompt for Capital Return Quality Analysis
The prompt below asks Claude to use FMP data through MCP and return a compact capital return quality review. It is designed to show the raw evidence first, then calculate the main quality indicators.
|
Use FMP MCP to analyze capital return quality for the following large-cap technology capital return watchlist: Companies: AAPL, MSFT, GOOGL, META, ORCL, IBM Objective: Retrieve the following FMP datasets where available:
Data rules:
Cash flow sign convention rules:
Share count rules:
Yield denominator rules:
First, show the raw period-level data needed for the analysis:
Then calculate:
Formula rules:
Classify each company into one of the following categories:
Use the following directional criteria:
Return the output in a compact table with these columns: Company | Reporting period | Dividend payout | Buyback yield | Total shareholder yield | FCF coverage | Share count change | Leverage trend | Capital return quality | Confidence | Analyst follow-up action Keep the analysis concise. Do not provide a long company narrative. If data is missing, period alignment is unclear, or the share count source is not comparable, mark the classification as review required and explain the specific data issue. |
Example Claude Output Structure
After Claude retrieves the relevant FMP datasets through MCP, the output should end with a compact capital return quality table. The purpose of this table is not to rank companies manually, but to summarize the final classification produced by the MCP workflow.
The final table should use the same company list from the prompt: AAPL, MSFT, GOOGL, META, ORCL, and IBM. For each company, Claude should show dividend payout, buyback yield, total shareholder yield, FCF coverage, share count change, leverage trend, capital return quality, confidence level, and analyst follow-up action.
The raw period-level evidence and calculated metrics provide the support behind the analysis. The final classification table then brings those inputs together by showing each company's reporting period, payout and yield measures, free cash flow coverage, share-count movement, leverage trend, capital return quality, confidence level, and analyst follow-up action.
The MCP run can first show raw period-level evidence for an individual company before moving into the calculated comparison layer. This helps analysts see the underlying cash flow, buyback, dividend, debt, and share-count data used in the classification.
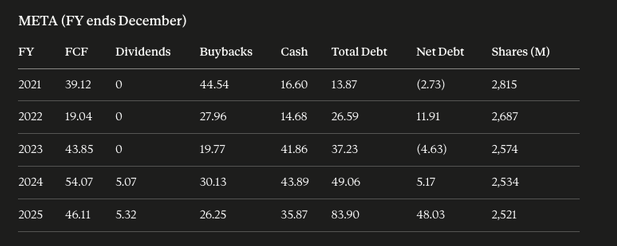
Caption: Example raw period-level output for META, showing FCF, dividends, buybacks, cash, debt, net debt, and share count across fiscal years. Values reflect one MCP run and may change as new filings or updated datasets are added.
The next layer converts raw period-level data into payout, buyback yield, total shareholder yield, FCF coverage, share-count change, and net debt movement. This is the bridge between raw FMP data and the final capital return quality classification.
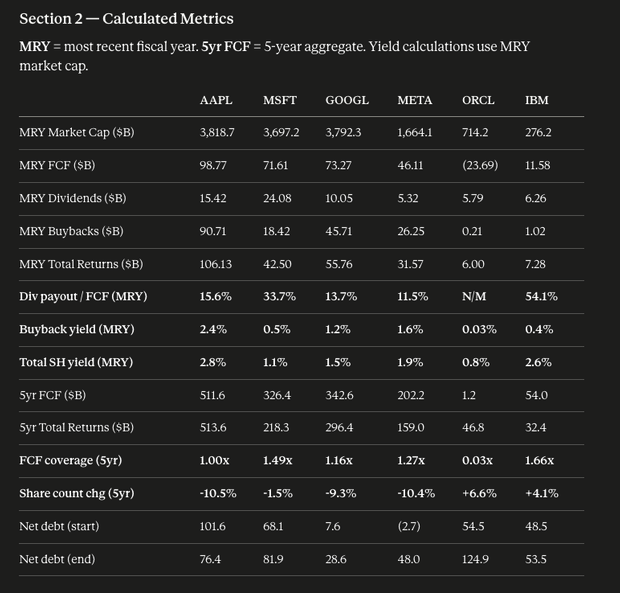
Caption: Example calculated capital return quality metrics across the watchlist. The table shows how Claude converts raw cash flow, market value, share-count, and balance sheet fields into the indicators used for classification.
The table below reproduces the final classification layer from the Claude/FMP MCP run. The values, classifications, and confidence levels reflect the data available at the time of analysis and may change as new filings or updated FMP datasets become available.
|
Company |
Reporting period |
Dividend payout (latest FY) |
Buyback yield (latest FY) |
Total shareholder yield (latest FY) |
FCF coverage (latest FY) |
Share count change (5yr) |
Leverage trend |
Capital return quality |
Confidence |
Analyst follow-up action |
|
AAPL |
FY2021-FY2025 |
15.6% |
2.38% |
2.78% |
0.93 |
-10.5% |
Improving (net debt/EBITDA 0.83 → 0.53) |
High quality |
High |
Watch buyback pace versus FCF as AI capex ramps; coverage dipped just under 1.0x twice. |
|
MSFT |
FY2021-FY2025 |
33.7% |
0.50% |
1.15% |
1.69 |
-1.5% |
Rising (net debt +20%, capex-driven) |
Sustainable |
High |
Confirm rising debt is funding capex rather than distributions; coverage remains above 1.2x throughout. |
|
GOOGL |
FY2021-FY2025 |
13.6% |
1.21% |
1.47% |
1.32 |
-9.3% |
Rising from a very low base |
High quality |
High |
The dividend has only two years of history; monitor the payout trajectory as it scales. |
|
META |
FY2021-FY2025 |
11.5% |
1.58% |
1.90% |
1.46 |
-10.4% |
Rising sharply (net cash → $48B net debt, mostly in 2025) |
Mixed |
High |
FY2021-FY2022 buybacks exceeded FCF and were funded from cash reserves; confirm that 2025 debt issuance is earmarked for capex rather than distributions. |
|
ORCL |
FY2022-FY2026 |
0.81% |
0.03% |
0.84% |
N/M — FCF negative in FY2025 and FY2026 |
+6.6% (dilutive) |
Rising sharply (net debt +129%, equity thin) |
Debt-supported |
Medium (2 of 5 years FCF-negative) |
Priority review: capital returns in FY2025-FY2026 are not covered by FCF, share count is rising rather than falling, and program sustainability needs confirmation if FCF remains negative. |
|
IBM |
FY2021-FY2025 |
54.3% (2025) / 51.7% (2024) |
0.37% |
2.63% |
1.59 |
+4.1% (dilutive) |
Slightly rising (2025 acquisition-driven) |
Mixed |
High |
Buybacks are token-sized and do not offset stock-based compensation dilution; confirm whether this reflects a deliberate dividend-priority policy. |
Interpreting Claude's Output
The final classification table separates the watchlist into several capital return patterns. These categories connect the raw cash flow, share-count, market-value, and leverage evidence with the final capital return quality assessment.
The classifications should not be read as investment rankings or permanent labels. They reflect one Claude/FMP MCP run and should be refreshed as new annual filings, share-count data, and capital return activity become available.
High-Quality Share Reducers
AAPL and GOOGL were classified as High quality because free cash flow broadly supported capital returns, shares outstanding declined materially across the review period, and leverage remained manageable.
AAPL reduced its share count by 10.5%, while GOOGL reduced its share count by 9.3%. Both companies also maintained positive free cash flow coverage in the latest fiscal year. The main follow-up is whether buyback and dividend activity remains supported as capital expenditure and investment requirements increase.
Sustainable but Limited Share Reduction
MSFT was classified as Sustainable. Free cash flow coverage remained strong, and the share count declined slightly over the five-year period. However, the reduction was limited compared with AAPL and GOOGL.
The interpretation is therefore not that the buyback program is ineffective. It is that part of the repurchase activity may be offsetting stock-based compensation or issuance rather than producing a larger reduction in the ownership base. Analysts should also confirm that rising debt continues to support capital expenditure rather than shareholder distributions.
Mixed Returns
META and IBM were classified as Mixed, but for different reasons.
META produced meaningful share-count reduction and maintained positive latest-year free cash flow coverage. However, earlier buybacks exceeded free cash flow, and leverage increased sharply in the latest period. The main review question is whether recent debt issuance is tied to infrastructure investment rather than capital returns.
IBM maintained positive free cash flow coverage, but its share count increased over the review period. Buybacks were too small to offset dilution, while the company continued to prioritize dividends. The follow-up is whether this reflects a deliberate dividend-first capital allocation policy.
Debt-Supported Returns
ORCL was classified as Debt-supported. Free cash flow was negative in two of the five reviewed years, net debt increased materially, and the share count rose rather than declined.
The classification does not imply that every dividend or buyback was directly funded with debt. It indicates that capital returns continued while free cash flow weakened and leverage increased, requiring closer review of funding sources, capital expenditure needs, and program sustainability.
The output shows why capital return quality cannot be judged from dividend yield or repurchase spending alone. The stronger signal comes from combining free cash flow coverage, share-count movement, leverage direction, and the source of funding behind capital returns.
Enterprise Use Cases and Analyst Review Triggers
Capital return quality analysis is useful wherever teams need to separate shareholder-friendly activity from financially stretched capital allocation. It can support equity research, portfolio monitoring, management quality review, and shareholder yield screening.
For research teams, the model helps compare companies that all return capital but do so with different levels of financial support. One company may reduce share count through FCF-funded buybacks. Another may maintain dividends while buybacks mainly offset dilution. A third may continue capital returns while leverage rises or free cash flow weakens.
For portfolio teams, this creates a repeatable monitoring layer. Instead of only tracking dividend yield or buyback announcements, teams can check whether capital returns remain covered by free cash flow, whether the share count is moving in the right direction, and whether debt is becoming part of the funding story. This also helps identify cases where reported profitability looks stable, but cash flow support weakens underneath.
Analyst Review Triggers
The system should flag a company for review when:
|
Trigger |
Why it matters |
|
Buybacks are high but share count does not fall |
Repurchases may be offsetting dilution rather than creating ownership reduction |
|
Capital returns exceed free cash flow |
The program may depend on cash reserves, borrowing, or weaker reinvestment flexibility |
|
Debt rises while returns continue |
Buybacks or dividends may be competing with balance sheet discipline |
|
Dividend payout remains high during FCF pressure |
The dividend may be durable, but the margin of safety is narrowing |
|
Capex or acquisitions rise sharply |
Management may be prioritizing growth investment while still maintaining shareholder returns |
|
Data quality issues appear |
Classification should be reviewed before using the output in an investment process |
|
Calculated metric cannot be supported |
If required source fields are missing, stale, or not aligned to the same reporting period, FCF coverage, buyback yield, total shareholder yield, or related calculations should be marked as review required rather than forced. |
These triggers do not mean the capital return program is automatically weak. They tell analysts where the numbers need context from valuation, management commentary, capital needs, refinancing plans, and the company's long-term strategy. That makes capital return quality a useful layer within broader financial health analysis, especially when shareholder returns may be competing with reinvestment or balance sheet flexibility.
From Shareholder Yield to Shareholder Return Quality
Capital return analysis becomes more useful when it moves beyond the headline amount of dividends and buybacks.
A strong capital return program is not just large. It is supported by free cash flow, produces real share count reduction, and does not weaken the balance sheet. A weaker program may still return cash, but the return can be diluted by rising share count, borrowing needs, or pressure from capex and acquisitions.
With FMP connected inside Claude through the MCP server, this review becomes easier to repeat. Claude can retrieve the required financial datasets, align the evidence across periods, calculate the main quality indicators, and classify each company for analyst review. Teams that want to run this type of capital return quality review across larger watchlists can review the available FMP pricing plans based on their data coverage, API usage, and research needs.
The classification should be read as a research label for follow-up review, not as a buy, sell, avoid, outperform, or underperform recommendation.
The value is not in treating the classification as a final answer. The value is in surfacing the right questions faster: what funded the return, did shareholders receive real ownership reduction, and is the balance sheet still supporting the policy?






