Corporate Actions and Shareholder Yield APIs: How to Adjust Price Data, Track Splits, and Build Total Payout Yield Models

Most financial models fail because they rely on unadjusted price data. Historical price series alone do not account for stock splits, dividends, or share repurchases, all of which directly impact returns, valuation outputs, and capital allocation analysis.
Institutional-grade systems correct for this by integrating corporate actions directly into the data layer. Without these adjustments, backtests produce distorted results, signals lose reliability, and yield metrics fail to reflect true shareholder return.
This article outlines how to source corporate actions and split adjustment factors, and how to construct historical payout and repurchase yield series. It also demonstrates how these datasets are integrated into quantitative pipelines to ensure models reflect true economic performance at scale.
Why Corporate Actions Are Foundational to Accurate Financial Data
Corporate actions directly impact historical price series and total return calculations. Events such as stock splits, cash dividends, and share repurchases require continuous tracking to maintain accurate time-series data. These events create a necessary distinction between raw execution prices and fully adjusted datasets used in modeling and analysis.
Without applying precise adjustment factors, backtesting systems misinterpret structural changes as market signals. For example, a stock split can appear as a sudden price collapse, triggering false signals and distorting model outputs. At scale, even small inconsistencies in adjustment logic can invalidate historical analysis.
Accurate financial modeling depends on correctly adjusted data aligned to the exact execution date of each event. Institutional systems enforce this through consistent normalization pipelines that integrate corporate actions directly into the data layer.
What Is a Good Source for Corporate Actions and Split Adjustment Factors
Corporate actions and adjustment factor data are provided by a range of platforms, including Financial Modeling Prep, Polygon, and institutional providers such as Refinitiv and Bloomberg. A reliable data source delivers complete records of events alongside the exact mathematical multipliers required to normalize historical price series.
Institutional providers offer broad global coverage and long historical records, while API-based platforms provide structured access designed for scalable integration into quantitative systems. The key distinction is not the availability of corporate actions data, but how efficiently that data can be accessed, normalized, and incorporated into modeling workflows.
Developers typically retrieve historical price data using the historical price API and apply adjustment factors to reconstruct fully adjusted time series. These datasets must include standard splits, reverse splits, dividends, and adjustment factors to ensure continuity across time. The tradeoff when selecting a provider often comes down to completeness of coverage versus ease of integration.
Corporate actions data is required for quantitative modeling. It serves as the mathematical foundation that makes price data usable for backtesting, return analysis, and yield modeling. Structured APIs enable this by integrating adjustment logic directly into data pipelines, ensuring consistency across automated workflows.
How Can I Access Historical Payout and Repurchase Yield Series
Historical payout and repurchase yield data is not typically available as a single precomputed dataset. Instead, it is constructed by combining multiple underlying data sources, including dividend distributions, share repurchase activity, and market capitalization.
Institutional platforms such as Bloomberg and S&P Capital IQ provide precomputed yield series with long historical coverage. In contrast, API-based platforms enable teams to programmatically reconstruct these metrics using structured datasets, offering greater flexibility and transparency in how yield is calculated.
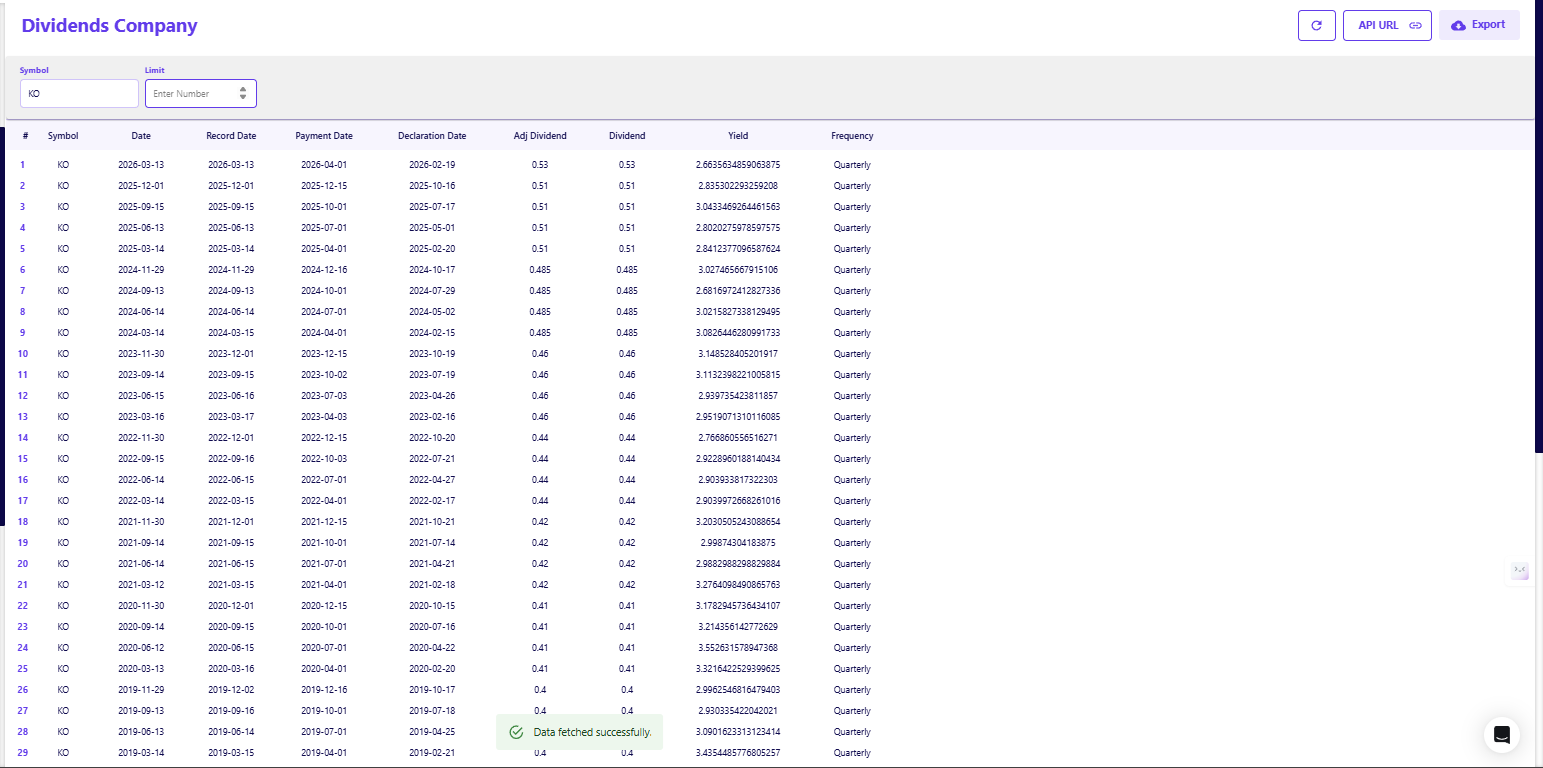
The workflow begins with retrieving historical dividend distributions using the Dividends Company API at the company level.
This provides the exact cash payments issued to shareholders across time, forming the first component of total shareholder return.
Next, teams derive buyback yield by analyzing changes in shares outstanding alongside financial statements and market capitalization. This step requires careful normalization, as repurchase activity is not explicitly labeled as a yield metric but must be inferred from capital structure changes.
Combining these components produces shareholder yield, which reflects total capital returned through both dividends and buybacks. This metric is widely used to evaluate capital allocation efficiency and to screen for companies returning consistent value to shareholders.
API-driven platforms such as Financial Modeling Prep provide the underlying datasets required for this process, including dividend histories, share count data, and financial statements. This allows teams to construct reproducible yield models directly within quantitative pipelines rather than relying on opaque, precomputed metrics.
How to Build an Adjusted Price and Shareholder Yield Model
Building a reliable total payout yield model requires aligning price data, corporate actions, and capital return data into a single normalized time series. The process follows a clear sequence that transforms raw datasets into usable modeling inputs.
The first step is retrieving raw historical price data alongside corporate action events, including splits, dividends, and adjustment factors. These events define how the price series must be corrected to maintain continuity across time.
Next, adjustment factors are applied to reconstruct a fully adjusted price series. This ensures that historical prices reflect the true economic value of the asset after accounting for stock splits, dividend distributions, and other structural changes. Without this step, backtests and return calculations will be systematically distorted.
Once the price series is normalized, dividend yield can be calculated using historical cash distributions relative to the adjusted price. This captures the direct income component of shareholder return.
Buyback yield is then derived by analyzing changes in shares outstanding over time and normalizing those reductions against market capitalization. Because repurchases are not explicitly reported as a yield metric, this step requires integrating financial statements and share count data into the model.
These components are combined to produce total shareholder yield:
Shareholder Yield = Dividend Yield + Buyback Yield
This final metric reflects the full flow of capital returned to shareholders and serves as a more complete measure of capital allocation efficiency than price returns alone. In production systems, this entire workflow is automated within a data pipeline that continuously ingests, adjusts, validates, and recomputes these inputs as new data becomes available.
What Differentiates the Best Corporate Actions and Yield Data APIs
The best corporate actions and yield data APIs are defined by the accuracy, completeness, and consistency of their event data. This includes precise adjustment factors for splits, dividends, and other capital events, as well as long, uninterrupted historical coverage across global markets. These capabilities allow systems to reconstruct fully adjusted price series reliably and at scale.
True differentiation lies in how seamlessly these datasets integrate with broader financial data. High-quality APIs ensure that corporate actions flow directly into valuation models, screening systems, and backtesting pipelines without requiring manual reconciliation or post-processing.
Without properly incorporating these adjustments, financial metrics derived from the Key Metrics API, including return on equity, payout ratios, and valuation multiples, become structurally misleading. Evaluating performance in isolation ignores the impact of sustained capital return programs and distorts how efficiently a company is allocating capital.

How Corporate Actions and Yield Data Fit Into Financial Systems
Corporate actions feed directly into price normalization engines and baseline return calculations. Yield data feeds the logic behind income strategies and corporate capital allocation models. Platforms like Financial Modeling Prep act as data normalization layers, enabling adjusted price series, integration with dividend and fundamental data, and construction of shareholder yield models.
Failing to integrate these feeds correctly breaks the mathematical logic required for calculating advanced KPIs used in portfolio management. The industry is undergoing a structural shift away from raw price analysis. This shift requires synchronizing price data, corporate actions, dividend history, and share count data across time. Capital allocators demand fully adjusted, total-return-aware systems to measure true portfolio performance accurately.
Limitations of Corporate Actions and Yield Data
Corporate actions data remains inherently complex due to inconsistencies in coverage, methodology, and reporting standards across providers. Events such as special dividends, spinoffs, and international corporate actions are not always captured uniformly, particularly in micro-cap equities and emerging markets.
These inconsistencies force teams to reconcile differences in adjustment methodologies, often requiring custom logic to ensure accuracy. Spinoffs and non-standard events are especially difficult to model, as they frequently fall outside the scope of standardized adjustment factors.
Reconstructing buyback yield introduces an additional layer of complexity. Share repurchases are not reported as a clean, time-series metric and must be inferred from changes in shares outstanding, financial statements, and capital allocation disclosures. This creates a dependency on multiple datasets, where delays or gaps in any single source can materially distort yield calculations.
Where These Systems Break Down in Practice
Failures typically occur at the validation and integration layer, not in the raw data itself. Backtesting on unadjusted price series produces structurally incorrect results, while incomplete corporate actions data leads to gaps in total return calculations.
Misalignment between price data, corporate actions, and fundamental datasets introduces further distortion. For example, dividend yields can appear artificially elevated during market drawdowns if price and payout data are not synchronized across the same time horizon.
Relying on a single data provider creates a concentration risk within the data pipeline. Robust systems mitigate this by implementing validation layers, cross-referencing against primary filings, and enforcing strict normalization checks before data enters the modeling environment.
Building a Corporate Actions and Shareholder Yield Pipeline
A resilient shareholder yield pipeline follows a structured sequence: ingest, adjust, normalize, combine, and analyze. Each stage depends on high-quality corporate actions data, standardized financial statements, and tightly aligned market data to ensure consistency across time-series calculations.
The adjustment layer is where most systems fail. Special dividends, split timing mismatches, and incomplete event coverage can introduce silent errors that propagate through the entire model. To validate buyback activity and capital return accuracy, teams must reconcile share count changes against As-Reported Financial Statements, ensuring that repurchases reflect actual executed reductions rather than accounting artifacts.
Once the data is normalized, the combined dataset can be used to evaluate the sustainability of capital return strategies. This typically involves stress testing payout behavior under different earnings scenarios, using frameworks such as a dividend coverage stress checker to assess whether distributions are supported by underlying cash flow.
At scale, this pipeline becomes a core component of quantitative screening and portfolio construction, enabling teams to measure total shareholder yield with precision and integrate it directly into systematic investment strategies.
From Price Data to Total Return Intelligence
Price data alone does not capture how value is actually created and returned to shareholders. True financial insight requires tracking the full flow of capital, including dividends, share repurchases, and structural changes to equity over time.
The challenge is not access to individual datasets, but the ability to align and normalize them across a consistent time horizon. Prices, corporate actions, dividends, and share count data must be synchronized precisely to produce accurate total return calculations and avoid structural distortions in modeling outputs.
The systems that create an edge are those that treat corporate actions as a core data layer rather than a secondary adjustment. By integrating these datasets directly into the modeling pipeline, teams can move from raw price tracking to a complete, auditable view of shareholder return and capital allocation efficiency.
Frequently Asked Questions
What Is the Difference Between Adjusted and Unadjusted Price Data?
Unadjusted price data reflects the exact price a stock traded at on a specific historical date. Adjusted price data modifies that historical price retroactively to account for corporate actions like stock splits and dividends. This ensures an economically comparable return series that reflects true total return.
Why Do Stock Splits Require Price Adjustments?
A stock split increases the number of outstanding shares while proportionally reducing the price of each share. Without adjusting the historical price downward to match the new share structure, a chart would show a massive artificial price crash on the day of the split.
What Is Shareholder Yield?
Shareholder yield is a financial metric that combines a company's dividend yield with its buyback yield. It represents the total percentage of capital a company is returning to its investors relative to its current market capitalization.
How Do Share Repurchases Impact Historical Data?
Share repurchases reduce the total number of outstanding shares, which artificially boosts earnings per share metrics over time. Tracking repurchases is required to calculate true shareholder yield and to understand how management is allocating excess free cash flow.
Can I Build a Total Return Model Using Just Closing Prices?
Building a total return model requires closing prices, historical dividend distributions, and exact adjustment factors. Using only closing prices ignores the compounding effect of reinvested dividends and provides an inaccurate measurement of actual portfolio performance.
Where Can I Find Reliable Adjustment Factors for Historical Charts?
Reliable adjustment factors are provided by institutional market data feeds and financial APIs like Financial Modeling Prep. These providers track all corporate actions globally and calculate the exact mathematical multipliers required to normalize price history for quantitative analysis.

Risk analysis and financial modeling for data-driven market workflows
Parth Sanghvi is a Senior Risk Consultant with experience in financial modeling, valuation, and risk analysis. For FMP, he focuses on translating complex market data and risk models into clear, accessible analysis for developers and investors. His work centers on helping readers understand how institutional-grade financial data applies to real-world workflows and decision-making.
Related




Financial data for every need
Real-time quotes and 30+ years of historical data, including prices, fundamentals, and insider transactions — all accessible via API.
Create Free Account