How to Check Financial Data Coverage Against Your Target Equity Universe

A financial research platform already has its equity screening and valuation models running on US stocks. The team now wants to expand into Canada, Europe, Japan, and India, giving users access to the same research tools across a much larger universe of companies.
The challenge is getting international financial data to work with the models already in place. A company might have several years of financial statements available, but its reporting periods or currencies could differ from those used in the platform's existing calculations. Even identifying the right stock takes some care when a company trades on multiple exchanges.
We'll explore how to assess this using FMP Data. We'll start with a target universe of 90 equity listings across six market groups, then examine the financial statements and historical prices for 18 selected securities to understand how well FMP's coverage meets the platform's research requirements.
Key Takeaways
- Financial data coverage should be assessed against the stocks and datasets your research platform actually needs. In our assessment, FMP recognized all 90 target equity listings across six market groups.
- In our sample, 16 of the 18 securities had annual records where the filing date equals the fiscal period-end date, so those dates can't show when results became public.
- Working with international equities requires accounting for multiple listings, reporting currencies, fiscal-year differences, and local trading calendars to keep financial comparisons consistent.
- Historical backtesting requires reliable financial reporting dates to avoid look-ahead bias. In the assessment, 16 of the 18 sampled securities showed reporting-date patterns that required further verification.
What Is Financial Data Coverage, and Why Does It Matter?
We'll stick with the research platform from the introduction as we work through this article.
One of our platform's screening models tracks how a company's operating margins have changed over the last five years. To do this, it needs annual revenue and operating income for each company, with the figures matched to the correct fiscal periods.
Now, let's take Toyota (7203.T), which we want to add to the screener. Finding its listing on the Tokyo Stock Exchange is straightforward, but we also need five consecutive years of financial data to calculate its operating margin trends. Toyota's fiscal year ends in March, so its reporting periods need to be handled correctly when comparing its performance with companies that follow a December year-end.
This is where financial data coverage comes into play. It measures how well a provider's available securities, financial fields, and historical records meet the requirements of a particular research workflow. A stock might be available through an API, but if its financial history is incomplete, our five-year screening model won't be able to analyze it consistently.
The platform's valuation tools have their own requirements, including historical stock prices for the correct exchange listing. We'll account for these different needs as we assess FMP's coverage across our international equity universe.
How to Check Financial Data Coverage for Your Equity Universe
We'll start by putting together a list of stocks that our research platform wants to support. It's better to do this before looking at a provider's available symbols, since building the universe from the provider's own directory would tell us very little about which of our target companies are missing.
For this example, I've selected 90 equity listings across six markets, with 15 each from the United States, Canada, the United Kingdom, Continental Europe, Japan, and India. The list includes companies such as W.W. Grainger, Shopify, AstraZeneca, SAP, Toyota, and Infosys. I've also included different listings of the same company, since our platform may need to handle both local shares and US-listed ADRs.
Checking every financial record for all 90 listings would make this a much larger exercise, so we'll assess coverage at two levels. First, we'll check whether FMP recognizes all 90 securities and their respective exchange listings. Then we'll take 18 of them, three from each market group, and examine their financial statements and historical prices in more detail.
What Financial Data Should You Check Before Choosing a Provider?
Our platform uses historical fundamentals to compare company performance and daily market prices for valuation. We'll use five years of annual financial statements and two years of historical prices as our minimum requirements.
Here's what we'll check using FMP's APIs:
|
Data Category |
What We'll Check |
|
Company and listing information |
Company identity, stock symbol, exchange, and security type |
|
Income statements |
Five annual periods with revenue, operating income, and net income |
|
Balance sheets |
Five annual periods with total assets, total debt, and stockholders' equity |
|
Cash-flow statements |
Five annual periods with operating cash flow and capital expenditure |
|
Historical stock prices |
Daily closing prices from October 1, 2024, to September 30, 2026 |
|
Reporting information |
Fiscal periods, reporting currencies, filing dates, and acceptance dates |
These requirements come from the platform's existing research models. For instance, calculating five-year operating margin trends requires revenue and operating income for each annual period. A stock with only three years of those figures would leave gaps in the analysis, even if its latest financial statements are available.
We'll use the same requirements for every company in the detailed sample, while accounting for differences in fiscal years, currencies, and exchange trading calendars. This gives us a consistent basis for comparing FMP's coverage across the selected markets.
Does a Supported Stock Ticker Mean the Financial Data Is Available?
With our 90-stock universe ready, we can start checking which companies FMP supports. We'll use the stock-list and financial-statement-symbol-list endpoints to look for each security, then check its company profile to confirm the exchange and other listing details.
All 90 listings appeared in both directories, and FMP returned company profiles for every one of them. The exchanges also matched our target universe, covering everything from Shopify on the Toronto Stock Exchange (SHOP.TO) and SAP on Xetra (SAP.DE) to Toyota on the Tokyo Stock Exchange (7203.T).
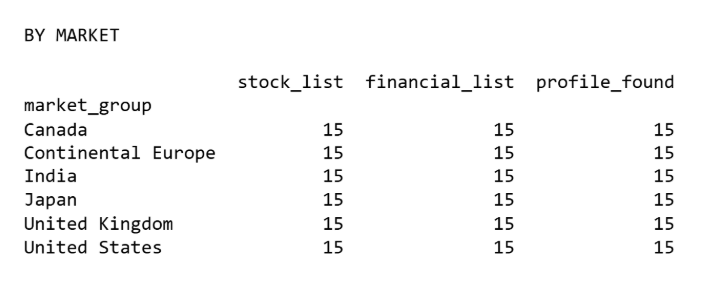
These results give us a good starting point, but there are a few details worth checking before bringing the securities into our research platform. One of them is how the provider identifies companies that trade on multiple exchanges.
How Do ADRs and Multiple Listings Affect Financial Data Coverage?
Novo Nordisk is a good example because it appears twice in our target universe. Its shares trade on the Copenhagen exchange under NOVO-B.CO, while its American Depositary Receipts (ADRs) trade on the NYSE under NVO.
Both listings represent the same underlying company, but they have different ISINs, trading currencies, and price histories. The Copenhagen shares trade in Danish kroner (DKK), while the US-listed ADRs trade in US dollars (USD). FMP recognizes both securities and returns their respective listing information.
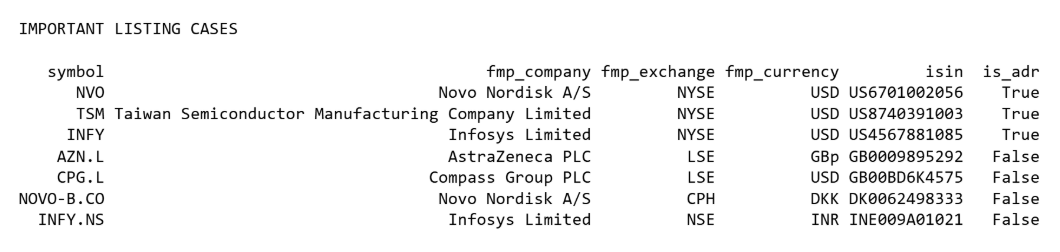
We see something similar with Infosys, which trades on India's National Stock Exchange as INFY.NS and has ADRs listed on the NYSE as INFY.
For our research platform, these distinctions matter when bringing financial statements and stock prices together. We want to use the company's financial fundamentals for issuer-level analysis while keeping the market data associated with the correct listing. Otherwise, we could end up counting the same company twice in a screener or combining financial metrics with prices from the wrong security.
FMP's symbol directories and company profiles give us the information needed to begin resolving these relationships. The remaining question is whether the recognized companies have enough historical financial data to support the five-year comparisons our platform needs.
How Much Historical Financial Data Do You Need for Equity Research?
Let's take the five-year operating margin analysis that our research platform already runs for US companies. To extend it to international stocks, we'll need revenue and operating income for five consecutive years, along with the corresponding fiscal periods. The same applies to other parts of the platform, where balance sheets provide information about a company's financial position and cash-flow statements help us understand how much cash the business generates.
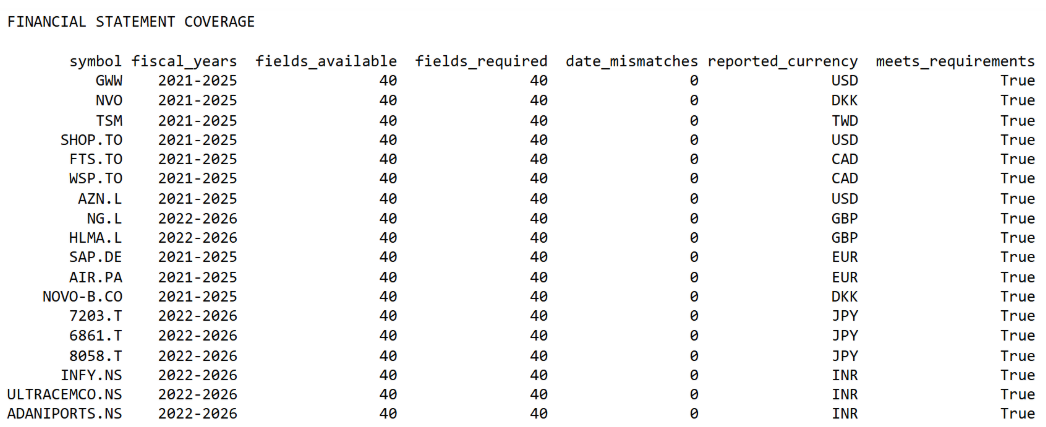
For our 18 selected securities, we retrieved annual financial statements using FMP's income-statement, balance-sheet-statement, and cash-flow-statement endpoints. Each company returned eight annual records for all three statements, giving us more than the five years required for our analysis.
We then checked eight financial fields across the latest five fiscal years, including revenue, operating income, total debt, and operating cash flow. All 18 securities had the required 40 field-year observations available, with no missing values in those fields or mismatched period-end dates between the three statements.
Why Do Fiscal Years Differ Across Global Companies?
Toyota and W.W. Grainger illustrate something we'll need to account for when comparing companies across markets. Toyota's latest annual financial statements in our sample cover the fiscal year ending March 31, 2026, while Grainger's cover the year ending December 31, 2025.
Both represent the latest completed annual periods available in our data, even though one is labelled FY2026 and the other FY2025. We found similar differences elsewhere in the sample, with some companies providing FY2021-FY2025 as their latest five periods and others providing FY2022-FY2026.
For our screening models, we can use each company's latest five fiscal years to calculate historical growth and profitability. If we need to compare performance over the same calendar period, however, we'll have to align the actual reporting dates rather than match companies using fiscal-year labels alone.
Do Stock Trading Currencies Match Financial Reporting Currencies?
Let's look at Shopify again. Its Toronto-listed shares (SHOP.TO) trade in Canadian dollars, but FMP returns its financial statements in US dollars. Novo Nordisk presents a similar situation with its NYSE-listed ADR (NVO), which trades in USD while the company's financial results are reported in Danish kroner.
AstraZeneca adds another detail. Its London-listed shares (AZN.L) are quoted in British pence (GBp), while its financial statements are reported in USD.
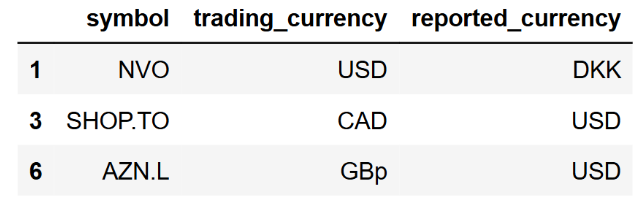
These differences matter when combining market data with financial fundamentals. For example, calculating Shopify's price-to-sales ratio using a CAD-denominated market capitalization and USD-denominated revenue would mix two currencies. We'd need to convert both values into the same currency first. For AstraZeneca, we'd also need to account for the difference between pence and pounds when working with its London share price.
FMP provides the trading and reporting currency information needed to identify these cases. Our platform can use that information to normalize financial values before calculating valuations across the international universe.
How to Evaluate Historical Stock Price Coverage Across Global Markets
With the financial statements covered, let's turn to historical prices. Our research platform needs daily prices to calculate stock returns, track valuation changes, and compare market performance across the companies in its universe.
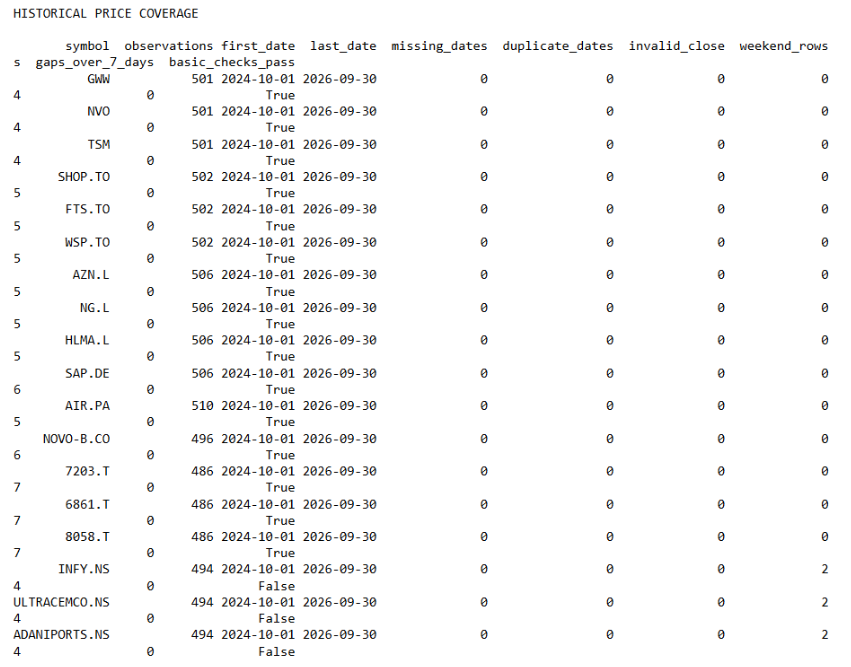
We retrieved two years of end-of-day (EOD) prices using FMP's historical-price-eod/full endpoint, covering October 1, 2024, through September 30, 2026. The number of observations varied across markets. W.W. Grainger (GWW) returned 501 trading days, Airbus (AIR.PA) returned 510, and Toyota (7203.T) returned 486, despite covering the same date range.
Why Do Global Stock Markets Have Different Numbers of Trading Days?
Stock exchanges follow different trading calendars, so historical price datasets covering the same period won't necessarily contain the same number of records. Each market has its own public holidays and trading schedules, and some exchanges occasionally open for special sessions outside regular weekdays.
We encountered an interesting example while checking the three Indian stocks in our sample: Infosys (INFY.NS), UltraTech Cement (ULTRACEMCO.NS), and Adani Ports (ADANIPORTS.NS).
Our initial checks found no missing dates, duplicate observations, or invalid closing prices. However, all three stocks had two price records falling on weekends, which initially flagged them for review.
Looking at the dates revealed that these were legitimate trading sessions. India's National Stock Exchange (NSE) opened on Saturday, February 1, 2025, and Sunday, February 1, 2026, for the Union Budget announcements. Both sessions were confirmed in the NSE's official 2025 circular and 2026 circular.
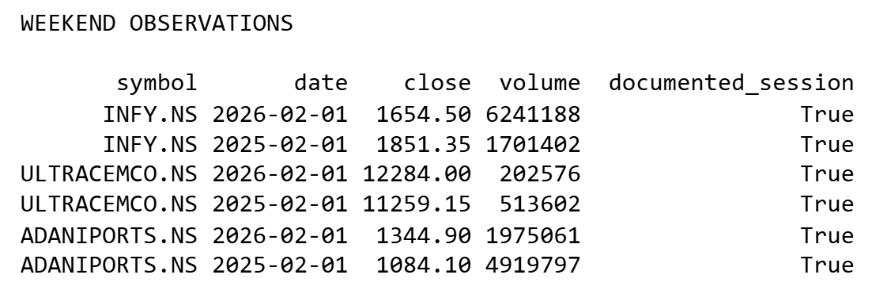
After accounting for these sessions, all 18 securities passed our basic historical price checks. We found no unexplained weekend observations, missing date values, duplicate dates, or invalid closing prices in the sample.
A complete coverage assessment would also compare each price series against its exchange's official trading calendar to identify any missing sessions. Our checks establish basic price-history integrity across the selected securities, rather than certifying that every expected trading day is present.
Why Financial Reporting Dates Matter for Historical Equity Research
Our platform now has the financial statements and historical prices needed for its international equity screener. However, if we want to test how that screener would have performed in the past, we also need to know when each company's financial results became available to investors.
For example, a company's 2025 financial statements might be available through an API today, but that doesn't mean the same information was available at the end of 2025. Using those figures in a historical simulation before their actual release could affect which stocks the model selects and how its performance is measured.
What Is the Difference Between a Fiscal Period-End Date and a Filing Date?
A fiscal period-end date marks the final day of the accounting period covered by a financial statement. A filing date refers to when the statement was formally submitted to the relevant authority, which may differ from the date the company first announced its results.
We examined these fields across the 270 annual statement records retrieved for our 18 securities. For 51 records, filingDate matched the company's US SEC filing date and acceptedDate carried the SEC's acceptance timestamp. For the other 218, filingDate equaled the fiscal period-end date. In 172 of these, acceptedDate showed 7:00 or 8:00 p.m. the previous day (midnight UTC on the period end, shown in US Eastern time), which is why 173 records show an acceptedDate before the period end. The remaining one is Adani Ports' FY2025 income statement, whose filingDate of March 30, 2025, falls a day before its period end. It's the only record where that happens.
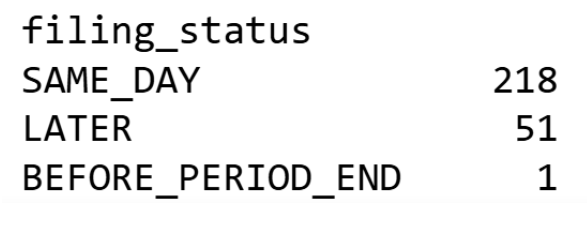
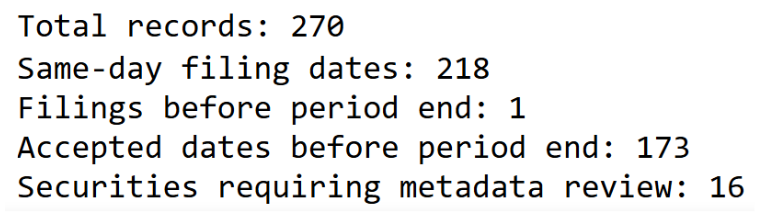
In every case we checked, a filingDate equal to the period end came 13 to 77 days before the company announced its results, so it can't be read as a filing date. The pattern followed the filing source, not the market. Toyota's NYSE-listed ADR (TM) shows its SEC filing date of June 10, 2026, while its Tokyo listing (7203.T) shows March 31, 2026.
Can Financial Reporting Dates Introduce Look-Ahead Bias?
Toyota provides a useful example from our sample. Its FY2026 financial statements cover the year ending March 31, 2026, and FMP returns that date for both the statement's date and filingDate fields.
However, Toyota announced its FY2026 results on May 8, 2026. Its official financial summary, also dated May 8, lists June 10, 2026, as the filing date of the financial statements.
FMP does return that June 10 date for Toyota's NYSE-listed ADR (TM). For a backtest, though, May 8 is the date that matters, because that's when the results became public.
Suppose our platform runs a historical screen as of April 15, 2026, ranking Japanese companies based on their latest annual operating margins. If it uses Toyota's FY2026 revenue and operating income at that point, the screen would be incorporating figures that Toyota had not yet announced.
This is known as look-ahead bias, where a backtest uses information that wasn't available at the historical point being simulated. It can distort historical rankings, trading signals, and reported strategy performance.
For point-in-time research, we'll need disclosure dates that reflect when the financial information was actually available, with appropriate treatment of later filings and revisions. In our sample, SEC filing dates are usable but conservative, since they arrive on or after the results announcement. Period-end dates aren't usable for this purpose. Announcement dates, such as those in FMP's Earnings Report API, are a closer match, though they should be checked against company disclosures.
How to Choose an Enterprise Financial Data API Based on Coverage
We've now tested FMP against the data requirements of our research platform, and the results are encouraging. All 90 target listings were recognized, while the 18 companies we examined in more detail had the financial statements and historical prices needed for our initial screening and valuation workflows.
Before expanding to the full universe, though, we'd need to check the remaining companies and investigate the reporting-date differences we found. We'd also need to consider how the platform will retrieve and maintain this data once users start relying on it every day.
Financial Data Coverage Assessment: Results Across 18 Securities
Here's the complete coverage assessment from our sample, including the financial statement checks, historical prices, and reporting metadata.
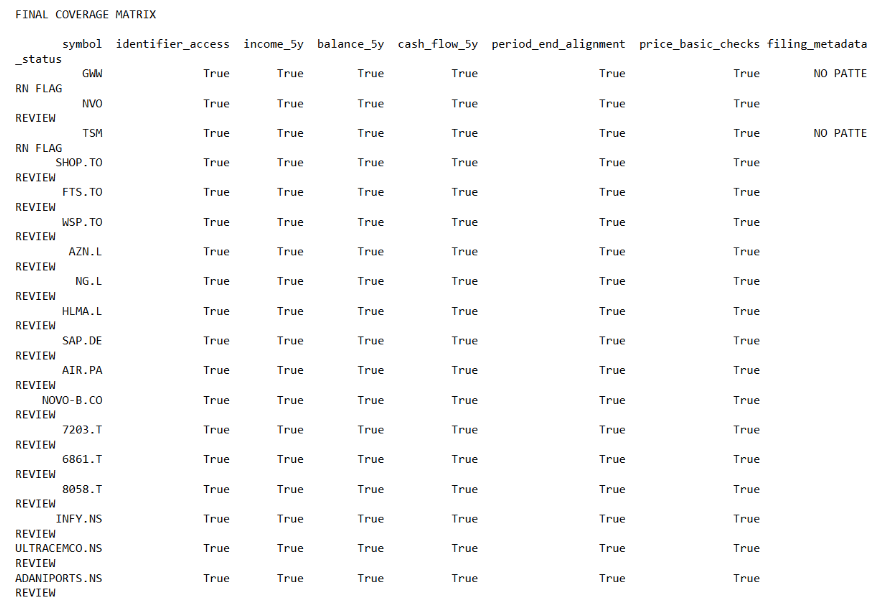
All 18 securities passed our basic financial and price coverage checks. However, 16 required further review of their reporting-date metadata, particularly if the data would be used for historical backtesting.
It's worth keeping the scope of these results in mind. We checked symbol availability across 90 listings, but the detailed financial and price assessments covered only 18. We'd need a larger sample, including smaller and less frequently traded companies, before making broader claims about coverage across these markets.
What Should Enterprises Look for in a Financial Data API?
The requirements change once a research platform moves into production.
For example, our analysis involved retrieving historical data for individual securities. Running the same workflow across thousands of stocks, with regular updates to prices and financial statements, would require a more structured ingestion process.
An enterprise financial data API should support the markets and historical datasets a platform needs, while offering enough request capacity and suitable delivery methods for its ingestion workload. The team would also need to understand how often the underlying data is updated, how revisions are handled, and what support is available when something goes wrong.
Licensing is another consideration, especially for platforms that display financial data to paying customers. Accessing data through an API doesn't necessarily grant permission to redistribute it through another product.
How Does FMP Enterprise Support Financial Data Infrastructure?
FMP offers enterprise solutions for companies that need financial data as part of their own applications, research systems, and data pipelines.
For the platform in our example, FMP Enterprise would be worth evaluating for its bulk and batch data delivery, historical financial datasets, and customizable API request capacity. These options become particularly relevant when regularly ingesting data across a larger equity universe rather than querying securities individually.
FMP also offers commercial arrangements for displaying and redistributing financial data, along with enterprise support for integration requirements. The available datasets, request limits, and permitted uses would need to be confirmed under the relevant commercial agreement.
With the coverage results already available, the platform has a useful starting point for that discussion. Instead of asking whether FMP supports international equities in general, the team can approach FMP with its actual security universe, required datasets, expected ingestion volumes, and the reporting-date requirements identified during testing.
From Financial Data Coverage to Enterprise-Ready Equity Research
One thing worth taking away from this exercise is that the same financial dataset can be suitable for one application and require further validation for another. Our five-year screening model has the financial information it needs across the securities we tested. A historical backtest, on the other hand, depends on knowing when that information was actually available to investors.
For our research platform, the next step is to extend these checks to the remaining securities and resolve the reporting-date questions before using the data in historical simulations. As the platform moves toward production, FMP Enterprise provides a way to discuss larger-scale data delivery, API access, and licensing based on how the product will use the data.
By this stage, the team has something much more useful than a general coverage figure. It knows which requirements have been met, which ones still need testing, and what to discuss with the provider before expanding its research tools.
Frequently Asked Questions
1. Does Financial Data Coverage Include Delisted Stocks?
It depends on the dataset and the provider. If you're building a historical equity screener or backtesting a strategy, you should include companies that were subsequently delisted to avoid survivorship bias. FMP provides a Delisted Companies API for identifying these securities, although historical financial statement and price availability should be checked separately.
2. Are Historical Stock Prices Adjusted for Splits and Dividends?
Historical stock prices can be split-adjusted, dividend-adjusted, or unadjusted, depending on the data source. These differences affect return calculations and backtesting results. FMP provides separate endpoints for dividend-adjusted and non-split-adjusted historical prices. Before using a price series, check which adjustments are applied and whether they match your analysis.
3. What Is the Difference Between Standardized and As-Reported Financial Statements?
Standardized financial statements organize financial data into consistent fields, such as revenue, operating income, and total assets, making it easier to analyze multiple companies. As-reported data preserves the financial information as presented in the company's original filings. FMP offers structured financial statement APIs alongside an As-Reported Financial Statements API. The appropriate choice depends on whether your analysis prioritizes consistent data fields or the original filing details.
4. Can You Compare Financial Data From Companies in Different Countries?
Yes, but international comparisons may require adjustments beyond currency conversion and fiscal-year alignment. Companies can report under different accounting standards, including IFRS and US GAAP, which may affect how certain financial items are recognized and measured. When building global screening models, check whether the selected metrics are comparable across companies and apply the necessary accounting adjustments.
5. Can FMP API Data Be Used in a Commercial Research Platform?
Yes, provided the commercial agreement covers the intended use. A standard API subscription does not automatically grant permission to display or redistribute financial data through a customer-facing application. FMP offers enterprise licensing options for businesses building financial products, dashboards, and research platforms. The agreement should specify the datasets, permitted users, data delivery methods, and display or redistribution rights.

Editorial strategy for financial data platforms and APIs
Amy Lyons leads content strategy at FMP, focusing on how financial data is structured, communicated, and translated into clear, usable insights. She builds editorial frameworks that connect product capabilities to real-world workflows. Her work focuses on supporting consistent, high-quality analysis across developer and analyst use cases.
Financial data for every need
Real-time quotes and 30+ years of historical data, including prices, fundamentals, and insider transactions — all accessible via API.
Create Free Account