FMP

Jungheinrich Aktiengesellschaft
JUN3.DE
XETRA
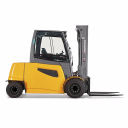
Jungheinrich Aktiengesellschaft, through its subsidiaries, manufactures and supplies products and solutions in the fields of warehousing and material handling equipment, automated systems, digital solutions, and matching services worldwide. It operates through Intralogistics and Financial Services segments. The Intralogistics segment develops, produces, sells, and rents new material handling equipment and warehousing equipment products; sale and short-term leasing of used trucks; and provides spare parts, as well as maintenance and repair services. The Financial Services segment engages in the sales financing and usage transfer of material handling and warehousing equipment products. The company's products portfolio includes pedestrian trucks, horizontal and vertical level order pickers, narrow aisle trucks, automated guided vehicles, stacker cranes, load handling equipment, reach trucks, stackers, tow tractors, low lift and double decker trucks, and electric drive trains, as well as pallet trucks; counterbalanced trucks; small-series and customized trucks; powertrain solutions; and electronic control units, lithium-ion batteries, and chargers. It also develops and distributes warehouse and fleet management systems, steering softwares for conveyor systems, and other digital solutions, as well as automation systems; and develops software solutions. The company distributes its products through its direct sales and service network, as well as through dealers. Jungheinrich Aktiengesellschaft was founded in 1953 and is headquartered in Hamburg, Germany.
35.52 EUR
0.24 (0.676%)

EBIT (Operating profit)(Operating income)(Operating earning) = GROSS MARGIN (REVENUE - COGS) - OPERATING EXPENSES (R&D, RENT) EBIT = (1*) (2*) -> operating process (leverage -> interest -> EBT -> tax -> net Income) EBITDA = GROSS MARGIN (REVENUE - COGS) - OPERATING EXPENSES (R&D, RENT) + Depreciation + amortization EBITA = (1*) (2*) (3*) (4*) company's CURRENT operating profitability (i.e., how much profit it makes with its present assets and its operations on the products it produces and sells, as well as providing a proxy for cash flow) -> performance of a company (1*) discounting the effects of interest payments from different forms of financing (by ignoring interest payments), (2*) political jurisdictions (by ignoring tax), collections of assets (by ignoring depreciation of assets), and different takeover histories (by ignoring amortization often stemming from goodwill) (3*) collections of assets (by ignoring depreciation of assets) (4*) different takeover histories (by ignoring amortization often stemming from goodwill)