FMP
Learn Financial Modeling (4/5): Discounted Cash Flow statement (DCF) Methodology
Sep 30, 2022
4. Calculate the Weighted Average Cost of Capital
Before we begin, I'd like to define WACC and discuss why we use it. The Weighted Average Cost of Capital (WACC) of a business measures its blended cost of capital.
Capital Cost is the minimum rate of return required for a business to generate value. Before a business can earn a profit, it must generate enough revenue to cover operation costs across all capitalization levels, including common stock, preferred stock, and debt. The cost of each type of capital is weighted according to its proportion of total capital and added together.
Many practitioners do not do this because preferred is not a frequently used capital structure component. Even if it is present, its worth is typically minimal. Nonetheless, you would want to include it from an academic standpoint.
You're probably wondering why we're using WACC to discount our cash flows. Bear in mind that this is an unlevered free cash flow analysis, which occurs before the interest payment. Earnings before interest (EBI) is before interest expense payment.
These cash flows are accessible to all capital providers, not just equity investors. If we had taken a levered free cash flow approach, the appropriate discount rate would have been equal to the cost of equity.
WACC takes into account all capital providers. To conduct an apples-to-apples comparison, we discount the cash flows back to the present using WACC. Now that we've established why we use WACC, let's tackle this section.
The first thing we're going to do is establish a reference price for the stock. Following that is the stock's beta value. When calculating the cost of equity, the beta will be used.
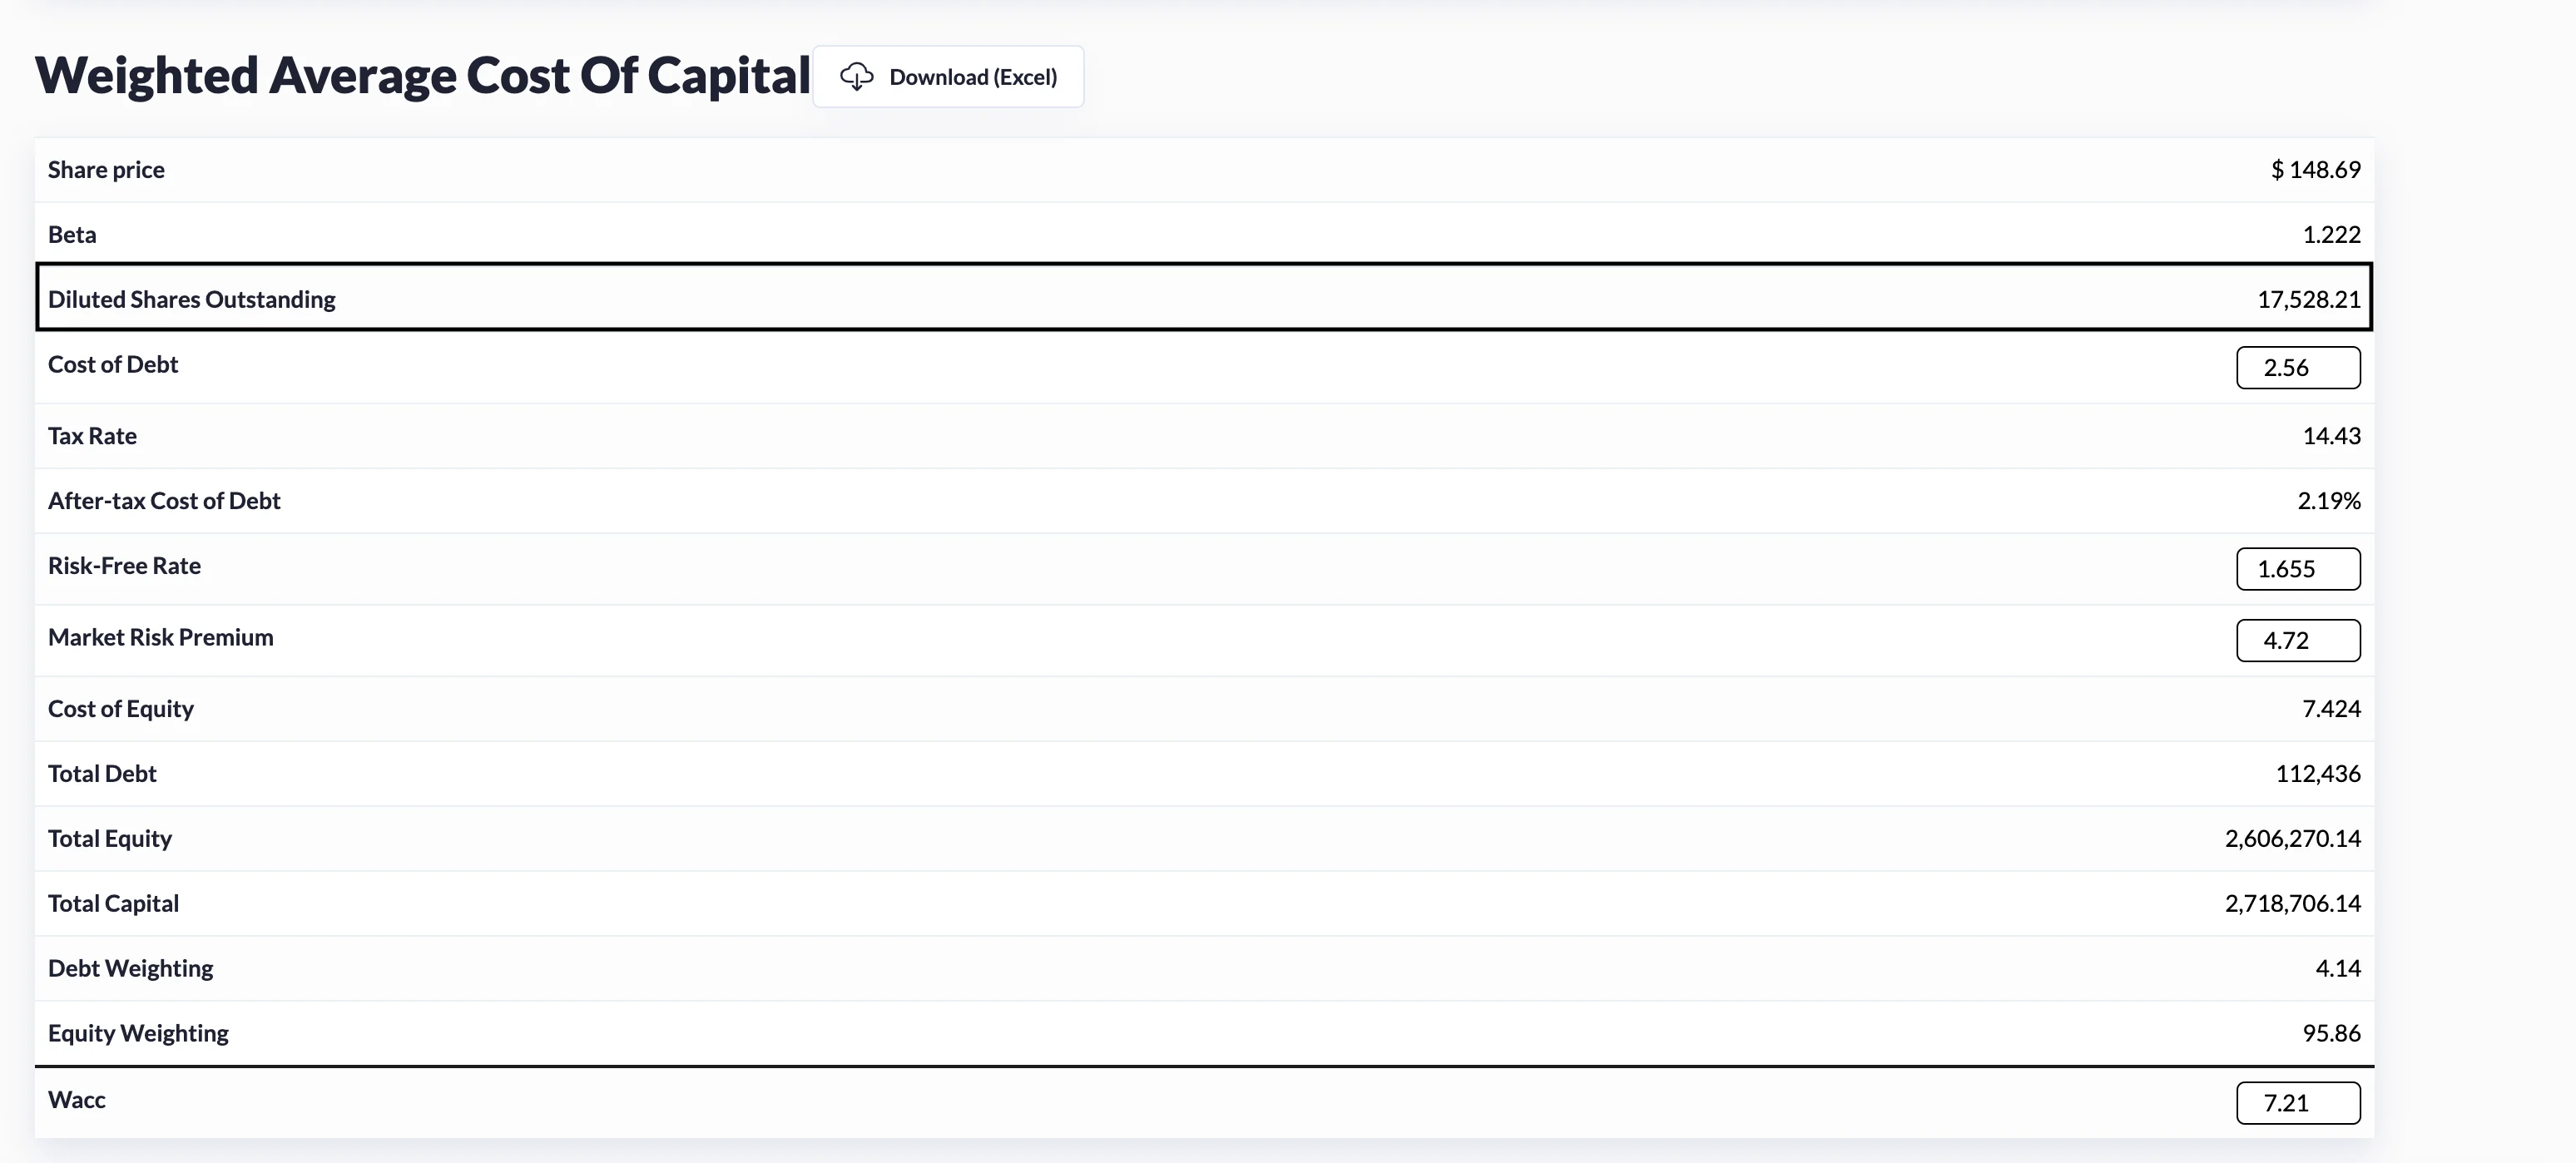
Following that is the diluted share count, which indicates the number of outstanding shares. What does a diluted share outstanding mean? A business has a basic share account, which is typically what you see on the front page of a listing. The number of diluted shares outstanding takes into account all ownership claims. These claims arise from in-the-money options warrants, convertible debt, or convertible preferred.
We want to account for all possible ownership claims, so the diluted share count is used. This figure is calculated using the income statement.
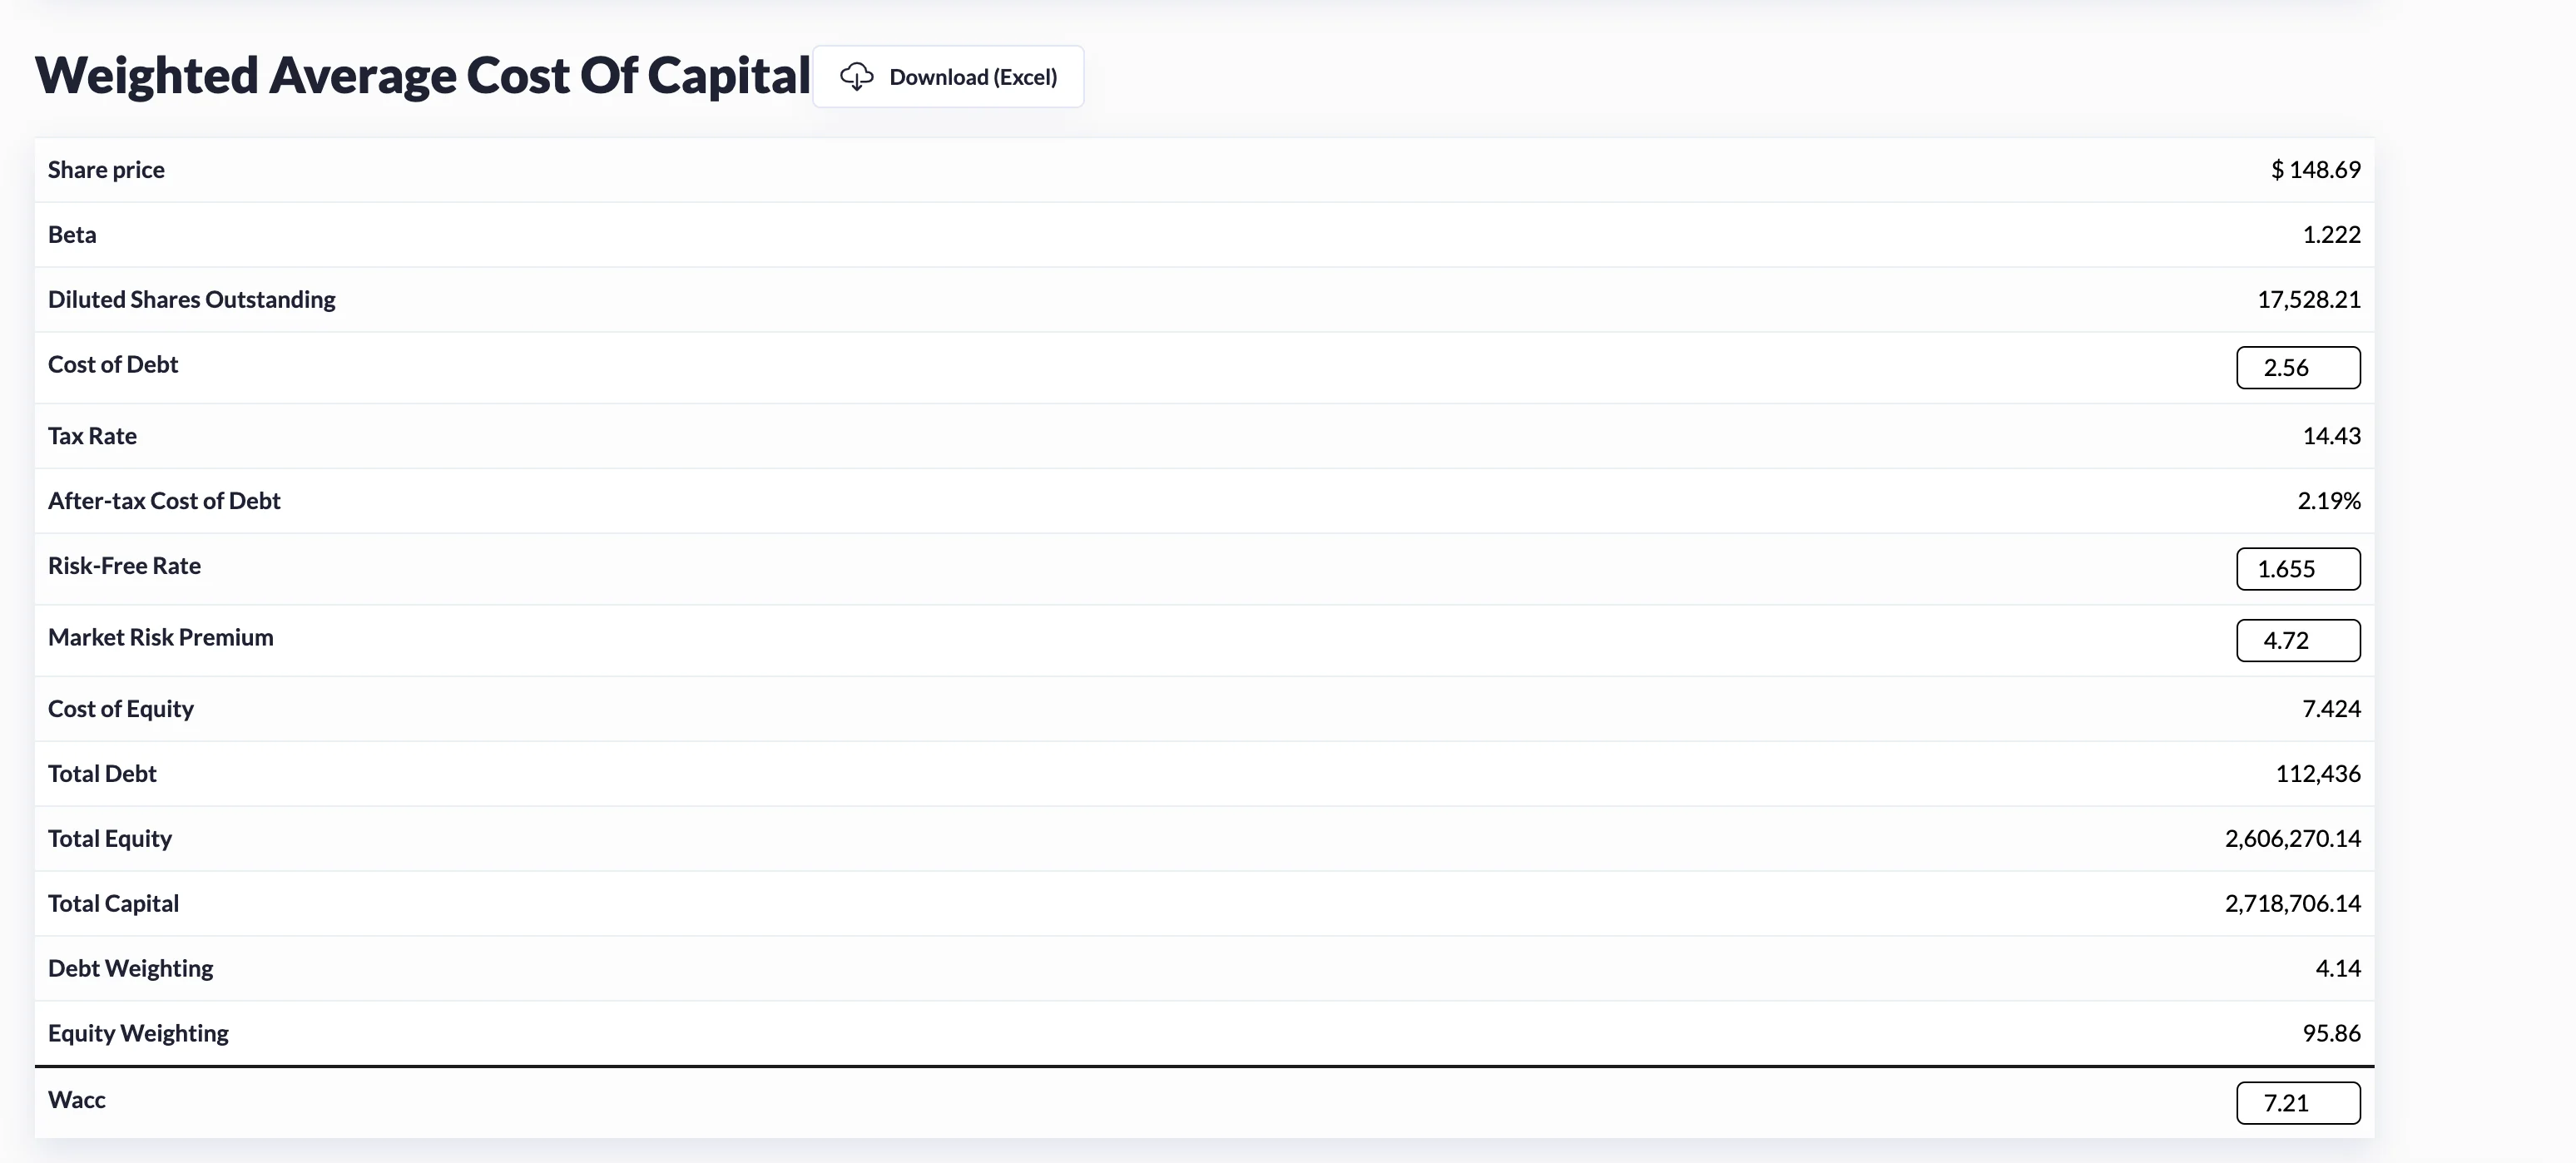
The after-tax cost of debt is the interest paid less any tax savings associated with subtracting interest expenses. To determine a company's after-tax cost of debt, subtract its effective tax rate from 1 and multiply the difference by the company's cost of debt.
Before-tax cost of debt x (100% - incremental tax rate) = After-tax cost of debt
The after-tax cost of debt varies according to a company's total tax rate. If profits are comparatively low, an organization will be subject to a much lower tax rate, increasing the after-tax cost of debt.
On the other hand, as the company's profits increase, it will face a higher tax rate, thus lowering its after-tax cost of debt.
On the other hand, the cost of equity is a highly debatable subject. Professors of business schools and practitioners frequently disagree on what the appropriate cost of equity should be. It is highly debatable when weighed against the cost of debt. With debt costs, you know exactly what you're getting (principle plus interest expense).
You don't know the cost of equity because it is a function of potential dividend payments and price appreciation. Several alternative costs of equity models include the Fama-French, dividend discount, and capital asset pricing models.
We will concentrate on the model that practitioners use, namely the capital asset pricing model. This model is defined as the risk-free rate multiplied by the beta of the market risk premium. For risk free rate we use the US Treasury Yield 10 YR
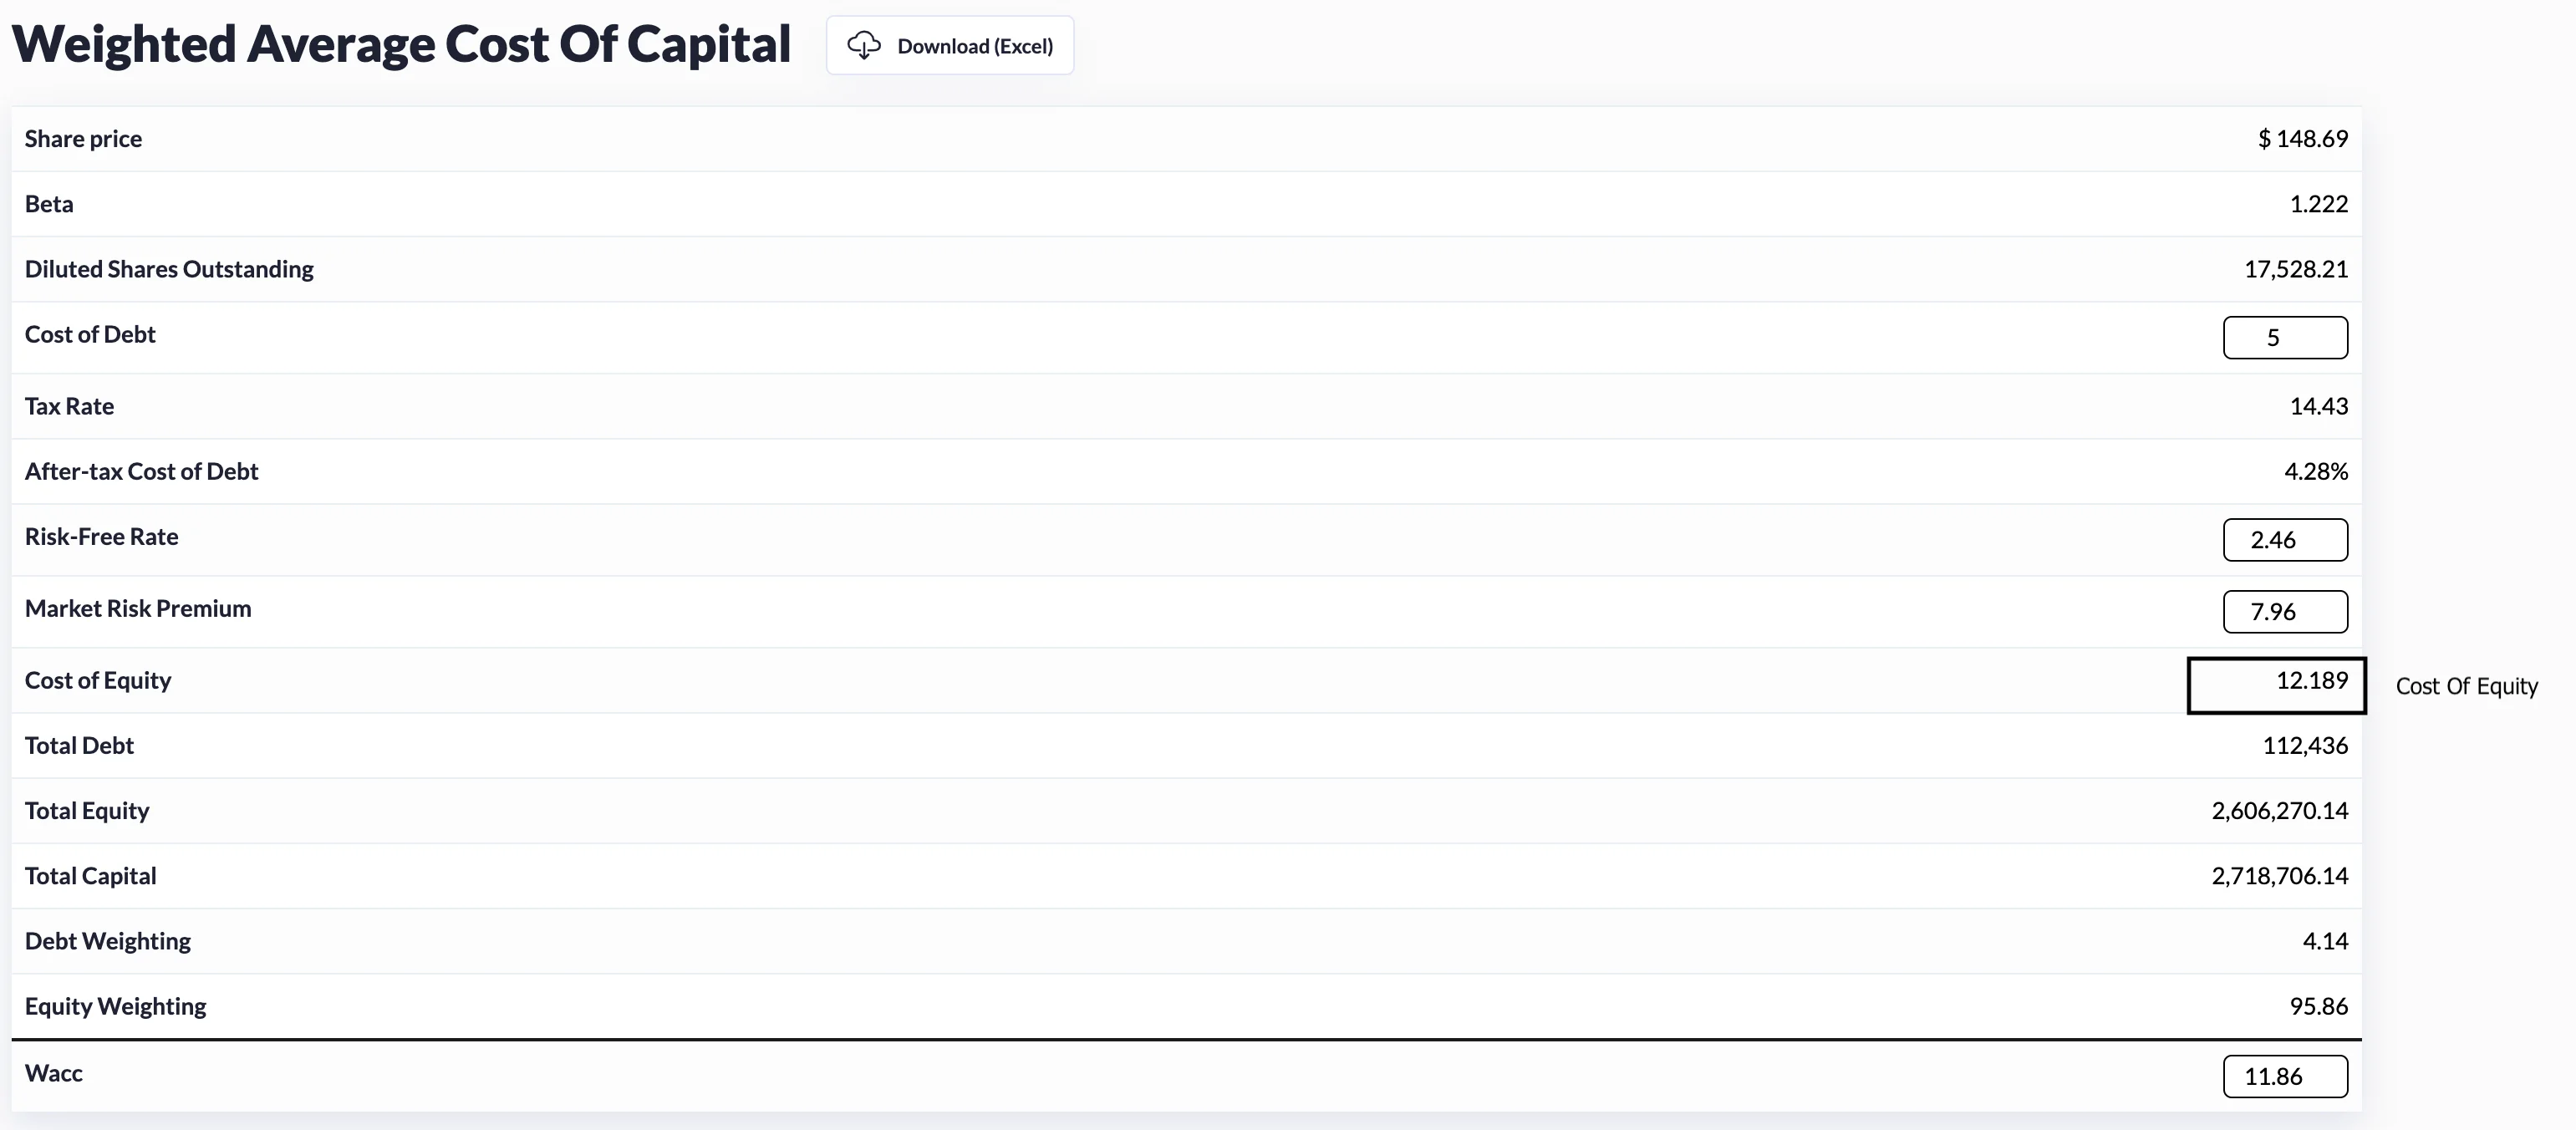
By the way, the market risk premium is very subjective and varies a lot. To make it consistent, we use the Total Equity Risk Premium
Debt holders require an understanding of the costs associated with both debt and equity. Let us determine our capital structure. Debt and equity costs are critical components of your WACC calculation.
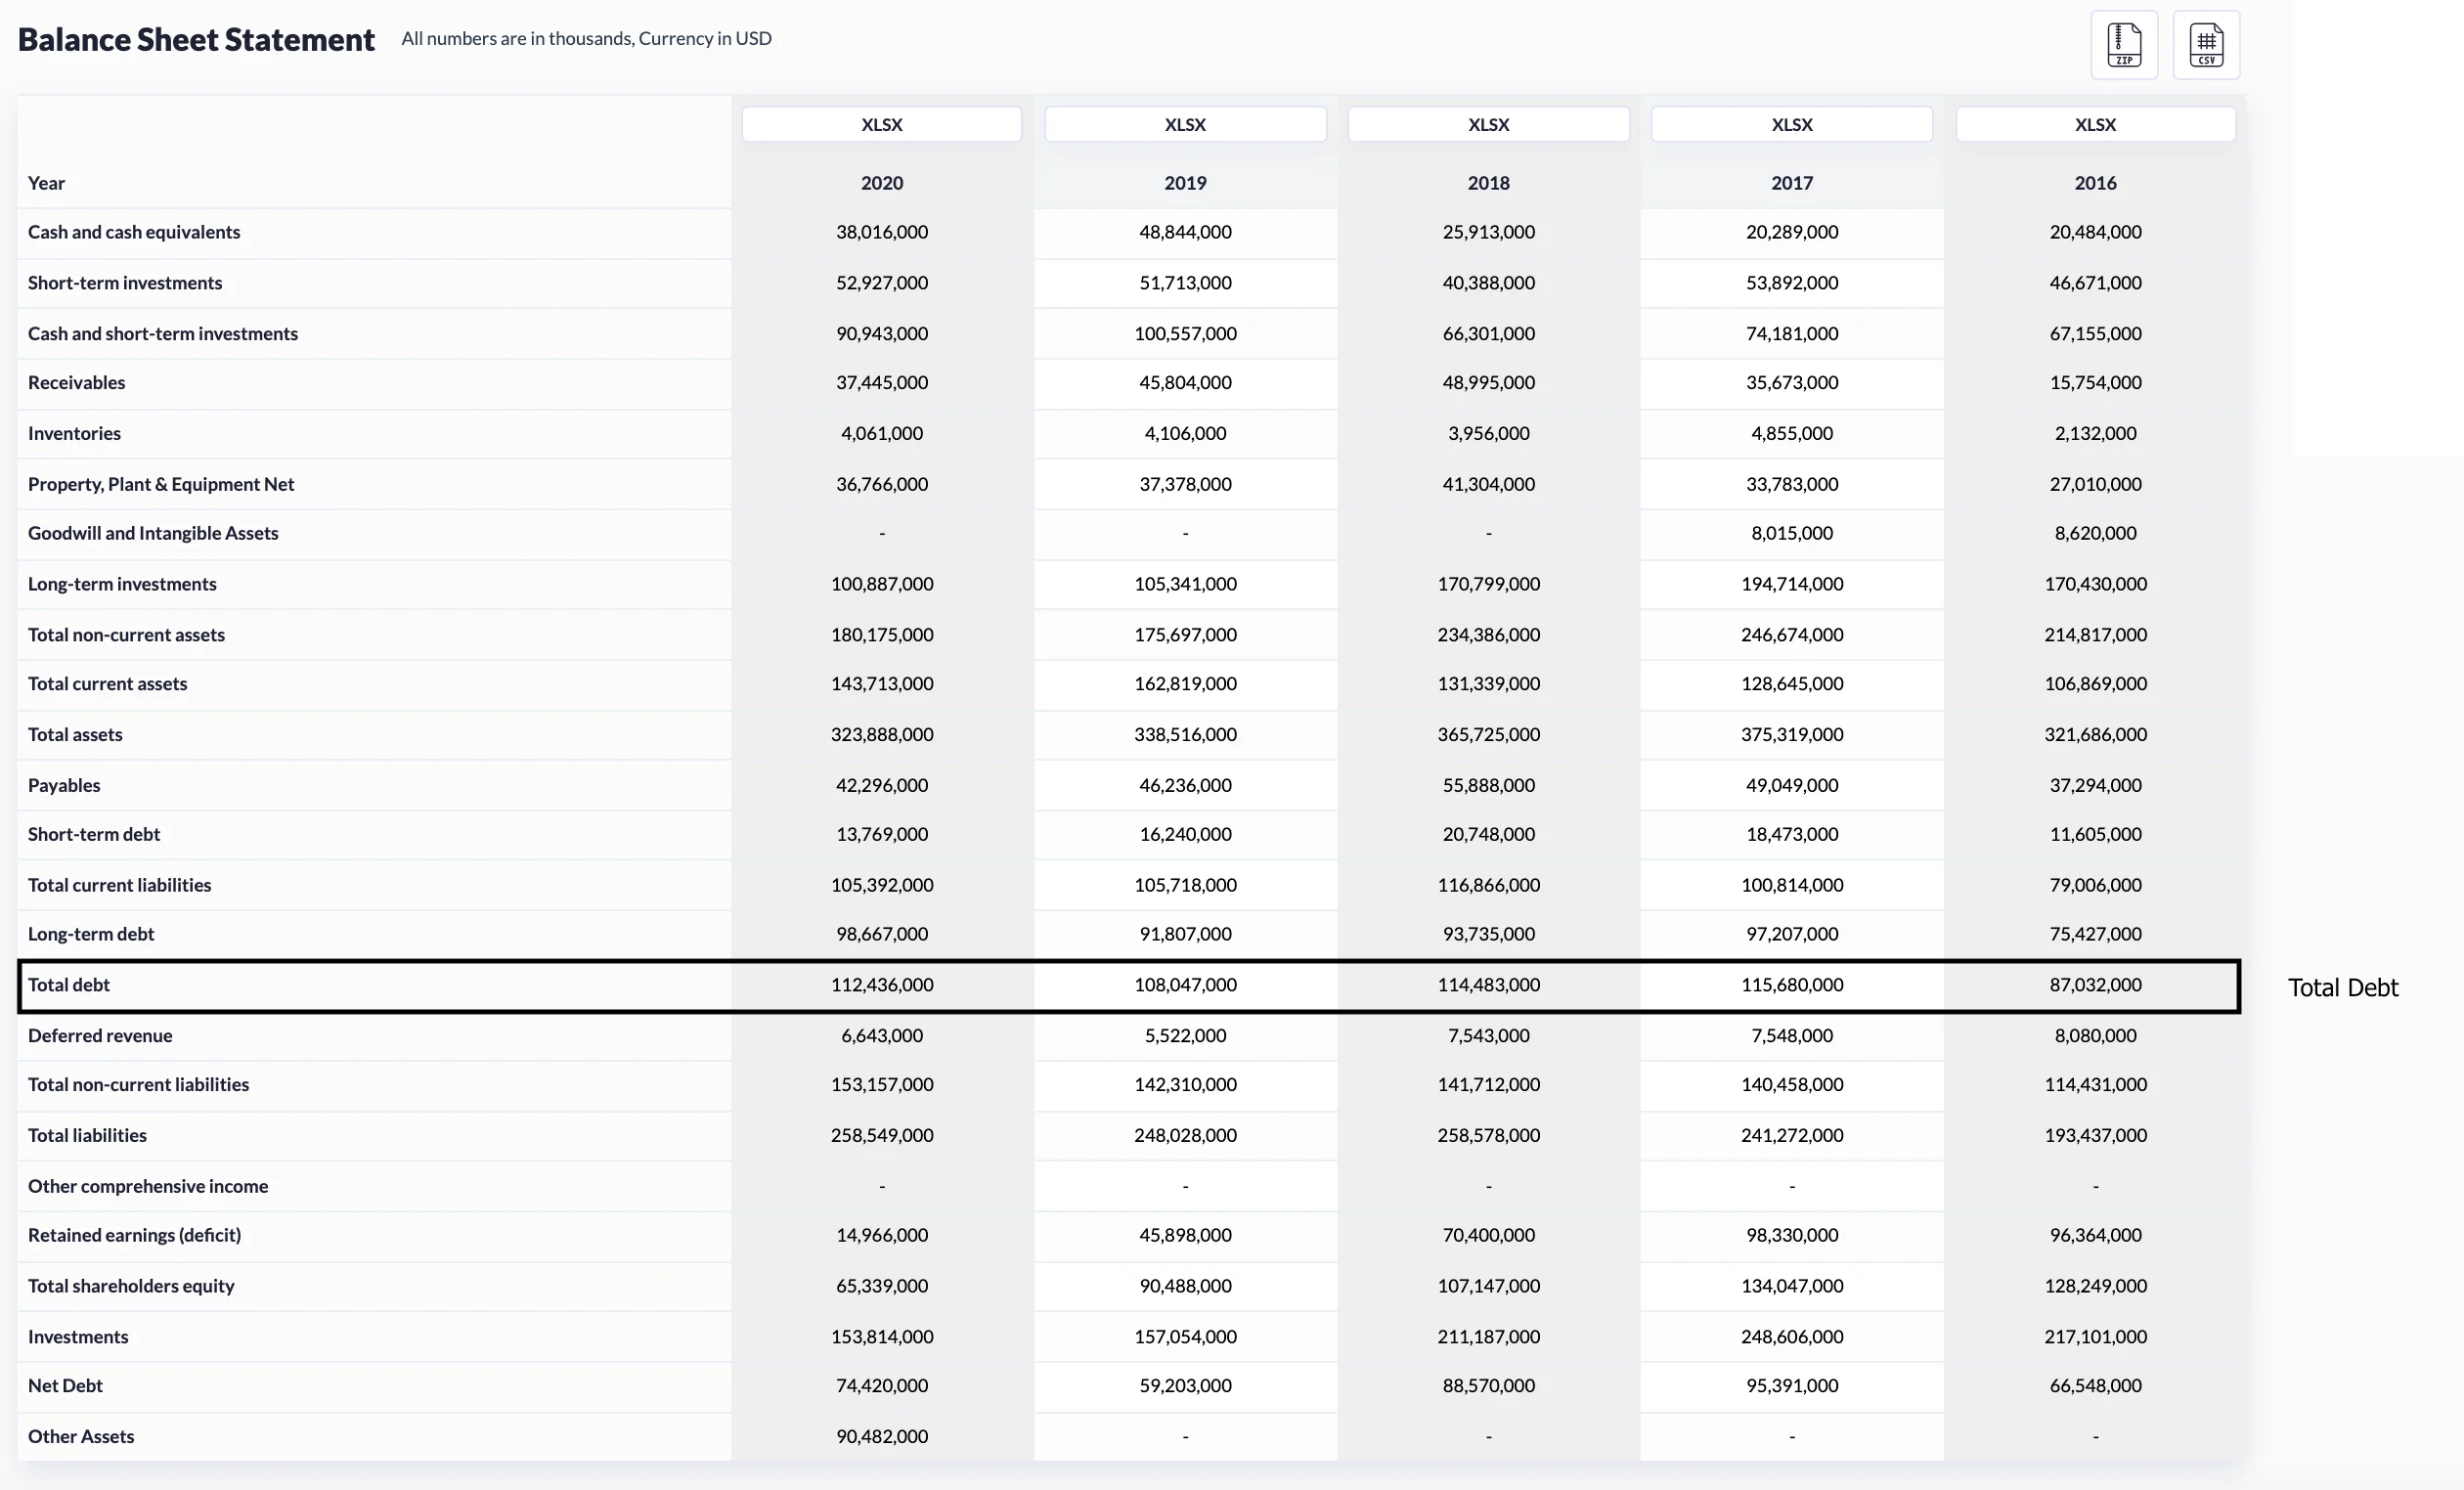
We employ a target capital structure similar to that employed by the majority of mature companies. We want to use market values for both debt and equity, but market values for debt are frequently unavailable. We use total debt from the most recent balance sheet as a proxy for market value, as book value is a good proxy for market value.
To summarize, debt book value is an acceptable proxy for debt market value. Equity is calculated as the share price multiplied by the diluted share count. Market capitalization is a term that is frequently used to refer to this value.
Total debt will be divided by total capital, whereas equity will be divided by total capital.
As you can see, this totals one hundred percent. If there were a preferred stock, you would determine the percentage of preferred stock in the capital structure and apply a weighting to it. We can now calculate WACC using our debt and equity weightings. Again, WACC is a weighted average cost of capital.
To obtain WACC multiply equity weighting times cost of equity plus debt weighting multiplied by the cost of equity. With this value in place, our cash flows can update with the appropriate present values.
Another assumption is that WACC does not change in the terminal value period. This allows our stage two to be updated to the correct present value. Now that we have calculated WACC and brought that into the model, we can calculate enterprise value, which combines stage 1 and stage 2 present values. Our next step is equity value

Top 5 Defense Stocks to Watch during a Geopolitical Tension
In times of rising geopolitical tension or outright conflict, defense stocks often outperform the broader market as gove...

Circle-Coinbase Partnership in Focus as USDC Drives Revenue Surge
As Circle Internet (NYSE:CRCL) gains attention following its recent public listing, investors are increasingly scrutiniz...

LVMH Moët Hennessy Louis Vuitton (OTC:LVMUY) Financial Performance Analysis
LVMH Moët Hennessy Louis Vuitton (OTC:LVMUY) is a global leader in luxury goods, offering high-quality products across f...

